. 2013 Jun;162(2):1060-72.
doi: 10.1104/pp.113.216762. Epub 2013 May 2.

Responses to light intensity in a genome-scale model of rice metabolism

Affiliations

Responses to light intensity in a genome-scale model of rice metabolism

Mark G Poolman et al. Plant Physiol. 2013 Jun.

Abstract

We describe the construction and analysis of a genome-scale metabolic model representing a developing leaf cell of rice (Oryza sativa) primarily derived from the annotations in the RiceCyc database. We used flux balance analysis to determine that the model represents a network capable of producing biomass precursors (amino acids, nucleotides, lipid, starch, cellulose, and lignin) in experimentally reported proportions, using carbon dioxide as the sole carbon source. We then repeated the analysis over a range of photon flux values to examine responses in the solutions. The resulting flux distributions show that (1) redox shuttles between the chloroplast, cytosol, and mitochondrion may play a significant role at low light levels, (2) photorespiration can act to dissipate excess energy at high light levels, and (3) the role of mitochondrial metabolism is likely to vary considerably according to the balance between energy demand and availability. It is notable that these organelle interactions, consistent with many experimental observations, arise solely as a result of the need for mass and energy balancing without any explicit assumptions concerning kinetic or other regulatory mechanisms.


Figures

Figure 1.
Figure 1.
Reaction flux correlation with photon flux. These are calculated as the absolute values (i.e. ignoring the distinction between correlated increases and decreases) of the pairwise (Pearson’s) correlation coefficients of each of the 142 variable fluxes with the photon flux across the range of light values. The reactions that show no flux changes are excluded.
Figure 2.
Figure 2.
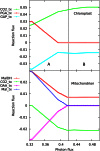
Responses of solutions in the chloroplast and mitochondrion to varying photon fluxes. Suffix _tx indicates transport of the named metabolite, positive values represent import to the compartment, and negative values represent export. The abscissa is plotted as a logarithmic scale to enable the full set of responses to be easily seen; this causes the reaction responses to appear as curves, whereas they vary linearly with light intensity, showing abrupt changes in slope where the pattern of fluxes changes. The four major flux rearrangements are indicated by vertical lines dividing the flux patterns into five major regions labeled A to E. The transition between regions A and B is shown at higher magnification in Figure 3. PGA, phosphoglycerate; GAP, glyceraldehyde 3-P; PGly, phosphoglycolate; Mal, malate; MalDH, malate dehydrogenase; Pyr, pyruvate; OAA, oxaloacetate Cplx V, complex v.
Figure 3.
Figure 3.
Chloroplast and mitochondrial transport responses at low light levels. This shows a magnified view of the transition between the states A and B shown in Figure 2. At lowest light levels, there is a maximum import of 3-phosphoglycerate (3-PGA) into the chloroplast, corresponding with the maximum export of glyceraldehyde 3-P (GAP), acting as a shuttle to export reductant and ATP. At the same point, the mitochondrial malate-oxaloacetate (Mal-OAA) shuttle is maximally active, as demonstrated by the import of Mal, the activity of malate dehydrogenase (MalDH), and the export of OAA. Thus, in this region, there is a net transfer of reductant from the chloroplast to the cytosol. The two curves for CO2 transport demonstrate the recycling from mitochondria to chloroplast.
Figure 4.
Figure 4.
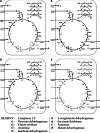
Flux distributions in the mitochondrial module at various photon fluxes. Results are shown for specific flux values in the labeled regions as follows: A, 0.3; B, 0.8; D, 4.0; and E, 8.0. State C (not shown) is intermediate between B and D. Flux figures are rounded to 1 significant figure for clarity. Reactions that are grayed out carry zero flux. In state B, all reactions are active, and this then describes the structure of the mitochondrial module. I, Complex 1; II, complex 2; III, complex 3; IV, complex 4; V, complex 5; r1, pyruvate dehydrogenase; r2, citrate synthase; r3, aconitase; r4, isocitrate dehydrogenase; r5, oxoglutarate dehydrogenase; r6, succinate thiokinase; r7, fumarase; r8, malate dehydrogenase; Cyt_red, cytochrome reduced; Cyt_ox, cytochrome oxidized; Q, ubiquinol; QH2, ubiquinone; OAA, oxaloacetate; Mal, malate; Fum, fumarate; Suc, succinate; SucCoA, succinyl CoA; IsoCit, isocitrate; Cit, citrate; H_int, internal proton; H_ext, external proton; AcAoA, acetyl-coA.
Figure 5.
Figure 5.
Variation in nitrogen source utilization with varying photon flux. Regions A and B are as shown in Figure 2. Note, however, the different photon flux range of this figure. [See online article for color version of this figure.]

References

    1. Al-Babili S, Beyer P. (2005) Golden rice—five years on the road—five years to go? Trends Plant Sci 10: 565–573 - PubMed
    1. Allen JF. (2003) Cyclic, pseudocyclic and noncyclic photophosphorylation: new links in the chain. Trends Plant Sci 8: 15–19 - PubMed
    1. Araújo WL, Nunes-Nesi A, Osorio S, Usadel B, Fuentes D, Nagy R, Balbo I, Lehmann M, Studart-Witkowski C, Tohge T, et al. (2011) Antisense inhibition of the iron-sulphur subunit of succinate dehydrogenase enhances photosynthesis and growth in tomato via an organic acid-mediated effect on stomatal aperture. Plant Cell 23: 600–627 - PMC - PubMed
    1. Bartoli CG, Gomez F, Gergoff G, Guiamét JJ, Puntarulo S. (2005) Up-regulation of the mitochondrial alternative oxidase pathway enhances photosynthetic electron transport under drought conditions. J Exp Bot 56: 1269–1276 - PubMed
    1. Boyle NR, Morgan JA. (2009) Flux balance analysis of primary metabolism in Chlamydomonas reinhardtii. BMC Syst Biol 3: 4. - PMC - PubMed

Publication types

LinkOut - more resources