

Ferroportin and exocytoplasmic ferroxidase activity are required for brain microvascular endothelial cell iron efflux
- PMID: 23640881
- PMCID: PMC3682590
- DOI: 10.1074/jbc.M113.455428
Ferroportin and exocytoplasmic ferroxidase activity are required for brain microvascular endothelial cell iron efflux
Abstract
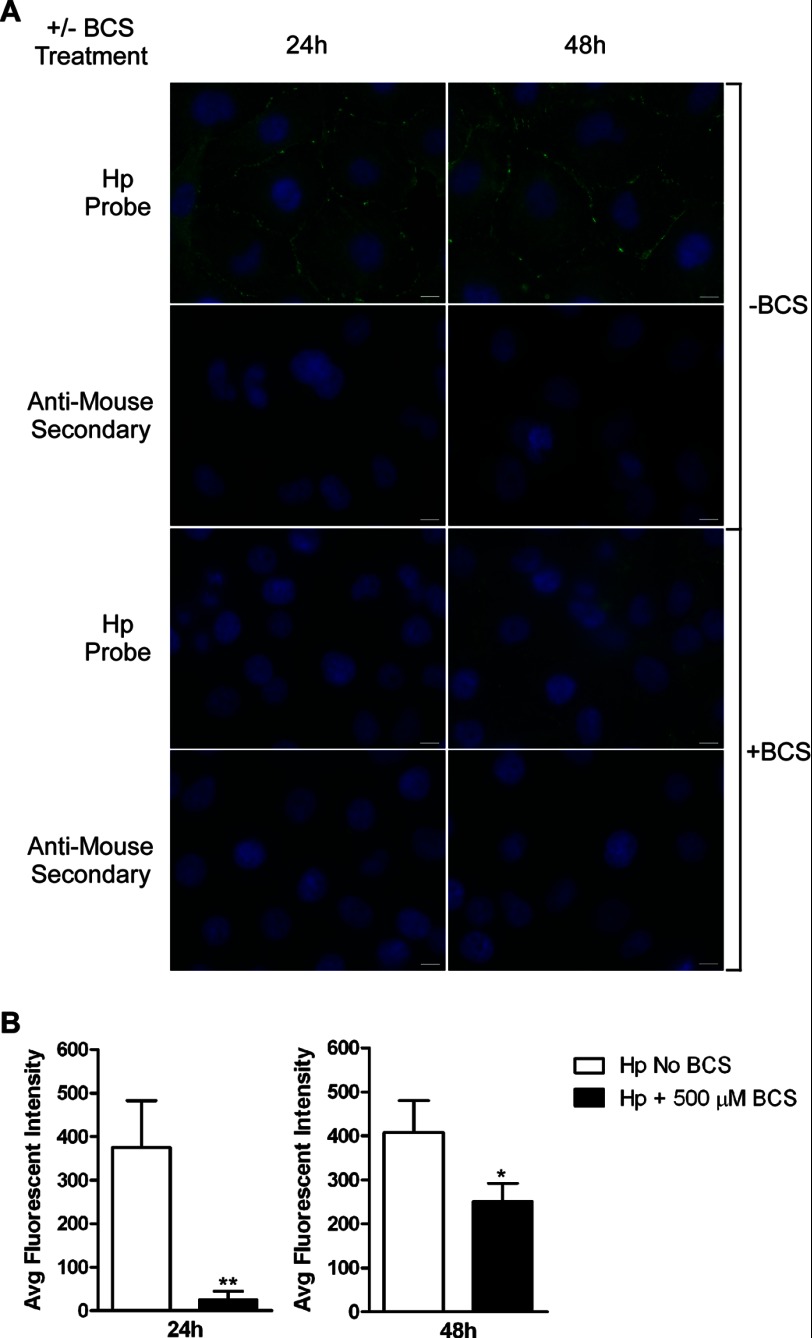
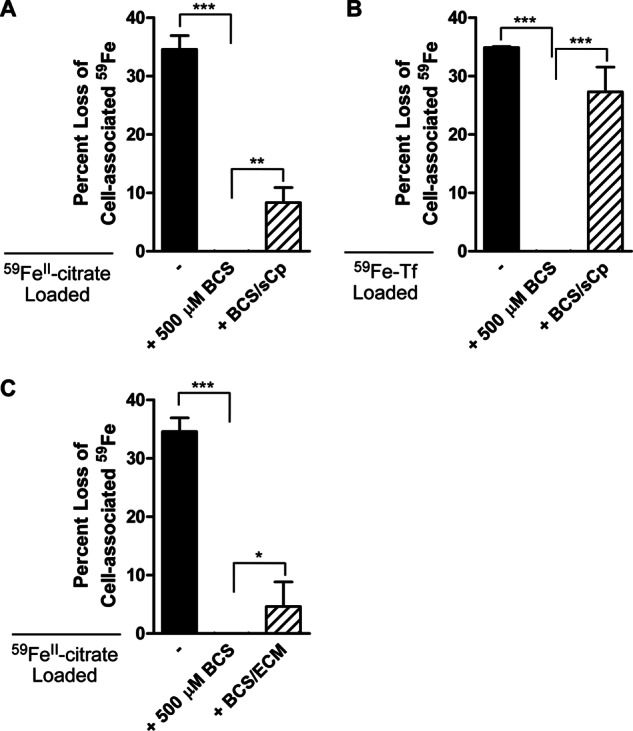
The mechanism(s) of iron flux across the brain microvasculature endothelial cells (BMVEC) of the blood-brain barrier remains unknown. Although both hephaestin (Hp) and the ferrous iron permease ferroportin (Fpn) have been identified in BMVEC, their roles in iron efflux have not been examined. Using a human BMVEC line (hBMVEC), we have demonstrated that these proteins are required for iron efflux from these cells. Expression of both Hp and Fpn protein was confirmed in hBMVEC by immunoblot and indirect immunofluorescence; we show that hBMVEC express soluble ceruloplasmin (Cp) transcript as well. Depletion of endogenous Hp and Cp via copper chelation leads to the reduction of hBMVEC Fpn protein levels as well as a complete inhibition of (59)Fe efflux. Both hBMVEC Fpn protein and (59)Fe efflux activity are restored upon incubation with 6.6 nm soluble plasma Cp. These results are independent of the source of cell iron, whether delivered as transferrin- or non-transferrin-bound (59)Fe. Our results demonstrate that iron efflux from hBMVEC Fpn requires the action of an exocytoplasmic ferroxidase, which can be either endogenous Hp or extracellular Cp.
Keywords: Blood Brain Barrier; Brain Metabolism; Cell Biology; Ceruloplasmin; Ferroportin; Ferroxidase; Hephaestin; Iron Metabolism; Neurochemistry; Transport Metals.
Figures


Similar articles
-
Glial cell ceruloplasmin and hepcidin differentially regulate iron efflux from brain microvascular endothelial cells.PLoS One. 2014 Feb 12;9(2):e89003. doi: 10.1371/journal.pone.0089003. eCollection 2014. PLoS One. 2014. PMID: 24533165 Free PMC article.
-
Fluorescence resonance energy transfer links membrane ferroportin, hephaestin but not ferroportin, amyloid precursor protein complex with iron efflux.J Biol Chem. 2019 Mar 15;294(11):4202-4214. doi: 10.1074/jbc.RA118.005142. Epub 2019 Jan 15. J Biol Chem. 2019. PMID: 30647129 Free PMC article.
-
The Ferroxidase Hephaestin But Not Amyloid Precursor Protein is Required for Ferroportin-Supported Iron Efflux in Primary Hippocampal Neurons.Cell Mol Neurobiol. 2018 May;38(4):941-954. doi: 10.1007/s10571-017-0568-z. Epub 2017 Nov 25. Cell Mol Neurobiol. 2018. PMID: 29177638 Free PMC article.
-
Multi-copper oxidases and human iron metabolism.Nutrients. 2013 Jun 27;5(7):2289-313. doi: 10.3390/nu5072289. Nutrients. 2013. PMID: 23807651 Free PMC article. Review.
-
The Ferroxidase-Permease System for Transport of Iron Across Membranes: From Yeast to Humans.Int J Mol Sci. 2025 Jan 21;26(3):875. doi: 10.3390/ijms26030875. Int J Mol Sci. 2025. PMID: 39940646 Free PMC article. Review.
Cited by
-
Brain Iron Homeostasis: A Focus on Microglial Iron.Pharmaceuticals (Basel). 2018 Nov 23;11(4):129. doi: 10.3390/ph11040129. Pharmaceuticals (Basel). 2018. PMID: 30477086 Free PMC article. Review.
-
Lactoferrin: from the structure to the functional orchestration of iron homeostasis.Biometals. 2023 Jun;36(3):391-416. doi: 10.1007/s10534-022-00453-x. Epub 2022 Oct 10. Biometals. 2023. PMID: 36214975 Review.
-
The biology of mammalian multi-copper ferroxidases.Biometals. 2023 Apr;36(2):263-281. doi: 10.1007/s10534-022-00370-z. Epub 2022 Feb 15. Biometals. 2023. PMID: 35167013 Free PMC article. Review.
-
Selenotranscriptome Network in Non-alcoholic Fatty Liver Disease.Front Nutr. 2021 Nov 17;8:744825. doi: 10.3389/fnut.2021.744825. eCollection 2021. Front Nutr. 2021. PMID: 34869521 Free PMC article.
-
The iron chelator, PBT434, modulates transcellular iron trafficking in brain microvascular endothelial cells.PLoS One. 2021 Jul 26;16(7):e0254794. doi: 10.1371/journal.pone.0254794. eCollection 2021. PLoS One. 2021. PMID: 34310628 Free PMC article.
References
-
- Salvador G. A. (2010) Iron in neuronal function and dysfunction. BioFactors 36, 103–110 - PubMed
-
- Todorich B., Pasquini J. M., Garcia C. I., Paez P. M., Connor J. R. (2009) Oligodendrocytes and myelination: The role of iron. Glia 57, 467–478 - PubMed
-
- Ganz T. (2005) Cellular iron: ferroportin is the only way out. Cell Metab. 1, 155–157 - PubMed
-
- Donovan A., Brownlie A., Zhou Y., Shepard J., Pratt S. J., Moynihan J., Paw B. H., Drejer A., Barut B., Zapata A., Law T. C., Brugnara C., Lux S. E., Pinkus G. S., Pinkus J. L., Kingsley P. D., Palis J., Fleming M. D., Andrews N. C., Zon L. I. (2000) Positional cloning of zebrafish ferroportin1 identifies a conserved vertebrate iron exporter. Nature 403, 776–781 - PubMed
-
- Wu L. J., Leenders A. G., Cooperman S., Meyron-Holtz E., Smith S., Land W., Tsai R. Y., Berger U. V., Sheng Z. H., Rouault T. A. (2004) Expression of the iron transporter ferroportin in synaptic vesicles and the blood-brain barrier. Brain Res. 1001, 108–117 - PubMed
Publication types
MeSH terms
Substances
Grants and funding
LinkOut - more resources
Full Text Sources
Other Literature Sources
Medical
Research Materials
Miscellaneous
