. 2013 Jun 14;288(24):17859-70.
doi: 10.1074/jbc.M112.440677. Epub 2013 May 2.

Fibroblast growth factor receptor like-1 (FGFRL1) interacts with SHP-1 phosphatase at insulin secretory granules and induces beta-cell ERK1/2 protein activation

Affiliations

Fibroblast growth factor receptor like-1 (FGFRL1) interacts with SHP-1 phosphatase at insulin secretory granules and induces beta-cell ERK1/2 protein activation

Pamuditha N Silva et al. J Biol Chem. .

Abstract

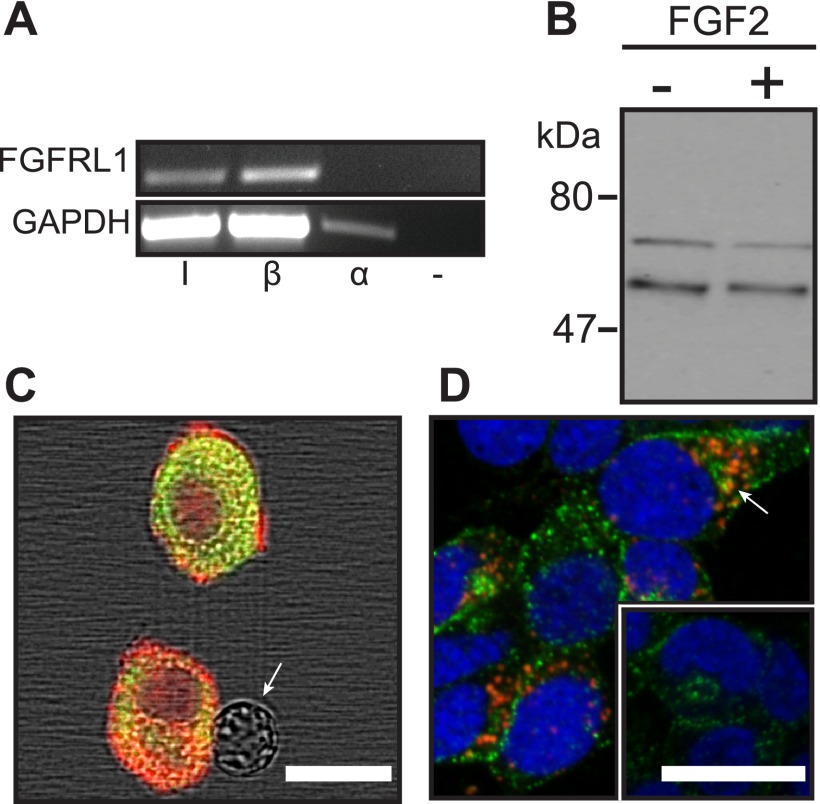
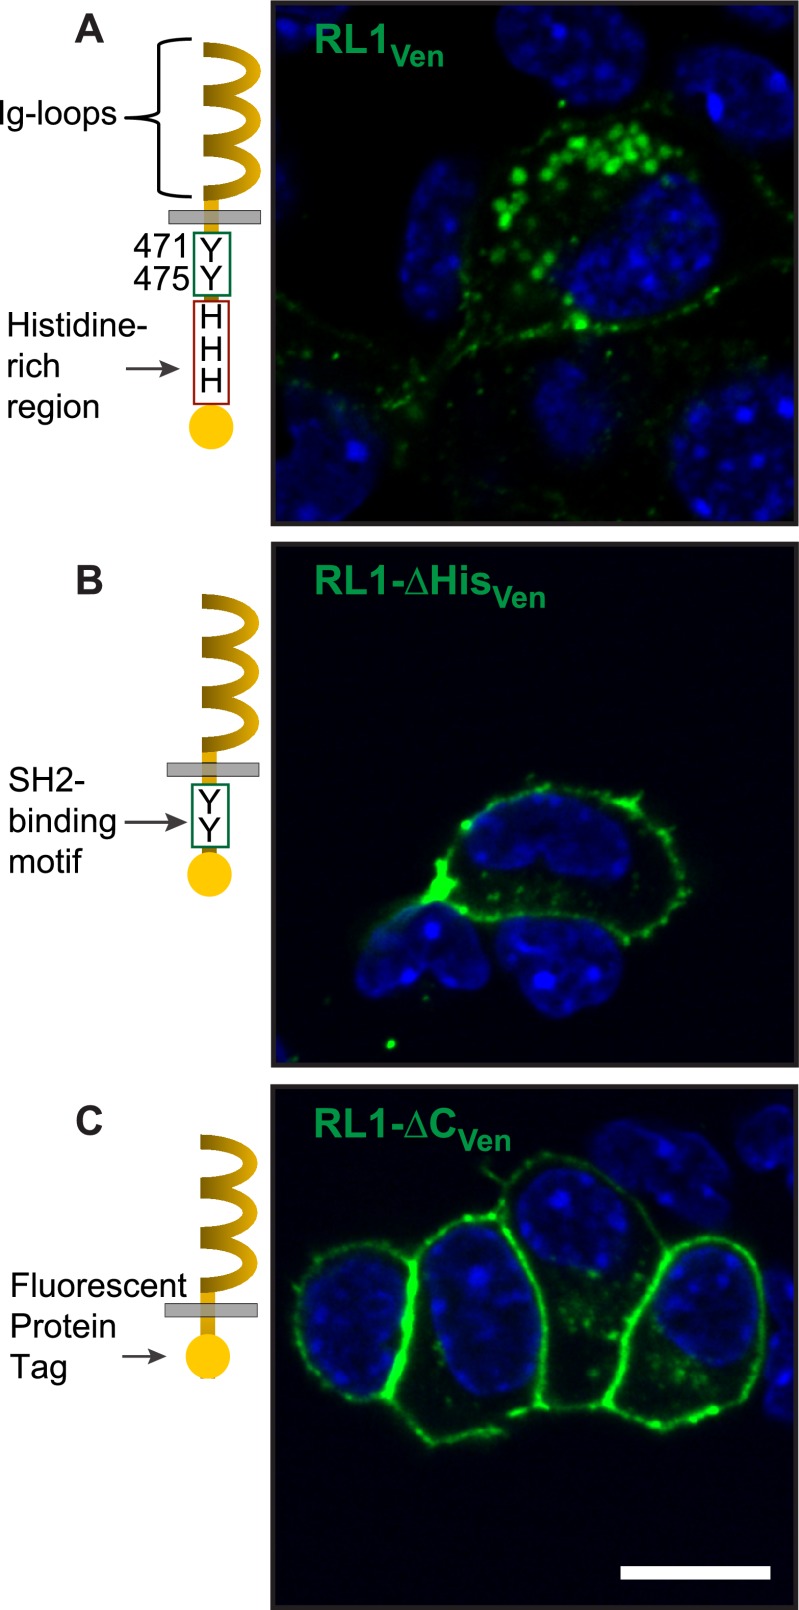
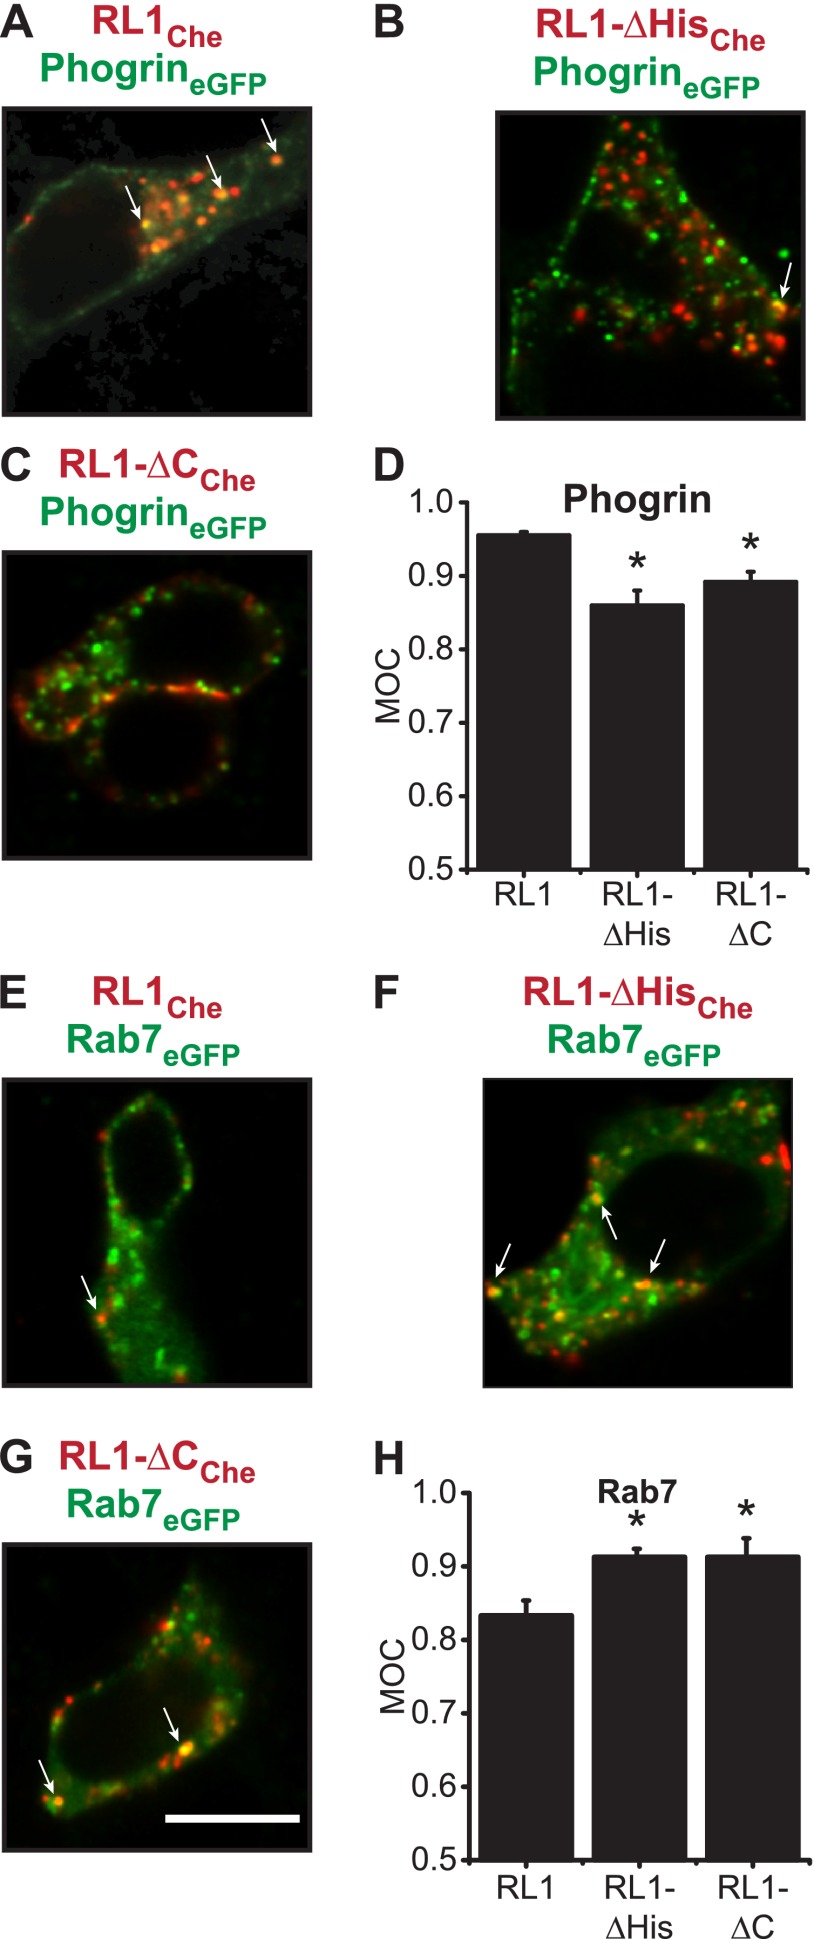
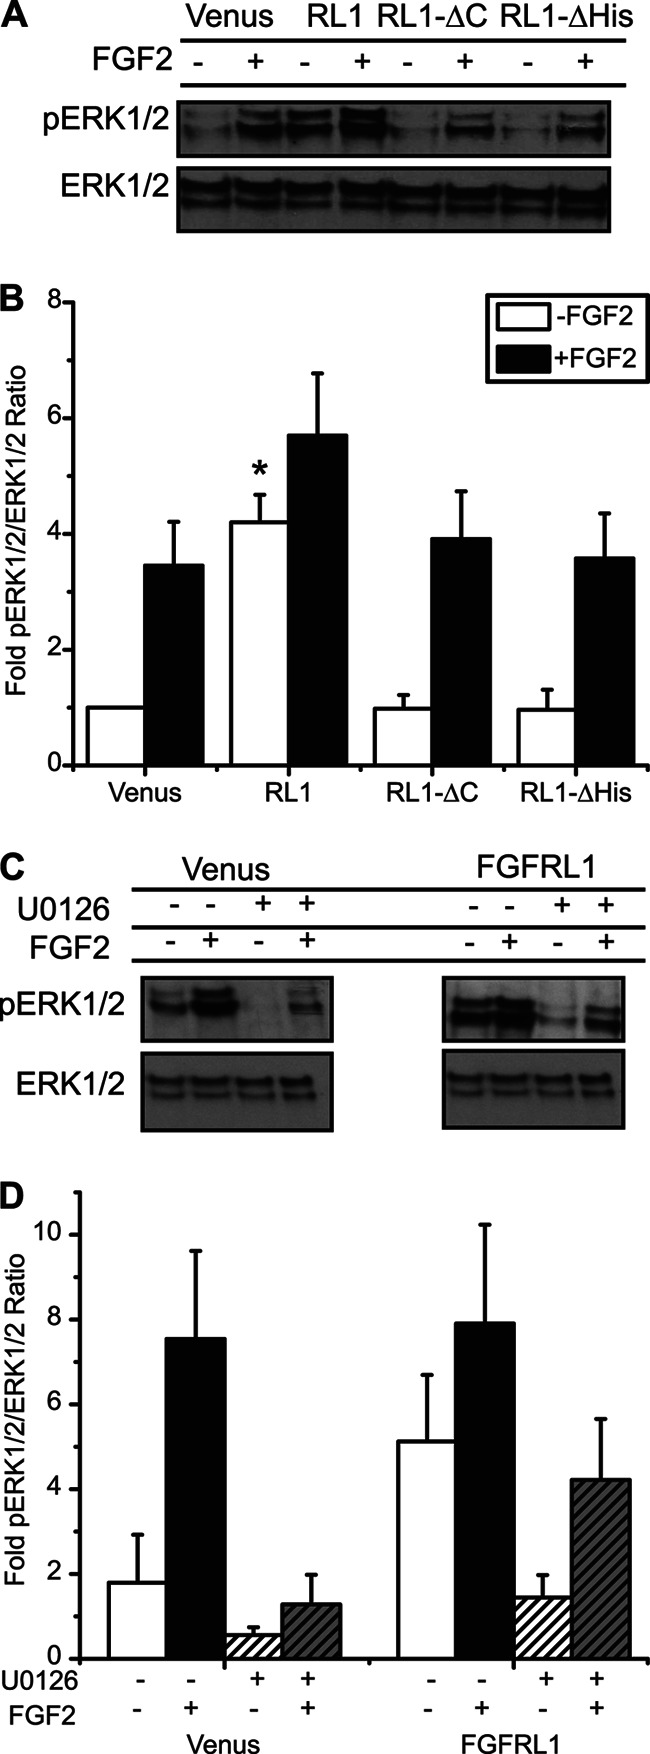
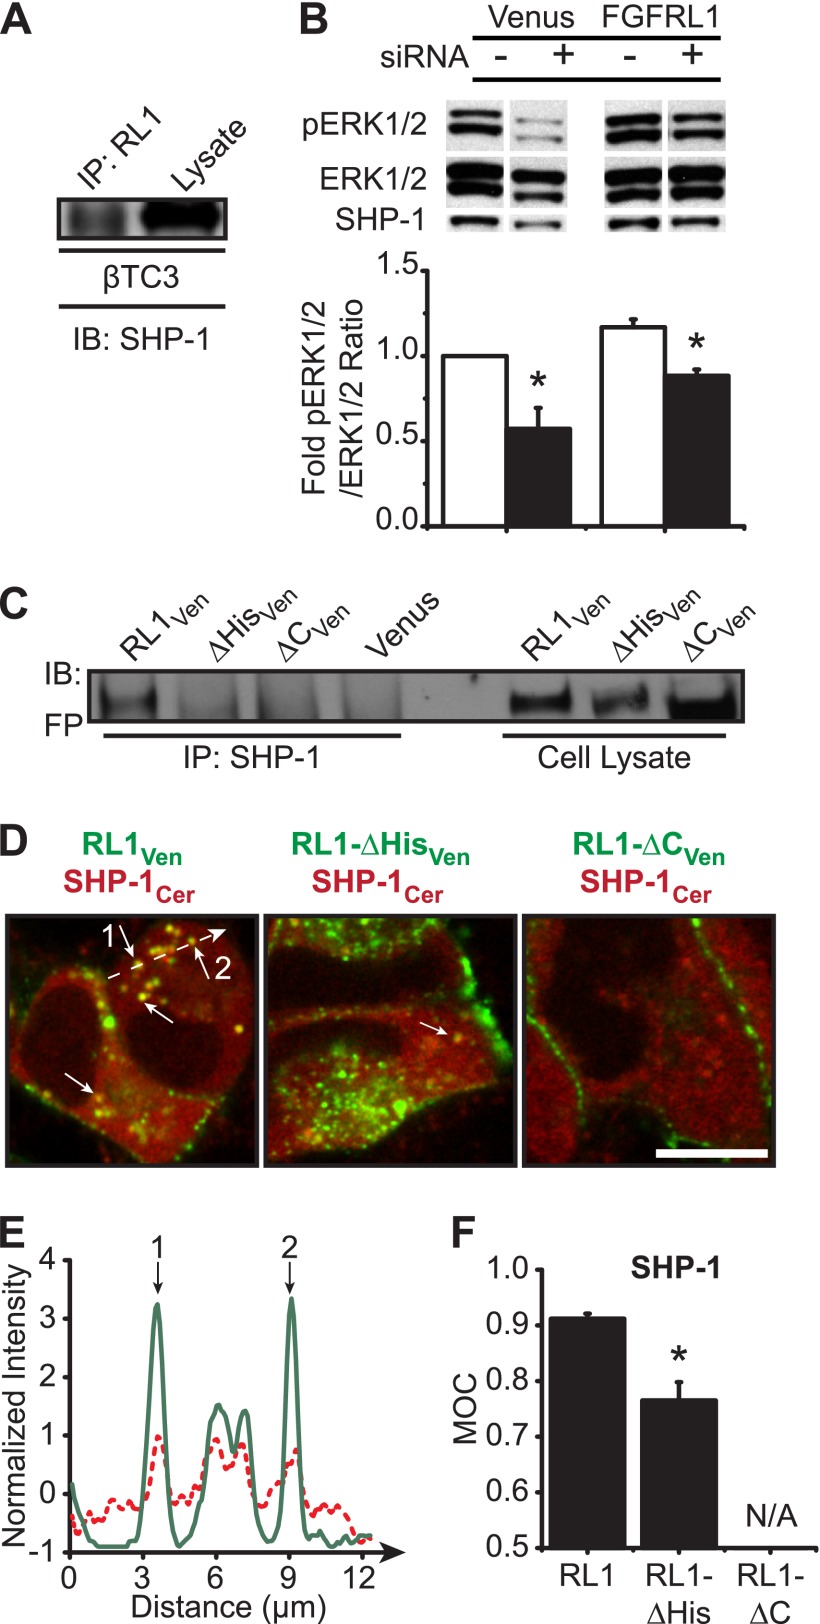
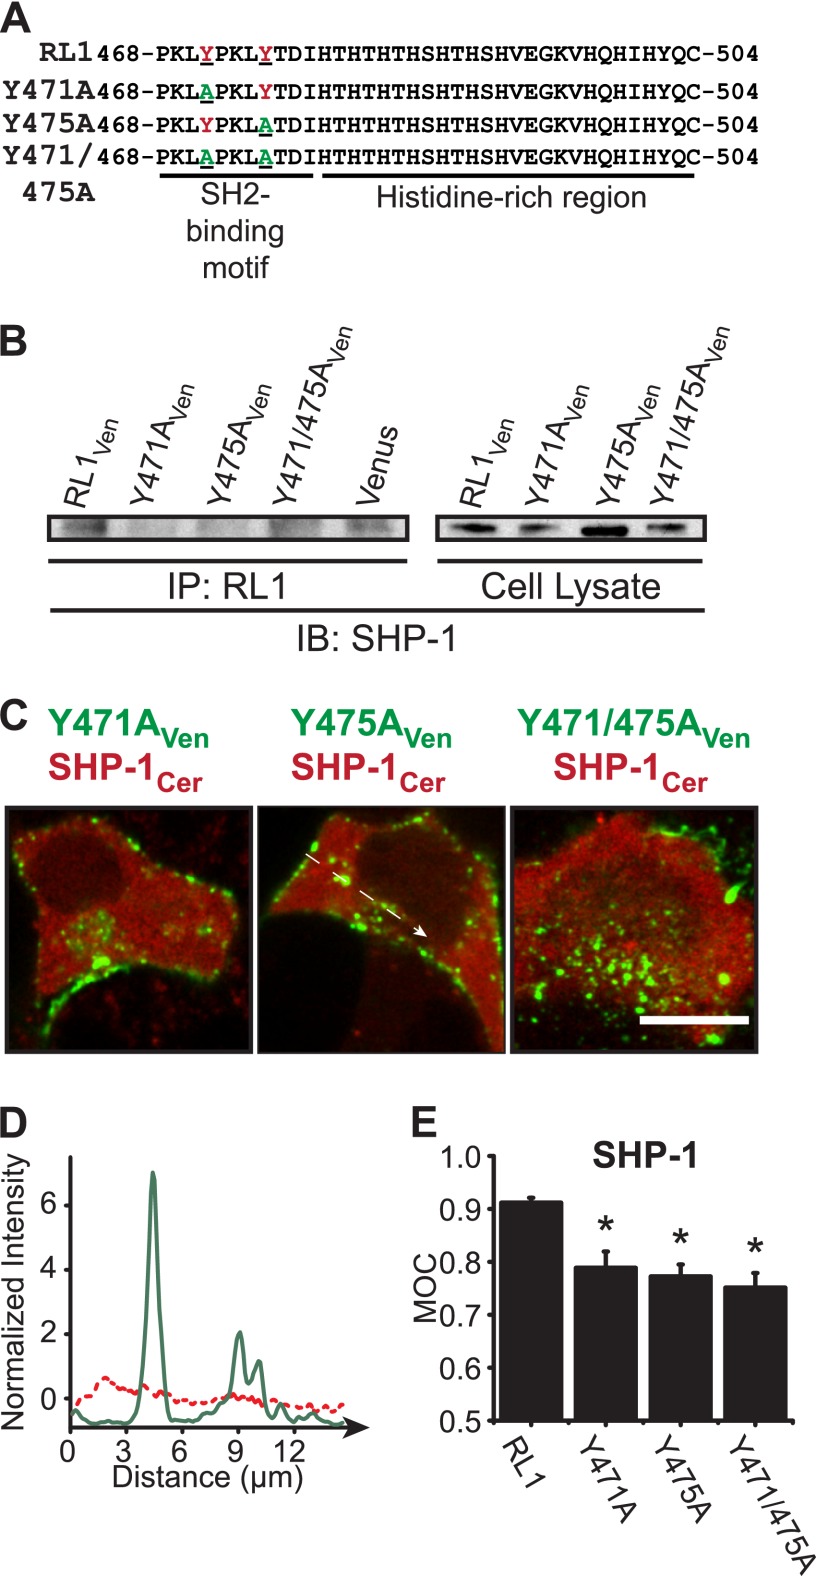
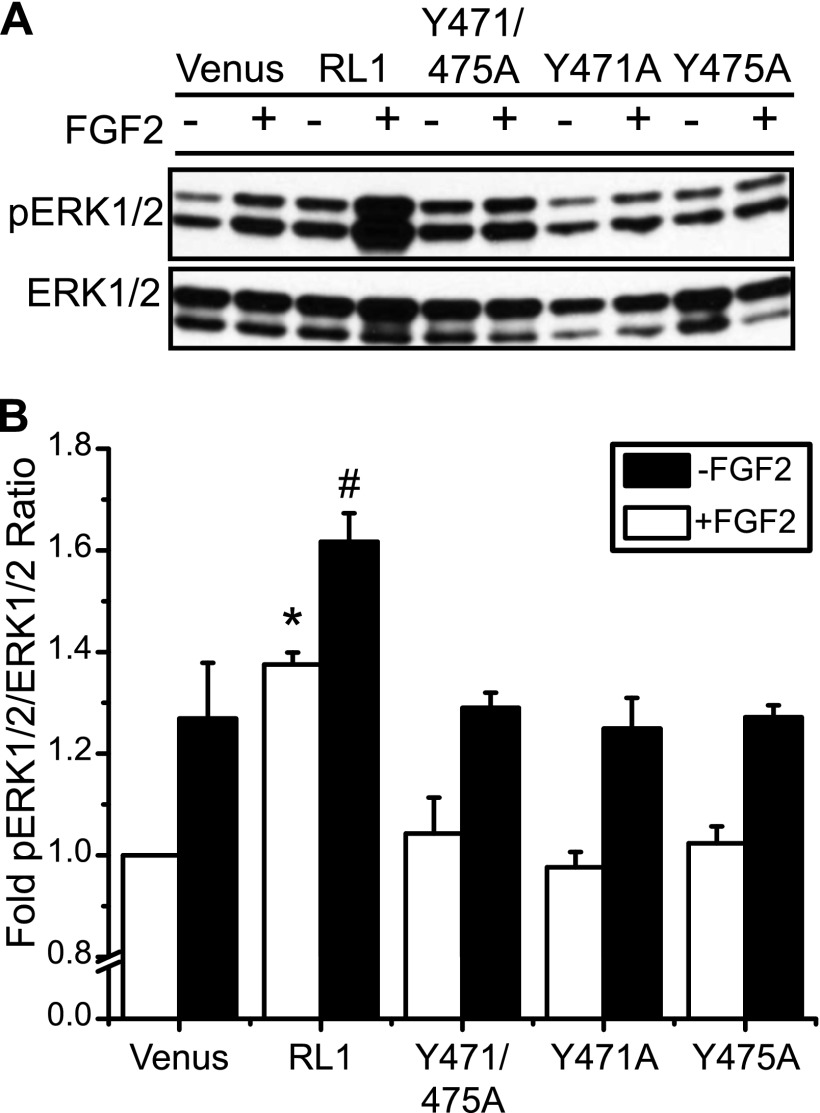
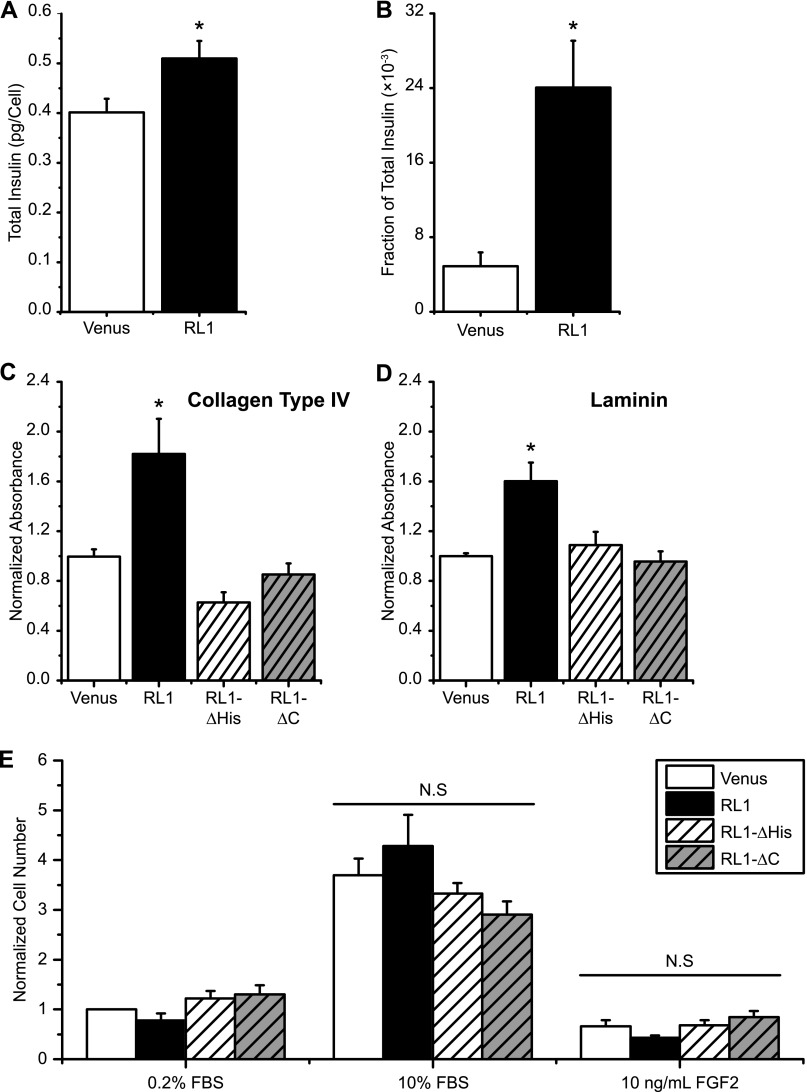
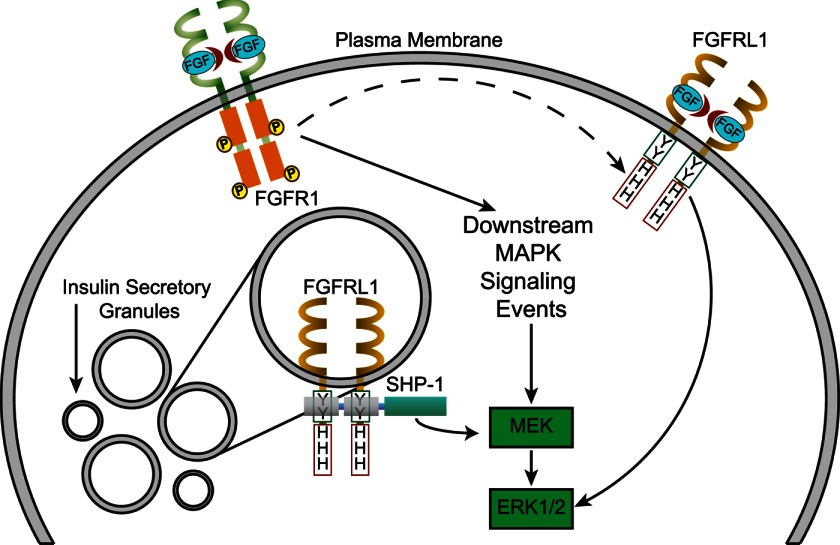
FGFRL1 is a newly identified member of the fibroblast growth factor receptor (FGFR) family expressed in adult pancreas. Unlike canonical FGFRs that initiate signaling via tyrosine kinase domains, the short intracellular sequence of FGFRL1 consists of a putative Src homology domain-2 (SH2)-binding motif adjacent to a histidine-rich C terminus. As a consequence of nonexistent kinase domains, FGFRL1 has been postulated to act as a decoy receptor to inhibit canonical FGFR ligand-induced signaling. In pancreatic islet beta-cells, canonical FGFR1 signaling affects metabolism and insulin processing. This study determined beta-cell expression of FGFRL1 as well as consequent effects on FGFR1 signaling and biological responses. We confirmed FGFRL1 expression at the plasma membrane and within distinct intracellular granules of both primary beta-cells and βTC3 cells. Fluorescent protein-tagged FGFRL1 (RL1) induced a significant ligand-independent increase in MAPK signaling. Removal of the histidine-rich domain (RL1-ΔHis) or entire intracellular sequence (RL1-ΔC) resulted in greater retention at the plasma membrane and significantly reduced ligand-independent ERK1/2 responses. The SHP-1 phosphatase was identified as an RL1-binding substrate. Point mutation of the SH2-binding motif reduced the ability of FGFRL1 to bind SHP-1 and activate ERK1/2 but did not affect receptor localization to insulin secretory granules. Finally, overexpression of RL1 increased cellular insulin content and matrix adhesion. Overall, these data suggest that FGFRL1 does not function as a decoy receptor in beta-cells, but rather it enhances ERK1/2 signaling through association of SHP-1 with the receptor's intracellular SH2-binding motif.

Keywords: Beta-cell; FGFR5; FGFRL1; Fibroblast Growth Factor Receptor (FGFR); MAP Kinases (MAPKs); PTPN6; Receptor Tyrosine Kinase; SHP-1; Signal Transduction.


Figures

FIGURE 1.
FIGURE 1.
FGFRL1 is expressed in insulin-secreting pancreatic islet beta-cells. A, Fgfrl1 mRNA was amplified by RT-PCR in islet samples (I) and insulin-secreting beta-cells (β = βTC3) but not α-cells (α = αTC1) or a DNA-deficient sample (−). The Gapdh housekeeping gene was amplified as a loading control. B, FGFRL1 protein bands of ∼53 and 65–70 kDa were visualized in βTC3 cell lysates by Western immunoblotting. Molecular mass markers (kDa) are indicated at left. C, polyclonal antibody co-immunofluorescent detection positively identified FGFRL1 expression (red) in insulin-positive cells (green) dispersed from whole mouse islets. FGFRL1 was not detected in insulin-negative cells (arrow). D, FGFRL1-associated immunofluorescence (red) was primarily associated with discrete intracellular punctate regions in βTC3 cells but was excluded from nuclei (DRAQ5 counterstain; blue). FGFRL1 was frequently observed to co-localize with insulin-rich regions (green; arrow). The inset reveals R5-immunofluorescence control. Scale bars, 10 μm.
FIGURE 2.
FIGURE 2.
Unique C-terminal domain directs intracellular expression of FGFRL1 in βTC3 cells. A, confocal microscopy images of live βTC3 cells overexpressing full-length FGFRL1 tagged with Venus fluorescent protein (RL1Ven) reveal receptor-associated fluorescence primarily in distinct punctate regions within the cytosol. Exclusion of the histidine-rich zinc-binding region (RL1-ΔHisVen) (B) or removal of the intracellular domain (RL1-ΔCVen) revealed enhanced receptor expression at the cell membrane (C). Scale bar, 10 μm.
FIGURE 3.
FIGURE 3.
C-terminal domain of FGFRL1 directs receptor trafficking to insulin secretory granules and late recycling endosomes. A–C, two-color confocal imaging revealed that co-localization of FGFRL1 (RL1Che; red) with PhogrineGFP (phosphatase of insulin secretory granules, tagged with green fluorescent protein; green) was reduced when the receptor C-terminal domain was truncated (RL1-ΔCChe or RL1-ΔHisChe; as indicated). Protein co-localization was defined by yellow pixels in image overlays (arrows). D, MOC was calculated for distinct punctate regions in each sample image (A–C) and plotted as mean MOC ± S.E. *, p < 0.05 compared with RL1 + Phogrin using one-way ANOVA. n = 3. E–G, conversely, association of FGFRL1Che (red) with Rab7eGFP (a fluorescent marker of late recycling endosomes; green) occurred at higher frequency for the C-terminal mutant receptor constructs (as indicated; arrows). Scale bar, 10 μm. H, MOC was calculated for distinct punctate regions in each sample image (E–G) and plotted as mean MOC ± S.E. *, p < 0.05 compared with RL1 + Rab7 using one-way ANOVA. n = 3.
FIGURE 4.
FIGURE 4.
C-terminal domain of FGFRL1 activates the MEK/MAPK signaling pathway independent of receptor-ligand association. A, representative phospho-ERK1/2 (pERK1/2) and total ERK1/2 immunoblots, and B, mean fold-change in phospho-ERK1/2 responses revealed a significant increase in activity associated with overexpression of full-length FGFRL1 (RL1), both in the absence (−) and presence (+) of FGF2 ligand (10 ng/ml for 10 min). Independent of ligand stimulation, ERK1/2 phosphorylation was reduced to comparable Venus control levels when either the C-terminal domain (RL1-ΔC) or histidine-rich region (RL1-ΔHis) was removed. *, p < 0.05 compared with Venus, RL1-ΔC, and RL1-ΔHis controls using one-way ANOVA. n = 4. C and D, enhanced phosphorylation of ERK1/2 in FGFRL1-overexpressing cells (FGFRL1 −/−) was reduced to control levels when cells were pretreated with the MEK inhibitor U0126 (FGFRL1 +/− compared with Venus −/−). Pretreatment with U0126 also reduced FGF-2-stimulated phosphorylation to control levels for both control (Venus +/+ compared with Venus −/−) and FGFRL1 (FGFRL1 +/+ compared with FGFRL1 −/−) cells. Representative blots are shown; each phospho-ERK1/2 blot was stripped and reprobed for total ERK1/2 to assess sample loading integrity and determine ERK1/2 activation (pERK1/2/ERK1/2 intensity ratios). Data are plotted as the mean fold-change in phospho-ERK1/2 response ± S.E. compared with Venus control. n = three separate experiments.
FIGURE 5.
FIGURE 5.
SHP-1 associates with the C-terminal domain of intracellular FGFRL1. A, endogenous SHP-1 identified by Western immunoblotting (IB) (right lane) co-immunoprecipitated (IP) with endogenous FGFRL1 in βTC3 cell lysates (left lane; representative blot shown). B, phosphorylation of ERK1/2 was significantly decreased in both Venus control and FGFRL1-overexpressing cells when SHP-1 protein levels were reduced by SHP-1 siRNA expression (+ siRNA) compared with scrambled siRNA expression (− siRNA). Representative blots are shown; pERK1/2 membranes were stripped and reprobed for ERK1/2 (to assess sample loading and determine pERK1/2:ERK1/2 intensity ratios) and SHP-1 (to assess impact of siRNA expression). Data are plotted as the mean fold-change in phospho-ERK1/2 response ± S.E. compared with Venus control for three separate experiments. *, p < 0.05 by two-sample t test compared with scrambled siRNA control. C, lysates from βTC3 cells expressing FGFRL1Ven, -ΔHisVen, -ΔCVen, and control Venus were immunoprecipitated (left lanes) with anti-SHP-1 and immunodetected using an anti-fluorescent protein antibody (Living Colors). Comparison with nonimmunoprecipitated cell lysates (right lanes) confirmed association of the full-length FGFRL1Ven construct with endogenous SHP-1. D, dual-color confocal imaging further confirmed co-localization (yellow; arrows) of full-length FGFRL1Ven protein (RL1Ven; green) with SHP-1Cer (red) in βTC3 cells (D, left panel). The long dashed arrow represents regions of interest examined in the line profile (E). Receptor/SHP-1 co-localization was reduced or below detection levels when the histidine-rich region (RL1-ΔHisVen) or the C terminus (RL1-ΔCVen) was deleted, respectively (D, middle and right panels). Scale bar, 10 μm. E, representative line profile showing normalized intensities of SHP-1Cer (red) and FGFRL1Ven (green) along an arbitrary line in D. The numerals 1 and 2 indicate overlapping peaks that correspond to punctate regions observed to have strong co-localization in D. F, MOC was calculated for distinct punctate regions from each sample and plotted as mean MOC ± S.E. (with the exception of RL1-ΔC/SHP-1 samples where co-expression was not observed; N/A, not applicable). *, p < 0.05 compared with Venus, RL1-ΔC, and RL1-ΔHis controls using one-way ANOVA. n = 4.
FIGURE 6.
FIGURE 6.
SH2-binding motif is required for SHP-1 association. A, tyrosine residues of the intracellular SH2-binding motif (red font) were point-mutated to noncatalytic alanine residues (underlined green font; Y471A; Y475A; Y471A/Y475A). B, lysate from βTC3 cells expressing FGFRL1Ven control or mutant constructs (as indicated) was immunoprecipitated (IP) (left lanes) with anti-FGFRL1 and detected by Western immunoblotting (IB) using anti-SHP-1 (BD Biosciences). The association of SHP-1 with full-length FGFRL1 (far left lane; molecular weight confirmed in whole cell lysate samples at right) was reduced when either of the SH2-binding domain tyrosine residues was mutated. C, two-color confocal imaging also revealed that mutation of either tyrosine residue (Tyr-471 or Tyr-475) reduced association of SHP-1 with RL1. Dashed arrow represents region of interest examined in the line profile. Scale bar, 10 μm. D, representative line profile showing normalized intensities of SHP-1Cer (red) and Y475AVen (green) along an arbitrary line in B. E, Manders' overlap coefficient for distinct punctate regions from each sample compared with FGFRL1Ven/SHP-1Cer co-expression and plotted as mean MOC ± S.E. *, p < 0.05 compared with RL1 + SHP-1 using one-way ANOVA. n = 4 or n = 3 (for Y471A/Y475A + SHP-1).
FIGURE 7.
FIGURE 7.
Intracellular SH2-binding motif of FGFRL1 is associated with activation of the MAPK signaling pathway independent of ligand stimulation. A, representative phospho-ERK1/2 (pERK1/2) and total ERK1/2 immunoblots, and B, mean fold-change in phospho-ERK1/2 responses revealed a significant decrease in activity associated with mutation of the SH2-binding motif (either single Y471A or Y475A or double Y471A/Y475A mutations) compared with full-length receptor (RL1), both in the absence (−) and presence (+) of FGF2 ligand (10 ng/ml for 10 min). *, p < 0.05 compared with Venus in the absence of FGF2 ligand using one-way ANOVA; # indicates p < 0.05 when compared with Venus in the presence of FGF2 ligand using one-way ANOVA.
FIGURE 8.
FIGURE 8.
FGFRL1 expression affects β-cell insulin content and matrix adhesion but not cellular proliferation. FGFRL1 overexpressing βTC3 cells exhibited higher total insulin content (A) and greater basal insulin secretion compared with Venus control cells (B). *, p < 0.05 by two-tailed two-sample t test. C and D, FGFRL1 overexpression also enhanced cellular adherence to extracellular matrix substrate components collagen type IV and laminin. Truncation or removal of the C-terminal domain reduced cellular adherence to levels similar to that observed for Venus control cells. n = 3 experimental cultures; three wells/experiment. E, no significant differences in cellular proliferation (5 days) were observed by overexpression of FGFRL1 independent of stimulation media examined (10% FBS or FGF-2, as indicated; 0.2% FBS control cultures). n = 5–7. *, p < 0.05 and N.S. indicates no significance using one-way ANOVA.
FIGURE 9.
FIGURE 9.
Proposed mechanisms of FGFRL1-directed signaling via SHP-1. Canonical FGF receptors (i.e. FGFR1) activate downstream MAPK signaling events via ligand-induced receptor dimerization and trans-autophosphorylation. Conversely, association of SHP-1 with FGFRL1 at insulin secretory granules may localize the phosphatase, enabling up-regulation of the MAPK pathway (i.e. enhanced ERK1/2 phosphorylation). Alternatively, FGFRL1 at the plasma membrane may bind extracellular FGF ligand to elevate ERK1/2 phosphorylation by means of a MEK-independent signaling cascade.

References

    1. Hart A. W., Baeza N., Apelqvist A., Edlund H. (2000) Attenuation of FGF signalling in mouse beta-cells leads to diabetes. Nature 408, 864–868 - PubMed
    1. Kilkenny D. M., Rocheleau J. V. (2008) Fibroblast growth factor receptor-1 signaling in pancreatic islet beta-cells is modulated by the extracellular matrix. Mol. Endocrinol. 22, 196–205 - PMC - PubMed
    1. Arany E., Hill D. J. (2000) Ontogeny of fibroblast growth factors in the early development of the rat endocrine pancreas. Pediatr. Res. 48, 389–403 - PubMed
    1. Basilico C., Moscatelli D. (1992) The FGF family of growth factors and oncogenes Adv. Cancer Res. 59, 115–165 - PubMed
    1. Powers C. J., McLeskey S. W., Wellstein A. (2000) Fibroblast growth factors, their receptors and signaling. Endocr. Relat. Cancer 7, 165–197 - PubMed

Publication types

MeSH terms

Substances

LinkOut - more resources