. 2013 Apr 30:7:58.
doi: 10.3389/fncel.2013.00058. eCollection 2013.

Imaging the microanatomy of astrocyte-T-cell interactions in immune-mediated inflammation

Affiliations

Imaging the microanatomy of astrocyte-T-cell interactions in immune-mediated inflammation

Carlos Barcia Sr et al. Front Cell Neurosci. .

Abstract

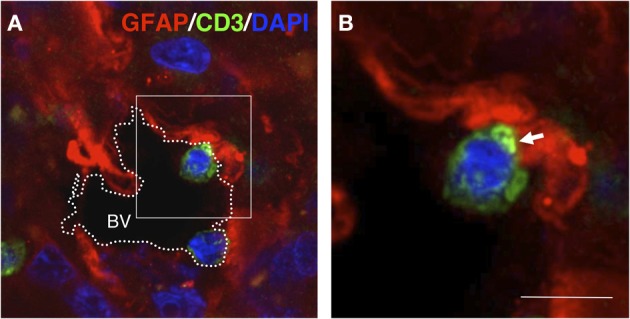
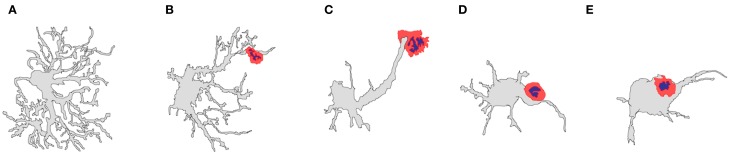
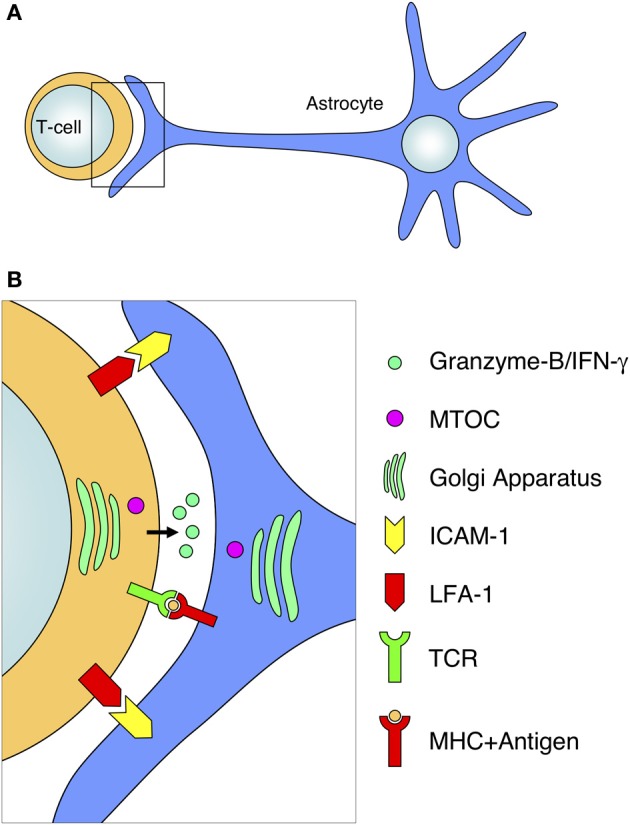
The role of astrocytes in the immune-mediated inflammatory response in the brain is more prominent than previously thought. Astrocytes become reactive in response to neuro-inflammatory stimuli through multiple pathways, contributing significantly to the machinery that modifies the parenchymal environment. In particular, astrocytic signaling induces the establishment of critical relationships with infiltrating blood cells, such as lymphocytes, which is a fundamental process for an effective immune response. The interaction between astrocytes and T-cells involves complex modifications to both cell types, which undergo micro-anatomical changes and the redistribution of their binding and secretory domains. These modifications are critical for different immunological responses, such as for the effectiveness of the T-cell response, for the specific infiltration of these cells and their homing in the brain parenchyma, and for their correct apposition with antigen-presenting cells (APCs) to form immunological synapses (ISs). In this article, we review the current knowledge of the interactions between T-cells and astrocytes in the context of immune-mediated inflammation in the brain, based on the micro-anatomical imaging of these appositions by high-resolution confocal microscopy and three-dimensional rendering. The study of these dynamic interactions using detailed technical approaches contributes to understanding the function of astrocytes in inflammatory responses and paves the way for new therapeutic strategies.

Keywords: T-cell; astrocyte; chemokines; cytokines; glioma; immune response; immunological synapse; infiltration.


Figures

Figure 1
Figure 1
Morphology of human astrocytes by immunohisto-chemistry. (A) Astrocytes in the human cortex visualized by GFAP immunohistochemistry through DAB precipitation in the peritumoral area of a glioma. (B) Astrocytes in human cortex visualized by GFAP immunofluorescence in the peritumoral area of a glioma. (C) Three-dimensional transparency of vimentin+ cells in human glioblastoma. Cells in the tumor areas were marked using immunohistochemistry with antibodies against vimentin (red) and were scanned with high-resolution confocal microscopy. Some cells maintain the typical astrocytic star shape (*), whereas others show the neoplastic morphology (+) that is characteristic of astrocytomas [modified from Carrillo-de Sauvage et al. (2012)]. Scale bar: 30 μm in (A) and (C); 25 μm in (B).
Figure 2
Figure 2
Distribution of CCL2 in GFAP+ astrocytes. Confocal rendering of an area of LPS-induced inflammation in the mouse brain. Astrocytes are labeled using immunohistochemistry with antibodies against GFAP (green), and the chemokine CCL2 is stained with anti-CCL2 antibodies (red). Nuclei are counterstained with DAPI (blue). CCL2 is expressed in astrocytes, and its intracellular distribution is higher in the terminal GFAP filaments [modified from Carrillo-de Sauvage et al. (2012)]. Scale bar: 30 μm.
Figure 3
Figure 3
Astrocytes in GBM are able to adopt various shapes and differentially express chemokines. Three-dimensional reconstruction, rendered from confocal images, of GFAP/CCL2+ astrocytes within a human brain tumor section (biopsy from glioblastoma). It is not possible to distinguish tumorigenic astrocytes from resident astrocytes, but cells adopt different shapes in the neoplastic areas, ranging from star-shaped cells to elongated cell bodies with thick and long filaments. The level of co-localization between GFAP and CCL2 can be observed as a color gradient. This gradient is shown in the scale on the right. Smaller GFAP+ cells and thinner filaments are shown in green, with low levels of CCL2 expression (green arrows and detail in 1). Larger cells and thick filaments are shown in yellow, which represents high co-localization of both markers (yellow arrows and detail in 2), suggesting that the expression of CCL2 is highly expressed in reactive astrocytes. Occasionally, astrocytes also show gem-like buds with large accumulations of CCL2 (red arrows and detail in 3). These accumulations, with high CCL2 expression and low GFAP expression, are related to the infiltration of T-cells into the tumorigenic areas [more information about this finding is presented in Carrillo-de Sauvage et al. (2012)]. Scale bar: 20 μm.
Figure 4
Figure 4
Homing of T-cells in a tumorigenic area in the human brain. (A) Confocal images of immunofluorescence for CD3+ T-cells (green) and the chemokine CCL2 (red). Cell nuclei are counterstained with DAPI (blue). CCL2+ astrocytes delimit the outer perivascular area of the BV, whereas T-cells are localized near CCL2+ perivascular astrocytes. (B) Three dimensional reconstruction of a detailed region obtained from the confocal images shown in (A). (C) Three dimensional reconstruction of a blood vessel lumen in a human glioma. Note that T-cells are apposed to the perivascular CCL2+ cells covering the internal wall of the BV lumen. Yellow spots represent co-localization of CD3 and CCL2, representing the areas of contact between the two cell types [Modified from Carrillo-de Sauvage et al. (2012)]. Scale bar: 40 μm in (A) and (C); 50 μm in (B).
Figure 5
Figure 5
T-cell–GFAP interactions in gliomas. Confocal section (0.5 μm) obtained from a human glioma biopsy. Immunohistochemistry was performed with anti-GFAP antibodies (red), anti-CD3 antibodies (green) for T-cells and DAPI for counterstaining (blue). (A) Overview of a blood vessel (BV) in the tumor area in which two T-cells are contacting GFAP+ cells at the edge of the vascular lumen. (B) High magnification of the frame indicated in (A) showing details of the T-cell–GFAP interaction. Importantly, the apposed T-cell displays clustered CD3 at the interface of the intercellular contact (arrow) [original findings can be found in Barcia et al. (2009)]. Scale bar: 15 μm.
Figure 6
Figure 6
Diagrams representing the shape variation that can be found in T-cell–astrocyte interactions in the rat striatum. Adenovirus-infected astrocytes display different shapes as the T-cell apposition become closer to the astrocyte cell body. (A) Typical astrocytic shape in the brain; (B) an astrocyte in contact with a T-cell lymphocyte (red) at its terminal processes; (C) an astrocyte in contact with a T-cell lymphocyte (red) distally at the astrocytic protrusion; (D) an astrocyte in contact with a T-cell lymphocyte (red) proximally at the astrocytic protrusion; (E) an astrocyte in contact with a T-cell lymphocyte (red) at the cell body [artistic sketches performed by CB, modified from Barcia et al. (2008a)].
Figure 7
Figure 7
Diagram of antigen-dependent T-cell–astrocyte interactions. The interaction of activated T-cells with MHC-expressing astrocytes involves a defined arrangement of various molecules and organelles. (A) Schematic representation of the interaction of a T-cell with an astrocyte at the level of the astrocytic protrusion. (B) Magnification of the T-cell–astrocyte interface from the frame depicted in (A). The T-cell–astrocyte interface is characterized by the segregation of adhesion molecules (such as LFA-1 and ICAM-1), the interaction of the TCR with MHC molecules, the release of cytotoxic compounds (such as Granzyme-B or IFN-gamma) into the intercellular space; and the rearrangement and polarization of organelles toward the interface (for example, the relocation of the MTOC and Golgi apparatus in both cell types).

Similar articles

Cited by

References

    1. Adrain C., Duriez P. J., Brumatti G., Delivani P., Martin S. J. (2006). The cytotoxic lymphocyte protease, granzyme B, targets the cytoskeleton and perturbs microtubule polymerization dynamics. J. Biol. Chem. 281, 8118–8125 10.1074/jbc.M509361200 - DOI - PubMed
    1. Attwell D., Buchan A. M., Charpak S., Lauritzen M., Macvicar B. A., Newman E. A. (2010). Glial and neuronal control of brain blood flow. Nature 468, 232–243 10.1038/nature09613 - DOI - PMC - PubMed
    1. Barcia C. Jr., Gomez A., Gallego-Sanchez J. M., Perez-Valles A., Castro M. G., Lowenstein P. R., et al. (2009). Infiltrating CTLs in human glioblastoma establish immunological synapses with tumorigenic cells. Am. J. Pathol. 175, 786–798 10.2353/ajpath.2009.081034 - DOI - PMC - PubMed
    1. Barcia C., Sanderson N. S., Barrett R. J., Wawrowsky K., Kroeger K. M., Puntel M., et al. (2008a). T cells' immunological synapses induce polarization of brain astrocytes in vivo and in vitro: a novel astrocyte response mechanism to cellular injury. PLoS ONE 3:e2977 10.1371/journal.pone.0002977 - DOI - PMC - PubMed
    1. Barcia C., Wawrowsky K., Barrett R. J., Liu C., Castro M. G., Lowenstein P. R. (2008b). In vivo polarization of IFN-gamma at Kupfer and non-Kupfer immunological synapses during the clearance of virally infected brain cells. J. Immunol. 180, 1344–1352 - PMC - PubMed