. 2013 May 1:7:168.
doi: 10.3389/fnhum.2013.00168. eCollection 2013.

Beyond Noise: Using Temporal ICA to Extract Meaningful Information from High-Frequency fMRI Signal Fluctuations during Rest

Affiliations

Beyond Noise: Using Temporal ICA to Extract Meaningful Information from High-Frequency fMRI Signal Fluctuations during Rest

Roland N Boubela et al. Front Hum Neurosci. .

Abstract

Analysis of resting-state networks using fMRI usually ignores high-frequency fluctuations in the BOLD signal - be it because of low TR prohibiting the analysis of fluctuations with frequencies higher than 0.25 Hz (for a typical TR of 2 s), or because of the application of a bandpass filter (commonly restricting the signal to frequencies lower than 0.1 Hz). While the standard model of convolving neuronal activity with a hemodynamic response function suggests that the signal of interest in fMRI is characterized by slow fluctuation, it is in fact unclear whether the high-frequency dynamics of the signal consists of noise only. In this study, 10 subjects were scanned at 3 T during 6 min of rest using a multiband EPI sequence with a TR of 354 ms to critically sample fluctuations of up to 1.4 Hz. Preprocessed data were high-pass filtered to include only frequencies above 0.25 Hz, and voxelwise whole-brain temporal ICA (tICA) was used to identify consistent high-frequency signals. The resulting components include physiological background signal sources, most notably pulsation and heart-beat components, that can be specifically identified and localized with the method presented here. Perhaps more surprisingly, common resting-state networks like the default-mode network also emerge as separate tICA components. This means that high-frequency oscillations sampled with a rather T1-weighted contrast still contain specific information on these resting-state networks to consistently identify them, not consistent with the commonly held view that these networks operate on low-frequency fluctuations alone. Consequently, the use of bandpass filters in resting-state data analysis should be reconsidered, since this step eliminates potentially relevant information. Instead, more specific methods for the elimination of physiological background signals, for example by regression of physiological noise components, might prove to be viable alternatives.

Keywords: heart rate variability; resting-state fMRI; resting-state networks; temporal ICA.


Figures
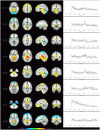
Figure 1
Figure 1
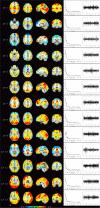
Temporal ICA components attributed to pulsation in ventricles and large blood vessels. Left: maps thresholded at 0.1 (weights in the mixing matrix). Right: frequency spectra corresponding to the ICA components represented on the left.
Figure 2
Figure 2
Temporal ICA components representing high-frequency fluctuations in brain regions commonly associated with resting-state networks. Figure layout as in Figure 1.
Figure 3
Figure 3
Temporal ICA components from non-bandpassed data corresponding to the high-frequency resting-state networks in Figure 2. Figure layout, color scale, and threshold are identical to the ones in Figure 2.
Figure 4
Figure 4
Depending on the number of components chosen, various temporally independent low-frequency components (≤0.25 Hz) are separated by the algorithm (LF 1–LF 13, left row). Note that time courses and corresponding frequency spectra (right side) are not contaminated by any high-frequency components (e.g., respiration, heart-beat, etc.), increasing functional contrast-to-noise ratio. The interpretation whether a component is (predominantly) of vascular or brain tissue origin, however, is not obvious from the spectra alone.
Figure 5
Figure 5
Temporal ICA components attributed to technical artifacts. Figure layout as in Figure 1, spatial maps are thresholded at 0.05. Note that even though they cover almost the whole brain, and thus have at least some overlap with all other components, tICA is able to separate them from the other components due to the technical artifacts distinctive temporal characteristics (visible in their power spectra).
Figure 6
Figure 6
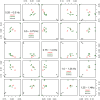
Fractional amplitude of fluctuations in frequency bands 0.25–0.5, 0.5–0.75, 0.75–1.0, 1.0–1.25, and 1.25–1.4 Hz plotted against each other for all consistent tICA components. Note that technical artifacts can easily be separated from all other components in the frequency bands 0.25–0.5, 0.5–0.75, and 0.75–1.0 Hz. Components attributed to classical resting-state networks appear as mixed with pulsation components, though they tend to have higher power in the lowest frequency range, between 0.25 and 0.5 Hz, than most of the pulsation components.
Figure 7
Figure 7
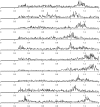
Frequency spectra of components attributed to heart-beat (with peaks in the frequency range around 1–1.3 Hz), one component for each of the 10 subjects.
Figure A1
Figure A1
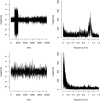
Concatenated time-series (left) and corresponding spectra (right) of two example components. Top: a component dominated by a single subject – most of the variance of the time course originates from subject 2 (time points 1001–2000 in the concatenated time-series). Bottom: a component that is equally present in all subjects, i.e., the variance in the concatenated time course is more homogeneous across subjects.

Similar articles

Cited by

References

    1. Aguirre G. K., Zarahn E., D’esposito M. (1998). The variability of human, BOLD hemodynamic responses. Neuroimage 8, 360–36910.1006/nimg.1998.0367 - DOI - PubMed
    1. Allen E. A., Erhardt E. B., Damaraju E., Gruner W., Segall J. M., Silva R. F., et al. (2011). A baseline for the multivariate comparison of resting-state networks. Front. Syst. Neurosci. 5:2.10.3389/fnsys.2011.00002 - DOI - PMC - PubMed
    1. Baglama J., Reichel L. (2005). Augmented implicitly restarted Lanczos bidiagonalization methods. SIAM J. Sci. Comput. 27, 19–4210.1137/04060593X - DOI
    1. Baglama J., Reichel L. (2012). irlba: Fast Partial SVD by Implicitly-Restarted Lanczos Bidiagonalization. R Package Version 1.0.2. Available at: http://CRAN.R-project.org/package=irlba
    1. Baumgartner R., Ryner L., Richter W., Summers R., Jarmasz M., Somorjai R. (2000). Comparison of two exploratory data analysis methods for fMRI: fuzzy clustering vs. principal component analysis. Magn. Reson. Imaging 18, 89–9410.1016/S0730-725X(00)00171-5 - DOI - PubMed

LinkOut - more resources