. 2013 May 4:13:18.
doi: 10.1186/1472-6785-13-18.

Daily temperature fluctuations unpredictably influence developmental rate and morphology at a critical early larval stage in a frog

Affiliations

Daily temperature fluctuations unpredictably influence developmental rate and morphology at a critical early larval stage in a frog

Juliana M Arrighi et al. BMC Ecol. .

Abstract

Background: Environmental temperature has profound consequences for early amphibian development and many field and laboratory studies have examined this. Most laboratory studies that have characterized the influence of temperature on development in amphibians have failed to incorporate the realities of diel temperature fluctuations (DTF), which can be considerable for pond-breeding amphibians.

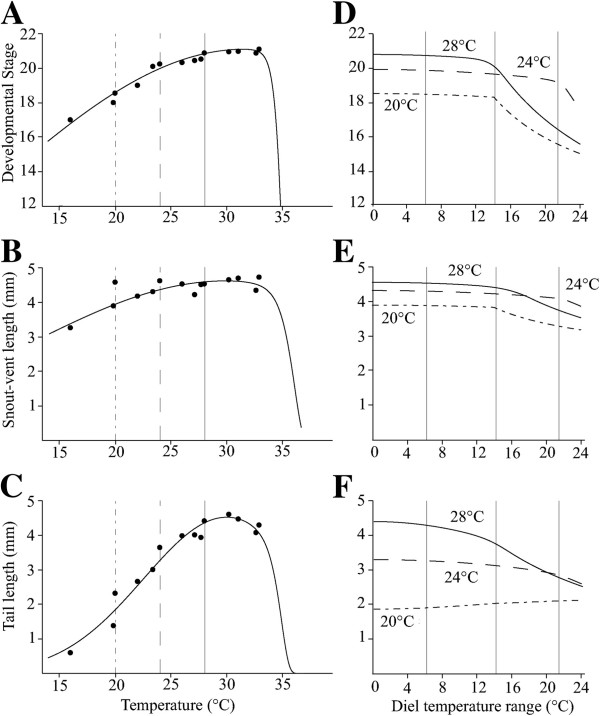
Results: We evaluated the effects of different ecologically relevant ranges of DTF compared with effects of constant temperatures on development of embryos and larvae of the Korean fire-bellied toad (Bombina orientalis). We constructed thermal reaction norms for developmental stage, snout-vent length, and tail length by fitting a Gompertz-Gaussian function to measurements taken from embryos after 66 hours of development in 12 different constant temperature environments between 14°C and 36°C. We used these reaction norms as null models to test the hypothesis that developmental effects of DTF are more than the sum of average constant temperature effects over the distribution of temperatures experienced. We predicted from these models that growth and differentiation would be positively correlated with average temperature at low levels of DTF but not at higher levels of DTF. We tested our prediction in the laboratory by rearing B. orientalis embryos at three average temperatures (20°C, 24°C, and 28°C) and four levels of thermal variation (0°C, 6°C, 13°C, and 20°C). Several of the observed responses to DTF were significantly different from both predictions of the model and from responses in constant temperature treatments at the same average temperatures. At an average temperature of 24°C, only the highest level of DTF affected differentiation and growth rates, but at both cooler and warmer average temperatures, moderate DTF was enough to slow developmental and tail growth rates.

Conclusions: These results demonstrate that both the magnitude of DTF range and thermal averages need to be considered simultaneously when parsing the effects of changing thermal environments on complex developmental responses, particularly when they have potential functional and adaptive significance.


Figures

Figure 1
Figure 1
Profiles of fluctuating temperature environments experienced by embryos in this study. Temperature was monitored every 15 minutes and averaged from two data loggers in each thermal environment. Panel A shows a matched set of four treatments with average temperatures of 24°C. Panels B and C each show a matched set of two treatments with average temperatures of 20°C and 28°C, respectively. Lowercase letters refer to the magnitude of DTF in each treatment: constant temperature (c), low variation (l), medium variation (m), or high variation (h). See text for a more detailed description of these treatments.
Figure 2
Figure 2
Representative individuals at relevant developmental stages. Tadpoles were photographed alongside a mm ruler and labelled with Gosner [40] stage. We also divided stages 20 to 21 into substages based on level of eye transparency [2]. Stages were defined by the following criteria. 19: no blood circulation in the gills; 20: blood circulation in the gills and minimal corneal transparency (not shown); 20.25: corneal transparency extending 1/4 way down eye (not shown); 20.5: corneal transparency extending 1/2 way down eye; 20.75:corneal transparency extending 3/4 way down eye; 21: cornea fully transparent (not shown), 22: tailfin transparent and circulation observed.
Figure 3
Figure 3
Constant temperature reaction norms and predictions across fluctuating temperature ranges for three average temperatures. Points in panels A-C show means for in measured response variables in each constant temperature after 66 hours. In each case, the best fitting model for the reaction norm was a Gompertz-Gaussian function (R2 > 0.99), using parameters in Table 1 and described in the text. Vertical lines on panels A-C are drawn at average temperatures used in variable temperature treatments (solid: 28°C average; dashed: 24°C average; dot-dash: 20°C average). Panels D-F show the predictions for the variable temperature experiments, assume a uniform distribution of temperatures within the diel variation range and integrating the reaction norms over the experimentally induced environmental variation (Equation 1). Vertical lines in panels D-F indicate approximate temperature range locations of the 6°C, 14°C, and 22°C variation treatments in the DTF experiments (l, m, and h in Figure 1). Error bars show +/- 1 standard error.
Figure 4
Figure 4
Effects of average temperature and DTF. Effects shown are for developmental stage (A), snout-vent length (B), and tail length (C). Observations were from 66 hours of development in DTF environments with dotted lines connect constant treatments, and dashed lines connect response to fluctuating temperature with response to matched constant temperature. Lower case letters denote significant difference among constant temperatures (Tukey HSD P = < 0.05). Stars denote variable treatments with mean trait values that are significantly different (Tukey HSD P = < 0.05) from the matched constant temperature environment. Error bars show +/- 1 standard error.
Figure 5
Figure 5
Comparison of predictions and observations of DTF effects with response at constant temperatures. Gray bars represent predictions and black bars represent observations. An “a” implies a significant deviation of experimental values from their constant temperature counterparts (Tukey HSD P < 0.05) and a “b” implies a significant difference between experimental values and theoretically predicted deviations (Tukey HSD P < 0.05).

Similar articles

Cited by

References

    1. Spicer JI, Burggren WW. Development of physiological regulatory systems: altering the timing of crucial events. Zoology. 2003;106:91–99. doi: 10.1078/0944-2006-00103. - DOI - PubMed
    1. Kaplan RH, Phillips PC. Ecological and developmental context of natural selection: maternal effects and thermally induced plasticity in the frog Bombina orientalis. Evolution. 2006;60:142–156. - PubMed
    1. Niehaus AC, Wilson RS, Franklin CE. Short- and long-term consequences of thermal variation in the larval environment of anurans. J Anim Ecol. 2006;75:686–692. doi: 10.1111/j.1365-2656.2006.01089.x. - DOI - PubMed
    1. Meřaková E, Gvoždík L. Thermal acclimation of swimming performance in newt larvae: the influence of diel temperature fluctuations during embryogenesis. Funct Ecol. 2009;23:989–995. doi: 10.1111/j.1365-2435.2009.01588.x. - DOI
    1. Niehaus AC, Wilson RS, Seebacher F, Franklin CE. Striped marsh frog (Limnodynastes peronii) tadpoles do not acclimate metabolic performance to thermal variability. J Exp Biol. 2011;214:1965–1970. doi: 10.1242/jeb.054478. - DOI - PubMed

Publication types

LinkOut - more resources