

Plasma metabolomics identifies lipid abnormalities linked to markers of inflammation, microbial translocation, and hepatic function in HIV patients receiving protease inhibitors
- PMID: 23641933
- PMCID: PMC3655873
- DOI: 10.1186/1471-2334-13-203
Plasma metabolomics identifies lipid abnormalities linked to markers of inflammation, microbial translocation, and hepatic function in HIV patients receiving protease inhibitors
Abstract
Background: Metabolic abnormalities are common in HIV-infected individuals on antiretroviral therapy (ART), but the biochemical details and underlying mechanisms of these disorders have not been defined.
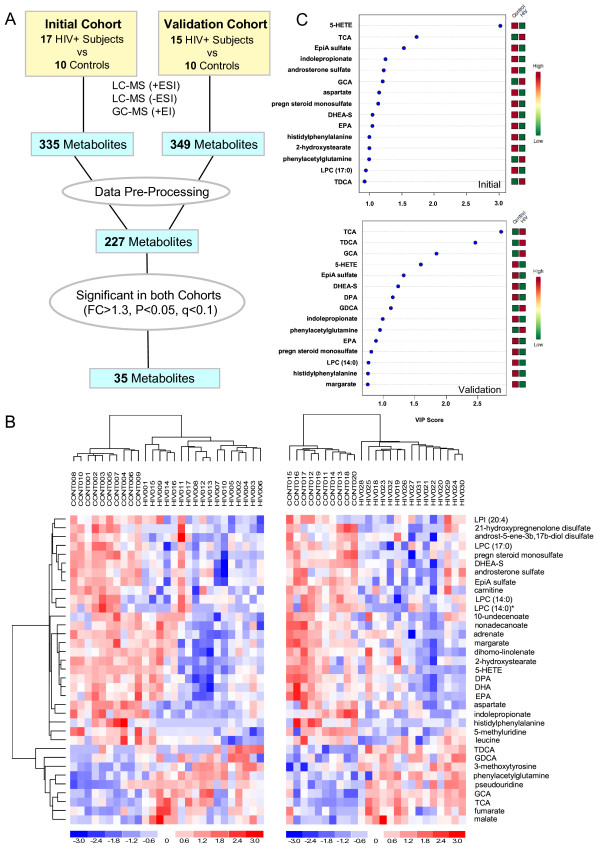
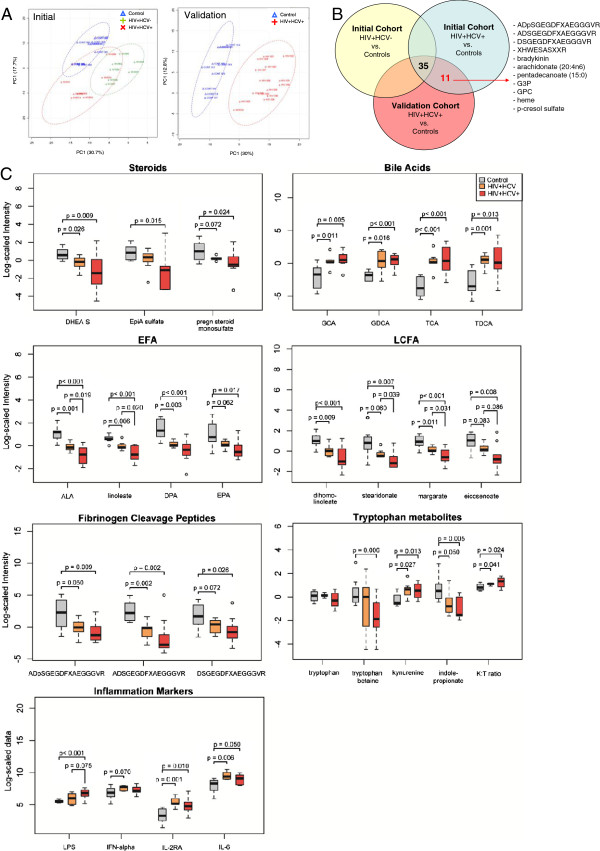
Methods: Untargeted metabolomic profiling of plasma was performed for 32 HIV patients with low nadir CD4 counts (<300 cells/ul) on protease inhibitor (PI)-based ART and 20 healthy controls using liquid or gas chromatography and mass spectrometry. Effects of Hepatitis C (HCV) co-infection and relationships between altered lipid metabolites and markers of inflammation, microbial translocation, and hepatic function were examined. Unsupervised hierarchical clustering, principal component analysis (PCA), partial least squares discriminant analysis (PLS-DA), Random forest, pathway mapping, and metabolite set enrichment analysis (MSEA) were performed using dChip, Metaboanalyst, and MSEA software.
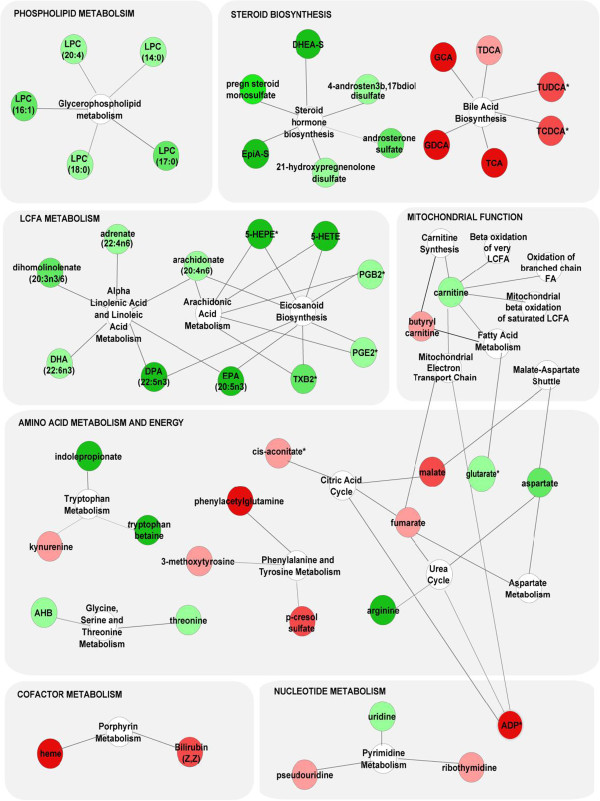
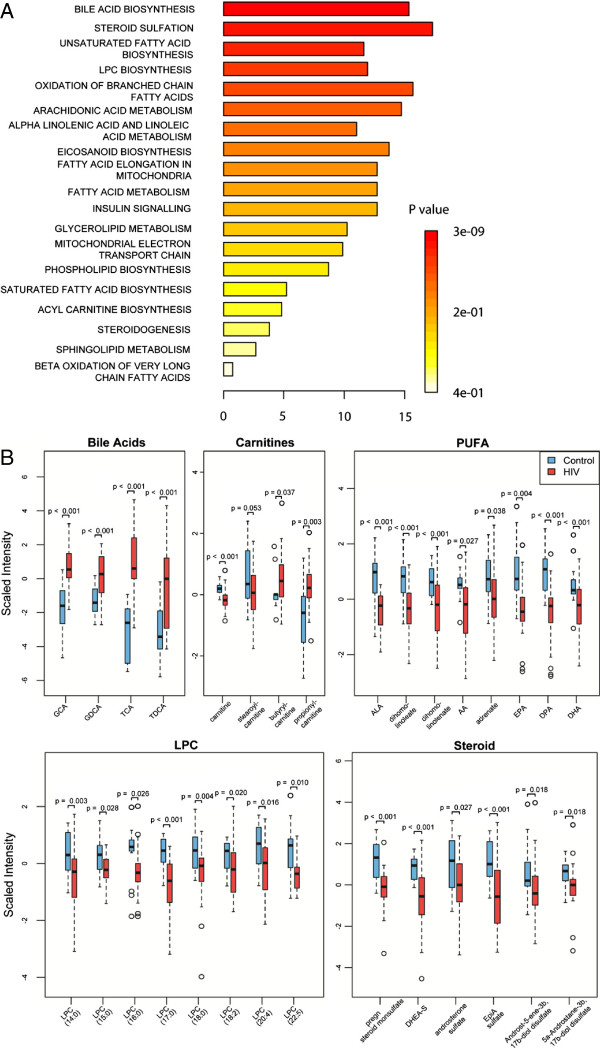
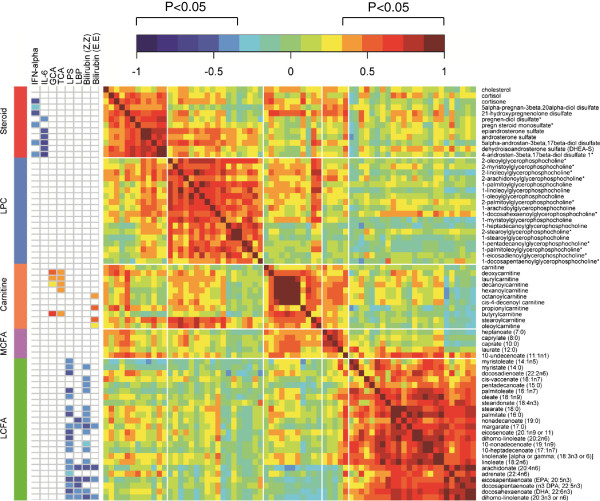
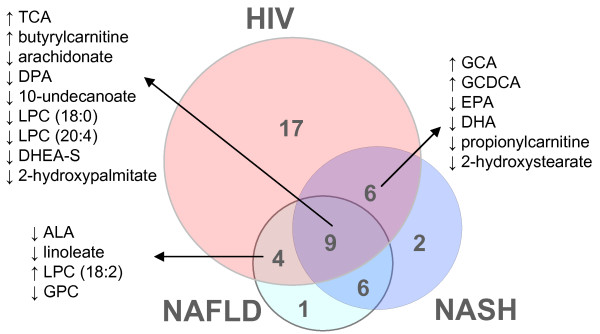
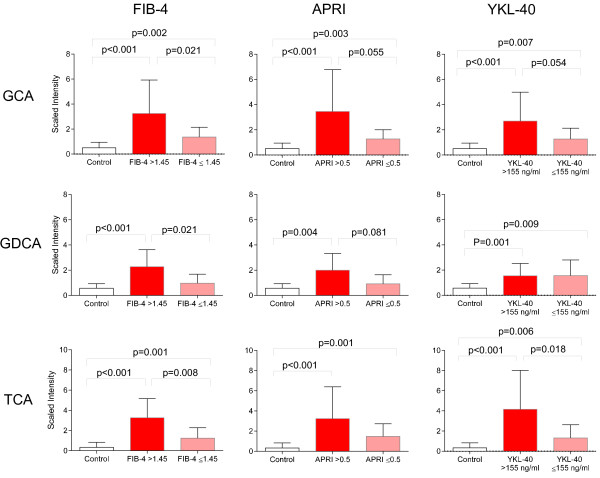
Results: A 35-metabolite signature mapping to lipid, amino acid, and nucleotide metabolism distinguished HIV patients with advanced disease on PI-based ART from controls regardless of HCV serostatus (p<0.05, false discovery rate (FDR)<0.1). Many altered lipids, including bile acids, sulfated steroids, polyunsaturated fatty acids, and eicosanoids, were ligands of nuclear receptors that regulate metabolism and inflammation. Distinct clusters of altered lipids correlated with markers of inflammation (interferon-α and interleukin-6), microbial translocation (lipopolysaccharide (LPS) and LPS-binding protein), and hepatic function (bilirubin) (p<0.05). Lipid alterations showed substantial overlap with those reported in non-alcoholic fatty liver disease (NALFD). Increased bile acids were associated with noninvasive markers of hepatic fibrosis (FIB-4, APRI, and YKL-40) and correlated with acylcarnitines, a marker of mitochondrial dysfunction.
Conclusions: Lipid alterations in HIV patients receiving PI-based ART are linked to markers of inflammation, microbial translocation, and hepatic function, suggesting that therapeutic strategies attenuating dysregulated innate immune activation and hepatic dysfunction may be beneficial for prevention and treatment of metabolic disorders in HIV patients.
Figures
References
-
- Carr A. HIV lipodystrophy: risk factors, pathogenesis, diagnosis and management. AIDS. 2003;17(Suppl 1):S141–148. - PubMed
-
- Sulkowski MS. Management of hepatic complications in HIV-infected persons. J Infect Dis. 2008;197(Suppl 3):S279–293. - PubMed
-
- Sulkowski MS. Drug-induced liver injury associated with antiretroviral therapy that includes HIV-1 protease inhibitors. Clin Infect Dis. 2004;38(Suppl 2):S90–97. - PubMed
Publication types
MeSH terms
Substances
Grants and funding
- U01MH083500/MH/NIMH NIH HHS/United States
- U01 MH083507/MH/NIMH NIH HHS/United States
- R24 MH059724/MH/NIMH NIH HHS/United States
- U01 MH083500/MH/NIMH NIH HHS/United States
- R24 NS045491/NS/NINDS NIH HHS/United States
- U24 MH100928/MH/NIMH NIH HHS/United States
- R24NS45491/NS/NINDS NIH HHS/United States
- R24 NS038841/NS/NINDS NIH HHS/United States
- N01MH22005/MH/NIMH NIH HHS/United States
- R24NS38841/NS/NINDS NIH HHS/United States
- U01MH083501/MH/NIMH NIH HHS/United States
- DP1 DA028994/DA/NIDA NIH HHS/United States
- U01 MH083501/MH/NIMH NIH HHS/United States
- U01 MH083506/MH/NIMH NIH HHS/United States
- U01MH083507/MH/NIMH NIH HHS/United States
- N01MH32002/MH/NIMH NIH HHS/United States
- U01MH083545/MH/NIMH NIH HHS/United States
- P30 CA065/6/CA/NCI NIH HHS/United States
- R24MH59724/MH/NIMH NIH HHS/United States
- CAPMC/ CIHR/Canada
- R24 MH059745/MH/NIMH NIH HHS/United States
- R24MH59745/MH/NIMH NIH HHS/United States
- U01MH083506/MH/NIMH NIH HHS/United States
- U01 MH083545/MH/NIMH NIH HHS/United States
- P30 CA006516/CA/NCI NIH HHS/United States
- P30 AI060354/AI/NIAID NIH HHS/United States
LinkOut - more resources
Full Text Sources
Other Literature Sources
Medical
Research Materials
Miscellaneous
