

Molecular mechanism of misfolding and aggregation of Aβ(13-23)
- PMID: 23642026
- PMCID: PMC3695694
- DOI: 10.1021/jp402938p
Molecular mechanism of misfolding and aggregation of Aβ(13-23)
Abstract
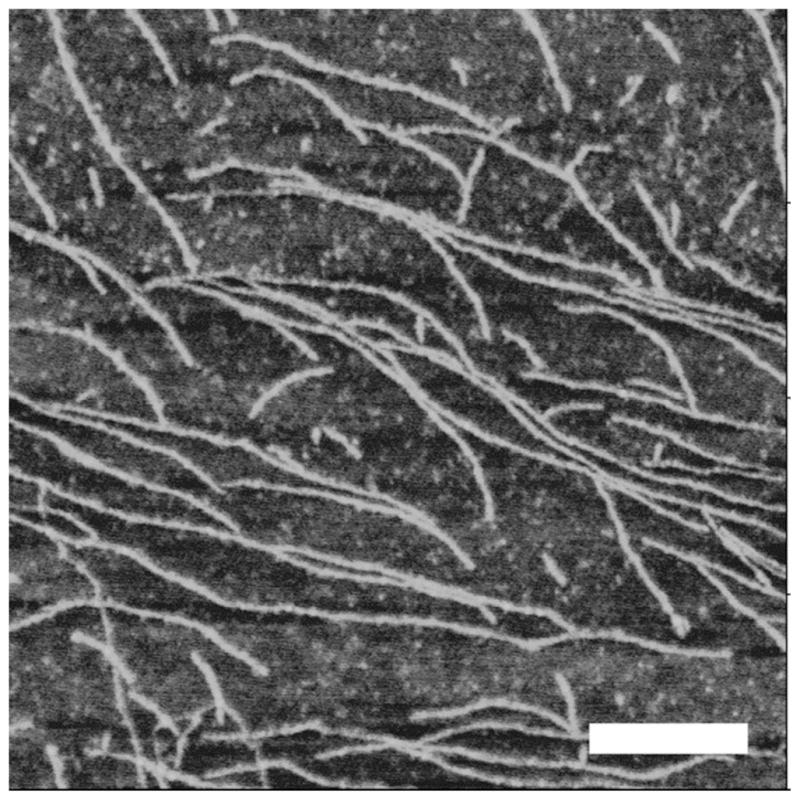
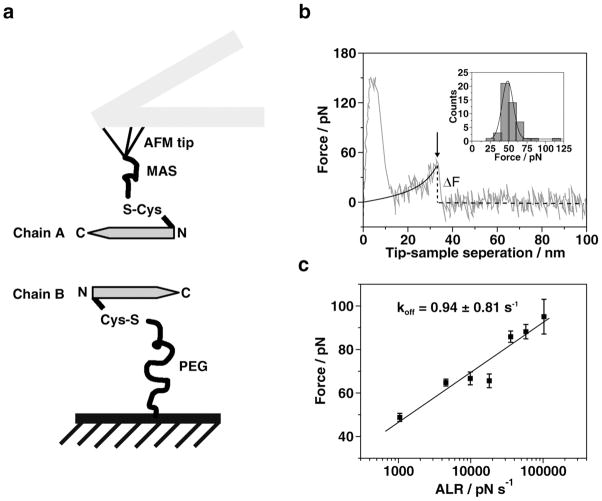
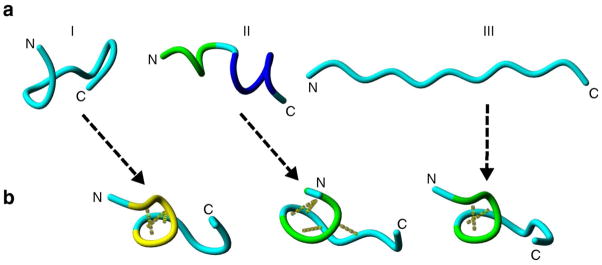
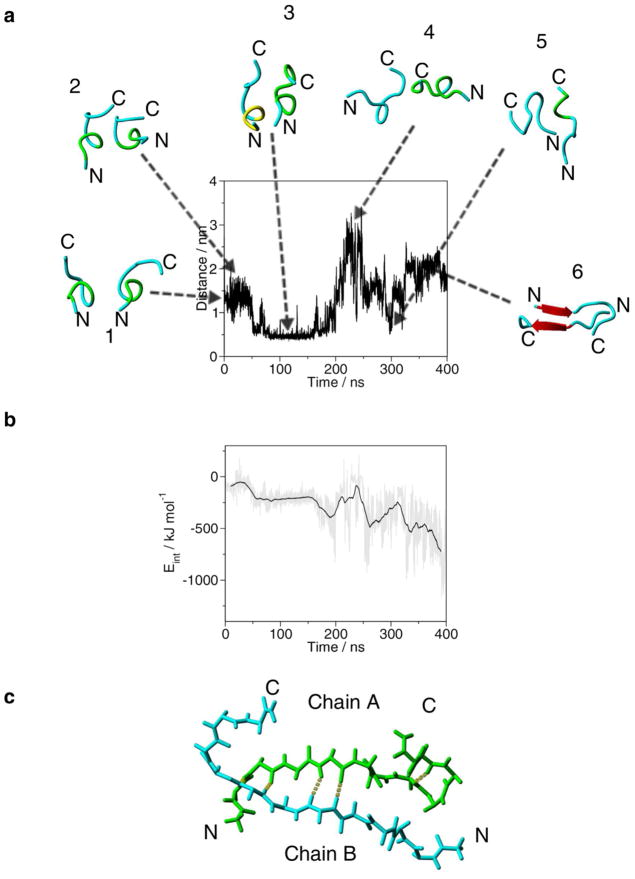
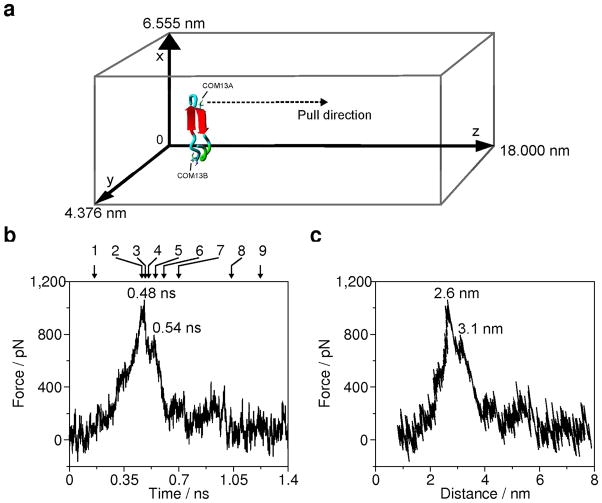
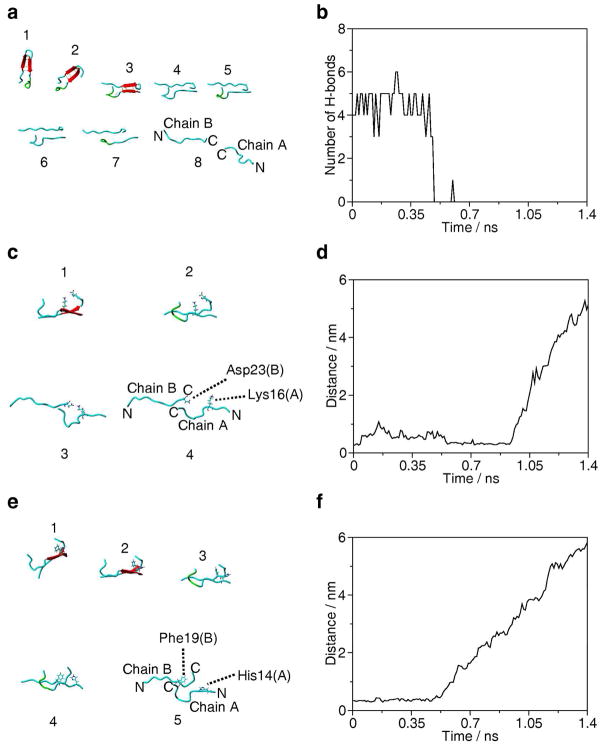
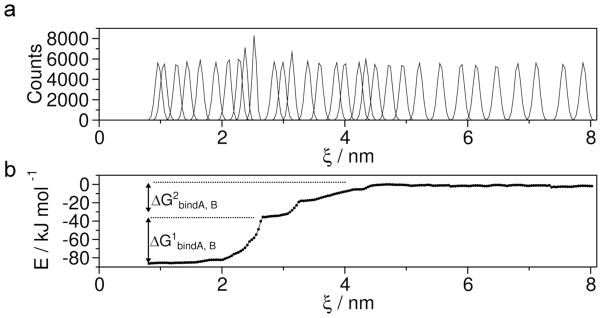
The misfolding and self-assembly of the amyloid-beta (Aβ) peptide into aggregates is a molecular signature of the development of Alzheimer's disease, but molecular mechanisms of the peptide aggregation remain unknown. Here, we combined Atomic Force Microscopy (AFM) and Molecular Dynamics (MD) simulations to characterize the misfolding process of an Aβ peptide. Dynamic force spectroscopy AFM analysis showed that the peptide forms stable dimers with a lifetime of ∼1 s. During MD simulations, isolated monomers gradually adopt essentially similar nonstructured conformations independent from the initial structure. However, when two monomers approach their structure changes dramatically, and the conformational space for the two monomers become restricted. The arrangement of monomers in antiparallel orientation leads to the cooperative formation of β-sheet conformation. Interactions, including hydrogen bonds, salt bridges, and weakly polar interactions of side chains stabilize the structure of the dimer. Under the applied force, the dimer, as during the AFM experiments, dissociates in a cooperative manner. Thus, misfolding of the Aβ peptide proceeds via the loss of conformational flexibility and formation of stable dimers suggesting their key role in the subsequent Aβ aggregation process.
Figures
Similar articles
-
The structure of misfolded amyloidogenic dimers: computational analysis of force spectroscopy data.Biophys J. 2014 Dec 16;107(12):2903-2910. doi: 10.1016/j.bpj.2014.10.053. Biophys J. 2014. PMID: 25517155 Free PMC article.
-
Aβ monomers transiently sample oligomer and fibril-like configurations: ensemble characterization using a combined MD/NMR approach.J Mol Biol. 2013 Sep 23;425(18):3338-59. doi: 10.1016/j.jmb.2013.06.021. Epub 2013 Jun 25. J Mol Biol. 2013. PMID: 23811057 Free PMC article.
-
Polymorphic structures of Alzheimer's β-amyloid globulomers.PLoS One. 2011;6(6):e20575. doi: 10.1371/journal.pone.0020575. Epub 2011 Jun 7. PLoS One. 2011. PMID: 21687730 Free PMC article.
-
Distinct role of hydration water in protein misfolding and aggregation revealed by fluctuating thermodynamics analysis.Acc Chem Res. 2015 Apr 21;48(4):956-65. doi: 10.1021/acs.accounts.5b00032. Epub 2015 Apr 6. Acc Chem Res. 2015. PMID: 25844814 Review.
-
Role of the region 23-28 in Abeta fibril formation: insights from simulations of the monomers and dimers of Alzheimer's peptides Abeta40 and Abeta42.Curr Alzheimer Res. 2008 Jun;5(3):244-50. doi: 10.2174/156720508784533330. Curr Alzheimer Res. 2008. PMID: 18537541 Review.
Cited by
-
Nano-assembly of amyloid β peptide: role of the hairpin fold.Sci Rep. 2017 May 24;7(1):2344. doi: 10.1038/s41598-017-02454-0. Sci Rep. 2017. PMID: 28539626 Free PMC article.
-
AFM Probing of Amyloid-Beta 42 Dimers and Trimers.Front Mol Biosci. 2020 Apr 24;7:69. doi: 10.3389/fmolb.2020.00069. eCollection 2020. Front Mol Biosci. 2020. PMID: 32391380 Free PMC article.
-
Mechanism of amyloid β-protein dimerization determined using single-molecule AFM force spectroscopy.Sci Rep. 2013 Oct 7;3:2880. doi: 10.1038/srep02880. Sci Rep. 2013. PMID: 24096987 Free PMC article.
-
Piecewise All-Atom SMD Simulations Reveal Key Secondary Structures in Luciferase Unfolding Pathway.Biophys J. 2020 Dec 1;119(11):2251-2261. doi: 10.1016/j.bpj.2020.10.023. Epub 2020 Oct 30. Biophys J. 2020. PMID: 33130123 Free PMC article.
-
AFM-Based Single Molecule Techniques: Unraveling the Amyloid Pathogenic Species.Curr Pharm Des. 2016;22(26):3950-70. doi: 10.2174/1381612822666160518141911. Curr Pharm Des. 2016. PMID: 27189600 Free PMC article. Review.
References
-
- Dobson CM. Principles of protein folding, misfolding and aggregation. Semin Cell Dev Biol. 2004;15:3–16. - PubMed
-
- Madine J, Jack E, Stockley PG, Radford SE, Serpell LC, Middleton DA. Structural Insights into the Polymorphism of Amyloid-Like Fibrils Formed by Region 20–29 of Amylin Revealed by Solid-State NMR and X-ray Fiber Diffraction. J Am Chem Soc. 2008;130:14990–15001. - PubMed
-
- Lynn DG, Meredith SC. Review: Model Peptides and the Physicochemical Approach to β-Amyloids. J Struct Biol. 2000;130:153–173. - PubMed
-
- Fernandez-Busquets X, de Groot NS, Fernandez D, Venture S. Recent Structural and Computational Insights Into Conformational Diseases. Curr Med Chem. 2008;15:1336–1349. - PubMed
-
- Munishkina LA, Fink AL. Fluorescence as a Method to Reveal Structures and Membrane-Interactions of Amyloidogenic Proteins. Biochim Biophys Acta. 2007;1768:1862–1885. - PubMed
Publication types
MeSH terms
Substances
Grants and funding
LinkOut - more resources
Full Text Sources
Other Literature Sources
Miscellaneous
