. 2013 Oct;49(4):525-35.
doi: 10.1165/rcmb.2013-0019OC.

Role of cyclooxygenase-2 in exacerbation of allergen-induced airway remodeling by multiwalled carbon nanotubes

Affiliations

Role of cyclooxygenase-2 in exacerbation of allergen-induced airway remodeling by multiwalled carbon nanotubes

Brian C Sayers et al. Am J Respir Cell Mol Biol. 2013 Oct.

Abstract

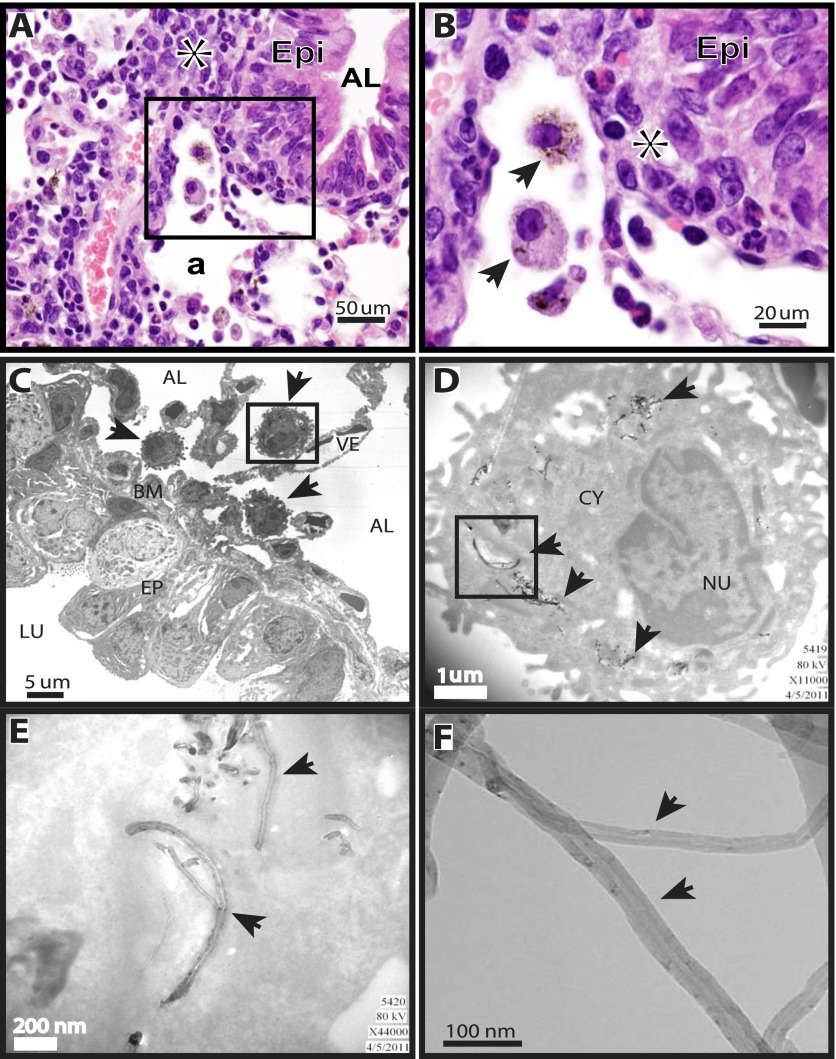
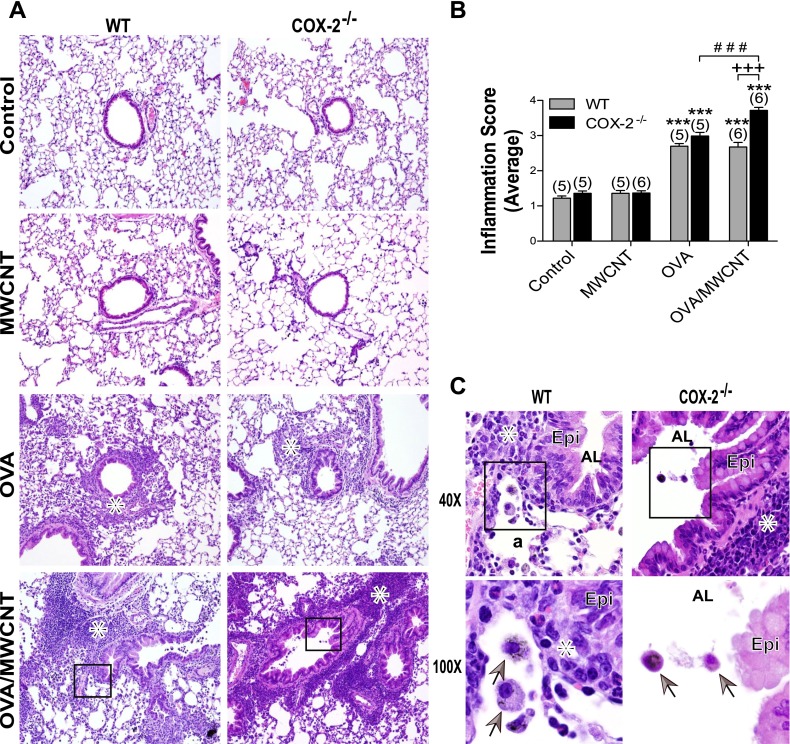
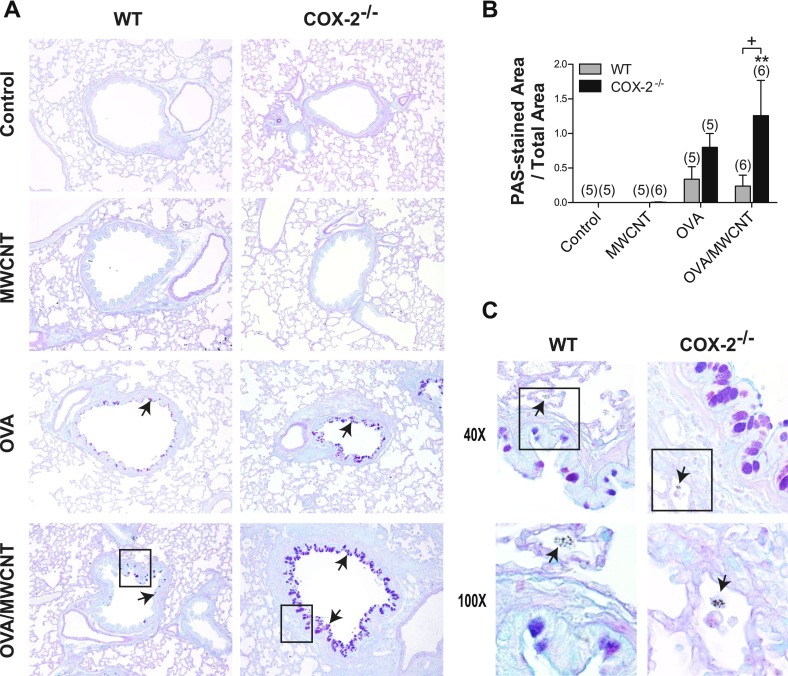
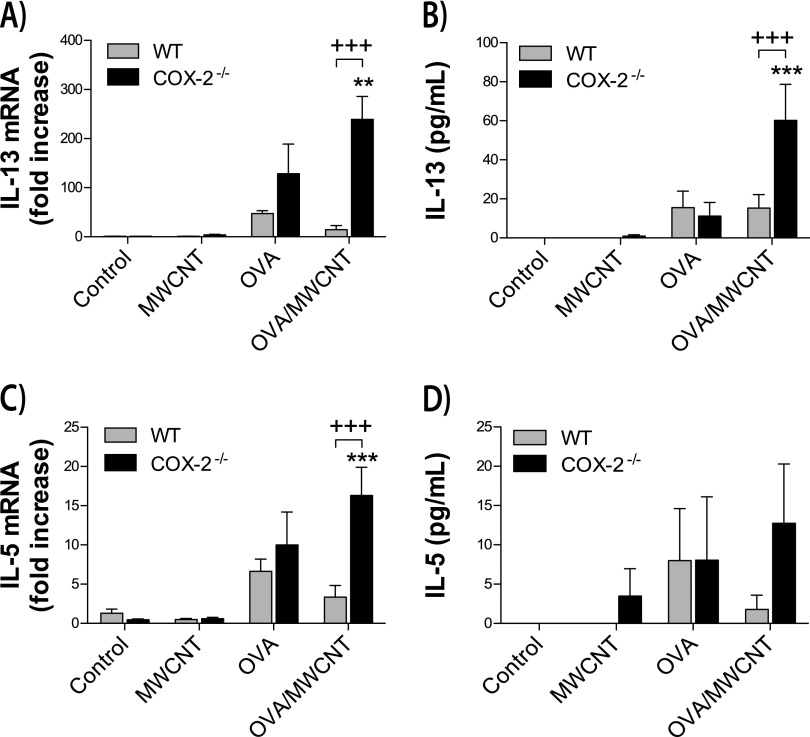
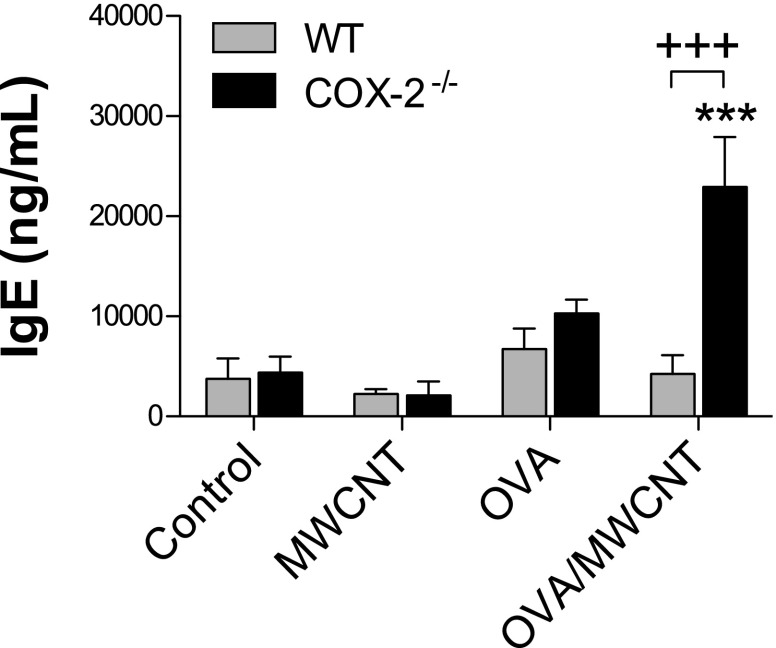
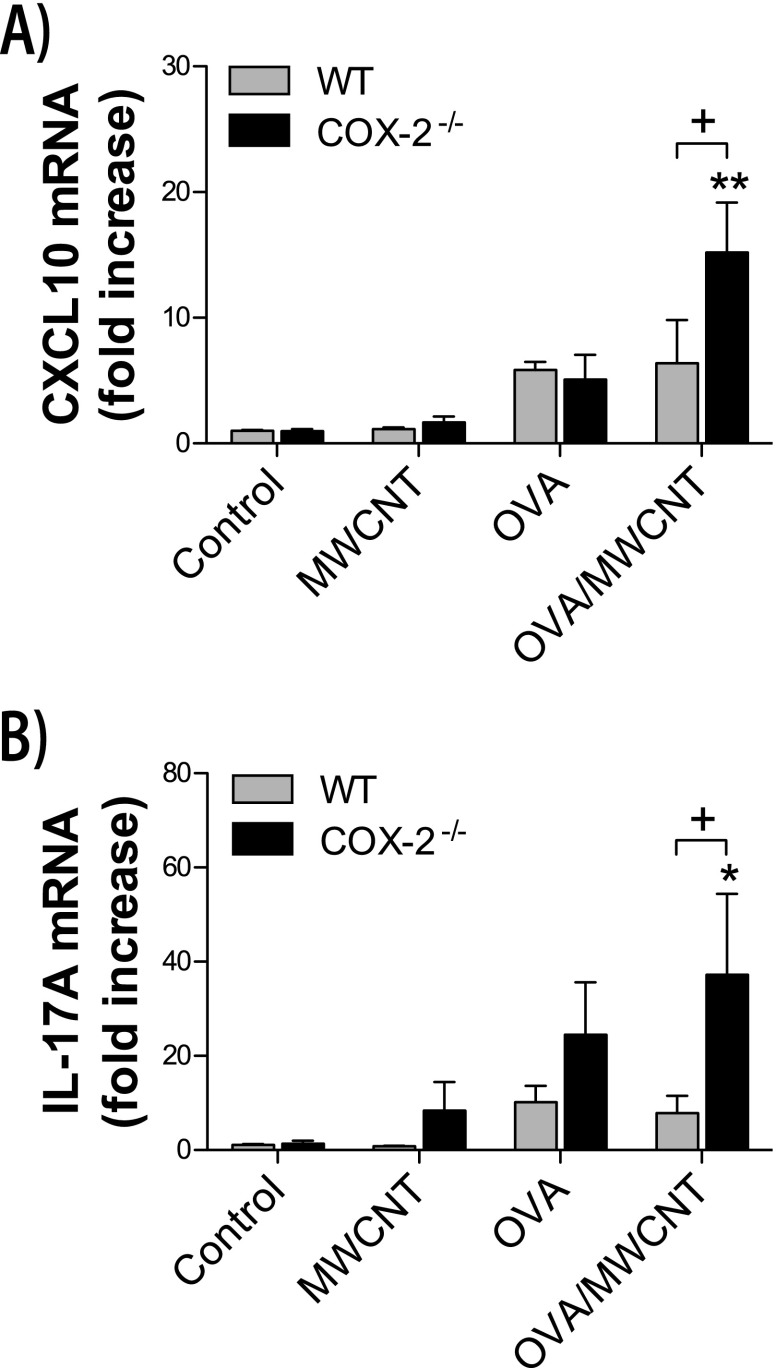
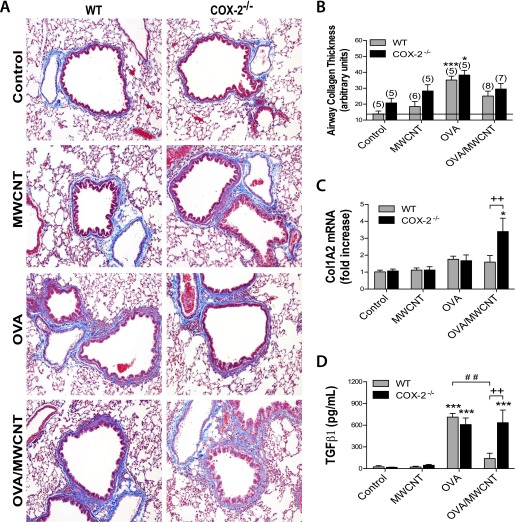
The emergence of nanotechnology has produced a multitude of engineered nanomaterials such as carbon nanotubes (CNTs), and concerns have been raised about their effects on human health, especially for susceptible populations such as individuals with asthma. Multiwalled CNTs (MWCNTs) have been shown to exacerbate ovalbumin (OVA)-induced airway remodeling in mice. Moreover, cyclooxygenase-2 (COX-2) has been described as a protective factor in asthma. We postulated that COX-2-deficient (COX-2(-/-)) mice would be susceptible to MWCNT-induced exacerbations of allergen-induced airway remodeling, including airway inflammation, fibrosis, and mucus-cell metaplasia (i.e., the formation of goblet cells). Wild-type (WT) or COX-2(-/-) mice were sensitized to OVA to induce allergic airway inflammation before a single dose of MWCNTs (4 mg/kg) delivered to the lungs by oropharyngeal aspiration. MWCNTs significantly increased OVA-induced lung inflammation and mucus-cell metaplasia in COX-2(-/-) mice compared with WT mice. However, airway fibrosis after exposure to allergen and MWCNTs was no different between WT and COX-2(-/-) mice. Concentrations of certain prostanoids (prostaglandin D2 and thromboxane B2) were enhanced by OVA or MWCNTs in COX-2(-/-) mice. No differences in COX-1 mRNA concentrations were evident between WT and COX-2(-/-) mice treated with OVA and MWCNTs. Interestingly, MWCNTs significantly enhanced allergen-induced cytokines involved in Th2 (IL-13 and IL-5), Th1 (CXCL10), and Th17 (IL-17A) inflammatory responses in COX-2(-/-) mice, but not in WT mice. We conclude that exacerbations of allergen-induced airway inflammation and mucus-cell metaplasia by MWCNTs are enhanced by deficiencies in COX-2, and are associated with the activation of a mixed Th1/Th2/Th17 immune response.


Figures

<i>Figure 1.</i>
Figure 1.
Localization of multiwalled carbon nanotubes (MWCNTs) in mouse lungs, 1 day after oropharyngeal aspiration. (A) Photomicrograph at ×40 magnification of hematoxylin and eosin–stained lung section from a wild-type (WT) mouse shows alveolar macrophages containing MWCNTs. Asterisk indicates inflammation. Epi, epithelium; AL, airway lumen; a, alveolar region. (B) Higher magnification (×100) of inset from ×40 photomicrograph in A. Asterisk indicates inflammation. Arrows in ×100 photomicrograph indicate alveolar macrophages containing MWCNTs. Epi, epithelium. (C) Transmission electron microscopy (TEM) shows localization of alveolar macrophages containing MWCNTs (arrows) adjacent to the airway basement membrane (BM). The macrophage enclosed by the inset box frame is shown at a higher magnification in D. AL, alveolus; LU, airway lumen; VE, blood vessel; EP, airway epithelium. (D) MWCNTs within a macrophage are indicated by arrows. Inset box frame is shown at a higher magnification in E. CY, cytoplasm; NU, nucleus. (E) MWCNTs within the cytoplasm of a macrophage (arrows). (F) Arrows indicate MWCNTs visualized by high-resolution TEM before delivery to mice.
<i>Figure 2.</i>
Figure 2.
Lung inflammation, 1 day after MWCNT exposure. (A) Photomicrographs of representative hematoxylin and eosin–stained sections at low magnification (×10). Inset boxes are shown in higher magnification in C. Asterisks denote areas of inflammation. COX-2, cyclooxygenase-2. (B) Lung pathology scoring in mice, 1 day after MWCNT exposure. Lungs were scored for the number of inflammatory cells (polymorphonuclear cells and alveolar macrophages) and the thickness of the alveolar walls. Data are presented as the means ± SEMs of scores determined by three independent observers. ***P < 0.001, compared with control groups of the respective genotypes. +++P < 0.001, compared with wild-type (WT) ovalbumin (OVA)/MWCNT. ###P < 0.001, compared with COX-2−/− (COX-2 null) OVA. Numbers in parentheses indicate the number of animals in each dosage group. (C) Higher magnification (×40) of inset from micrograph of OVA-sensitized, WT, and COX-2−/− mice exposed to MWCNTs, as well as higher magnification (×100) of inset from ×40 micrographs of OVA-sensitized, WT, and COX-2 null mice exposed to MWCNTs. Asterisk indicates inflammation. Arrows in ×100 photomicrographs indicate alveolar macrophages containing MWCNTs. Epi, epithelium; AL, airway lumen; a, alveolar region.
<i>Figure 3.</i>
Figure 3.
Mucus-cell hyperplasia after allergen and multiwalled carbon nanotube (MWCNT) exposure. (A) Photomicrographs of alcian blue–periodic acid–Schiff (AB-PAS)–stained sections of lung tissue taken 1 day after MWCNT exposure, low magnification (×10). Inset boxes are shown in higher magnification in C. Arrows indicate AB-PAS-positive mucus-producing cells in airways. (B) Semiquantitative scoring of AB-PAS–stained lung sections from mice, 1 day after exposure, shows that airway goblet cells (arrows) are significantly increased in the lungs of COX-2−/− mice after combined allergen challenge and MWCNT exposure, compared with WT mice. **P < 0.01, compared with COX-2−/− control mice. +P < 0.05, compared with wild-type (WT) ovalbumin (OVA)/MWCNT mice. Numbers in parentheses indicate number of animals in dosage group. (C) Higher magnification (×40) of inset from ×10 micrographs of OVA-sensitized, WT, and COX-2−/− mice exposed to MWCNTs, as well as higher magnification (×100) of inset from ×40 micrographs of OVA-sensitized, WT, and COX-2−/− mice exposed to MWCNTs. Arrows indicating alveolar macrophages containing MWCNTs are depicted in the photomicrographs at ×100.
<i>Figure 4.</i>
Figure 4.
Th2 cytokines in the lungs of mice after ovalbumin (OVA) allergen and multiwalled carbon nanotube (MWCNT) exposure. (A) IL-13 mRNA concentrations were measured in whole lung tissue by TaqMan quantitative real-time RT-PCR, 1 day after exposure to MWCNTs. **P < 0.01, compared with COX-2−/− control mice. +++P < 0.001, compared with wild-type (WT) OVA/MWCNT mice. (B) IL-13 protein concentrations were measured in bronchoalveolar lavage fluid (BALF), using ELISA. ***P < 0.001, compared with COX-2−/− control mice. +++P < 0.001 compared with WT OVA/MWCNT mice. (C) IL-5 mRNA concentrations were measured in whole lung tissue by TaqMan quantitative real-time RT-PCR. ***P < 0.001, compared with COX-2−/− control mice. +++P < 0.001, compared with WT OVA/MWCNT mice. (D) IL-5 protein concentrations were measured in BALF using ELISA.
<i>Figure 5.</i>
Figure 5.
Serum IgE protein concentrations after ovalbumin (OVA) allergen and multiwalled carbon nanotube (MWCNT) exposure. IgE concentrations were measured in serum, using ELISA. ***P < 0.001, compared with COX-2−/− control mice. +++P < 0.001, compared with wild-type (WT) OVA/MWCNT mice. One-way ANOVA with a post hoc Bonferroni test was used to identify significant differences among treatment groups. Two-way ANOVA with the Bonferroni post hoc test was used to identify significant differences between genotypes.
<i>Figure 6.</i>
Figure 6.
Lung Th1 and Th17 cytokines after allergen and MWCNT exposure. (A) Interferon-inducible chemokine (CXCL10) mRNA concentrations were measured in whole lung tissue by TaqMan quantitative real-time RT-PCR, 1 day after exposure to MWCNTs. **P < 0.01, compared with COX-2−/− control mice. +P < 0.05, compared with wild-type (WT) OVA/MWCNT mice. (B) IL-17A mRNA concentrations were measured in whole lung tissue by TaqMan quantitative real-time RT-PCR, 1 day after exposure to MWCNTs. *P < 0.05, compared with COX-2−/− control mice. +P < 0.05, compared with WT OVA/MWCNT mice.
<i>Figure 7.</i>
Figure 7.
Airway fibrogenic response after allergen and MWCNT exposure. (A) Photomicrographs of trichrome-stained sections depict representative airways (with collagen staining in blue) at low magnification (×10). (B) Quantitative morphometry was used to measure collagen deposition around the airways between 100 and 200 μm at 14 days (see the online supplement for details). *P < 0.05, compared with COX-2−/− control mice. ***P < 0.001, compared with wild-type (WT) control mice. Numbers in parentheses indicate the number of animals in dosage groups. (C) Collagen 1A2 (Col1A2) mRNA concentrations, 1 day after MWCNT exposure. Concentrations of mRNA were measured in whole lung tissue, using Taqman quantitative real-time RT-PCR. *P < 0.05, compared with COX-2−/− control mice. ++P < 0.01 compared to WT. (D) Transforming growth factor–β1 (TGF-β1) protein concentrations were measured in BALF, using ELISA, 1 day after MWCNT exposure. ***P < 0.001, compared with control mice of the respective genotype. ++P < 0.01, compared with WT OVA/MWCNT mice. ##P < 0.01, compared with WT OVA/MWCNT mice.

References

    1. National Asthma Education and Prevention Program. Expert Panel Report 3 (EPR-3): guidelines for the diagnosis and management of asthma—summary report. J Allergy Clin Immunol. 2007;120:S94–S138. - PubMed
    1. Davies DE, Wicks J, Powell RM, Puddicombe SM, Holgate ST. Airway remodeling in asthma: new insights. J Allergy Clin Immunol. 2003;111:215–225. - PubMed
    1. Al-Muhsen S, Johnson JR, Hamid Q. Remodeling in asthma. J Allergy Clin Immunol. 2011;128:451–462. - PubMed
    1. Lemanske RF, Jr, Busse WW. Asthma: clinical expression and molecular mechanisms. J Allergy Clin Immunol. 2010;125:S95–S102. - PMC - PubMed
    1. Gavett SH, Koren HS. The role of particulate matter in exacerbation of atopic asthma. Int Arch Allergy Immunol. 2001;124:109–112. - PubMed

Publication types

MeSH terms