

Atlas-based neuroinformatics via MRI: harnessing information from past clinical cases and quantitative image analysis for patient care
- PMID: 23642246
- PMCID: PMC3719383
- DOI: 10.1146/annurev-bioeng-071812-152335
Atlas-based neuroinformatics via MRI: harnessing information from past clinical cases and quantitative image analysis for patient care
Abstract
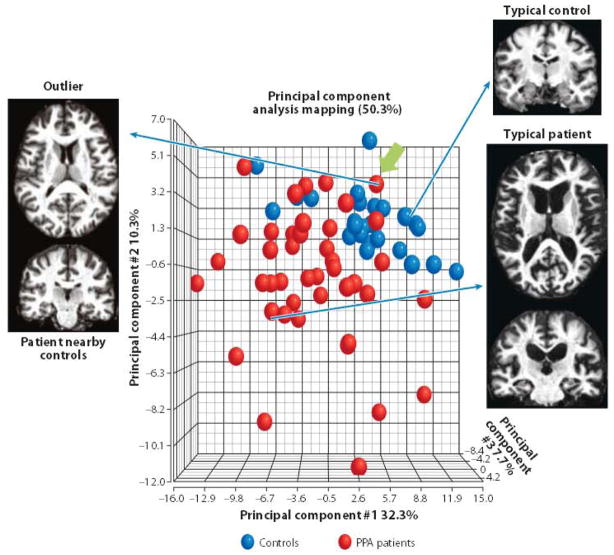
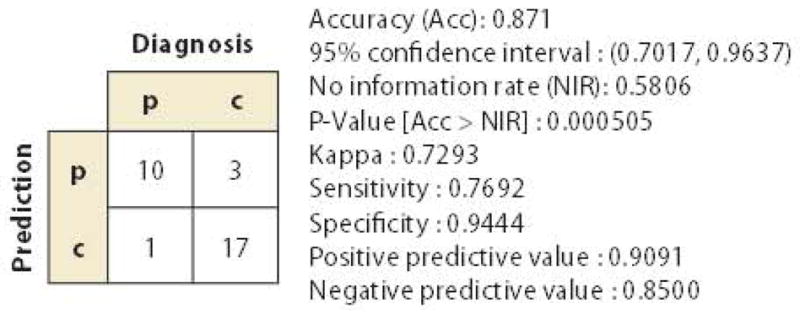
With the ever-increasing amount of anatomical information radiologists have to evaluate for routine diagnoses, computational support that facilitates more efficient education and clinical decision making is highly desired. Despite the rapid progress of image analysis technologies for magnetic resonance imaging of the human brain, these methods have not been widely adopted for clinical diagnoses. To bring computational support into the clinical arena, we need to understand the decision-making process employed by well-trained clinicians and develop tools to simulate that process. In this review, we discuss the potential of atlas-based clinical neuroinformatics, which consists of annotated databases of anatomical measurements grouped according to their morphometric phenotypes and coupled with the clinical informatics upon which their diagnostic groupings are based. As these are indexed via parametric representations, we can use image retrieval tools to search for phenotypes along with their clinical metadata. The review covers the current technology, preliminary data, and future directions of this field.
Conflict of interest statement
S.M. and M.M. own AnatomyWorks, with S.M. serving as its CEO. This arrangement is being managed by Johns Hopkins University in accordance with its conflict of interest policies.
Figures
Similar articles
-
Biomedical informatics for computer-aided decision support systems: a survey.ScientificWorldJournal. 2013;2013:769639. doi: 10.1155/2013/769639. Epub 2013 Feb 4. ScientificWorldJournal. 2013. PMID: 23431259 Free PMC article. Review.
-
Content-based image retrieval for brain MRI: an image-searching engine and population-based analysis to utilize past clinical data for future diagnosis.Neuroimage Clin. 2015 Jan 15;7:367-76. doi: 10.1016/j.nicl.2015.01.008. eCollection 2015. Neuroimage Clin. 2015. PMID: 25685706 Free PMC article.
-
Artificial intelligence model for tumoral clinical decision support systems.Comput Methods Programs Biomed. 2024 Aug;253:108228. doi: 10.1016/j.cmpb.2024.108228. Epub 2024 May 23. Comput Methods Programs Biomed. 2024. PMID: 38810378
-
Multiscale integration of -omic, imaging, and clinical data in biomedical informatics.IEEE Rev Biomed Eng. 2012;5:74-87. doi: 10.1109/RBME.2012.2212427. IEEE Rev Biomed Eng. 2012. PMID: 23231990 Free PMC article. Review.
-
A boosting framework for visuality-preserving distance metric learning and its application to medical image retrieval.IEEE Trans Pattern Anal Mach Intell. 2010 Jan;32(1):30-44. doi: 10.1109/TPAMI.2008.273. IEEE Trans Pattern Anal Mach Intell. 2010. PMID: 19926897
Cited by
-
Reprint of "Quantitative evaluation of brain development using anatomical MRI and diffusion tensor imaging".Int J Dev Neurosci. 2014 Feb;32:28-40. doi: 10.1016/j.ijdevneu.2013.11.006. Epub 2013 Dec 2. Int J Dev Neurosci. 2014. PMID: 24295553 Free PMC article.
-
Direct estimation of patient attributes from anatomical MRI based on multi-atlas voting.Neuroimage Clin. 2016 Sep 14;12:570-581. doi: 10.1016/j.nicl.2016.09.008. eCollection 2016. Neuroimage Clin. 2016. PMID: 27689021 Free PMC article.
-
Big heart data: advancing health informatics through data sharing in cardiovascular imaging.IEEE J Biomed Health Inform. 2015 Jul;19(4):1283-90. doi: 10.1109/JBHI.2014.2370952. Epub 2014 Nov 14. IEEE J Biomed Health Inform. 2015. PMID: 25415993 Free PMC article.
-
Test-retest reproducibility of a multi-atlas automated segmentation tool on multimodality brain MRI.Brain Behav. 2019 Oct;9(10):e01363. doi: 10.1002/brb3.1363. Epub 2019 Sep 4. Brain Behav. 2019. PMID: 31483562 Free PMC article.
-
Analyses of regional radiosensitivity of white matter structures along tract axes using novel white matter segmentation and diffusion imaging biomarkers.Phys Imaging Radiat Oncol. 2018 May 1;6:39-46. doi: 10.1016/j.phro.2018.04.003. eCollection 2018 Apr. Phys Imaging Radiat Oncol. 2018. PMID: 33458387 Free PMC article.
References
-
- Good CD, Johnsrude IS, Ashburner J, Henson RN, Friston KJ, Frackowiak RS. A voxel-based morphometric study of ageing in 465 normal adult human brains. NeuroImage. 2001;14:21–36. - PubMed
-
- Smith SM, Jenkinson M, Johansen-Berg H, Rueckert D, Nichols TE, et al. Tract-based spatial statistics: voxelwise analysis of multi-subject diffusion data. NeuroImage. 2006;31:1487–505. - PubMed
-
- Zhang H, Yushkevich PA, Alexander DC, Gee JC. Deformable registration of diffusion tensor MR images with explicit orientation optimization. Med Image Anal. 2006;10:764–85. - PubMed
Publication types
MeSH terms
Grants and funding
- R01HD065955/HD/NICHD NIH HHS/United States
- R01 AG020012/AG/NIA NIH HHS/United States
- R01NS058299/NS/NINDS NIH HHS/United States
- R01 EB000975/EB/NIBIB NIH HHS/United States
- R03 EB014357/EB/NIBIB NIH HHS/United States
- R03EB014357/EB/NIBIB NIH HHS/United States
- R01 NS084957/NS/NINDS NIH HHS/United States
- R01 NS058299/NS/NINDS NIH HHS/United States
- R01AG20012/AG/NIA NIH HHS/United States
- P41 RR015241/RR/NCRR NIH HHS/United States
- P41EB015909/EB/NIBIB NIH HHS/United States
- R01 HD065955/HD/NICHD NIH HHS/United States
- P41 EB015909/EB/NIBIB NIH HHS/United States
LinkOut - more resources
Full Text Sources
Other Literature Sources
Medical
Research Materials
Miscellaneous
