

Evaluation and optimization of mass spectrometric settings during data-dependent acquisition mode: focus on LTQ-Orbitrap mass analyzers
- PMID: 23642296
- PMCID: PMC3748959
- DOI: 10.1021/pr3011588
Evaluation and optimization of mass spectrometric settings during data-dependent acquisition mode: focus on LTQ-Orbitrap mass analyzers
Abstract
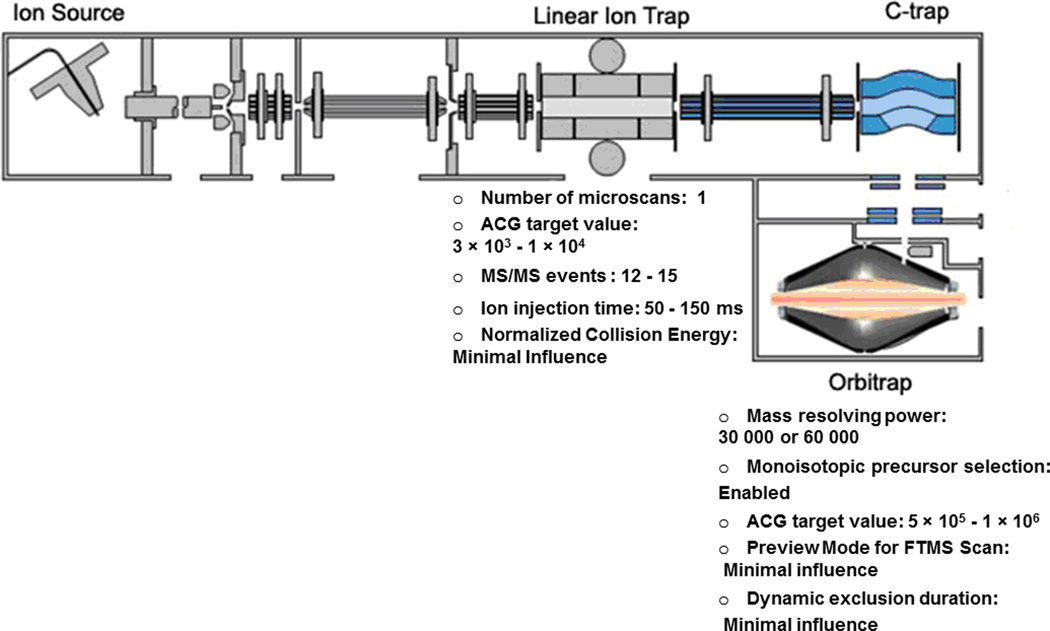
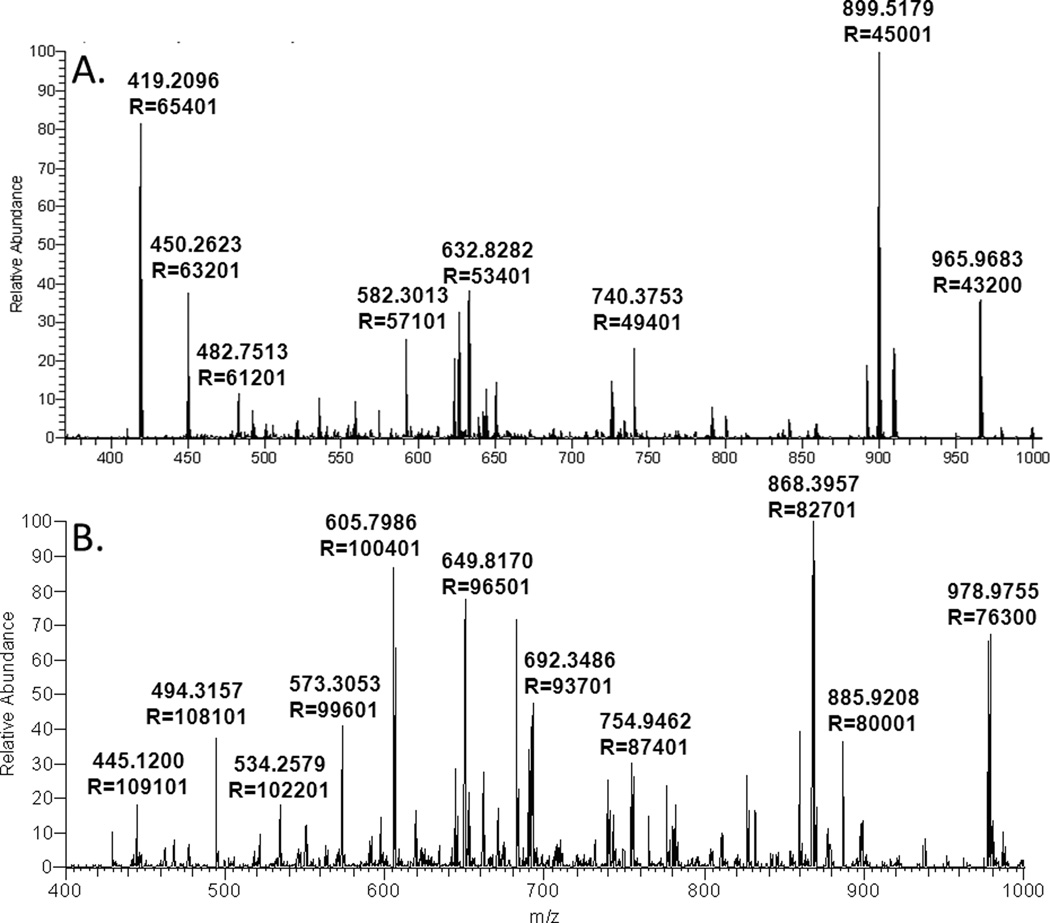
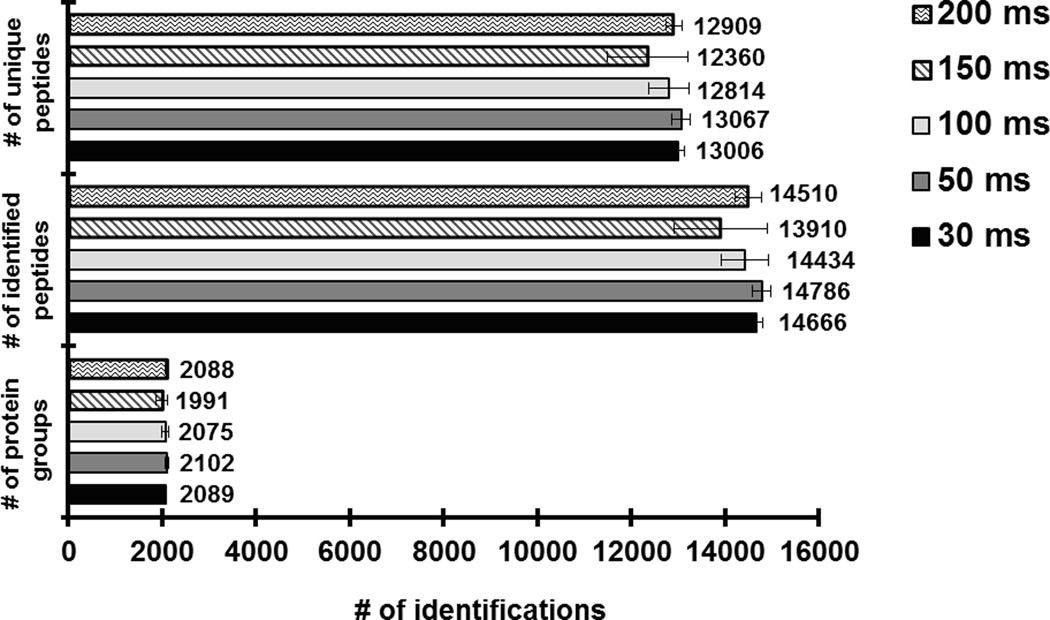
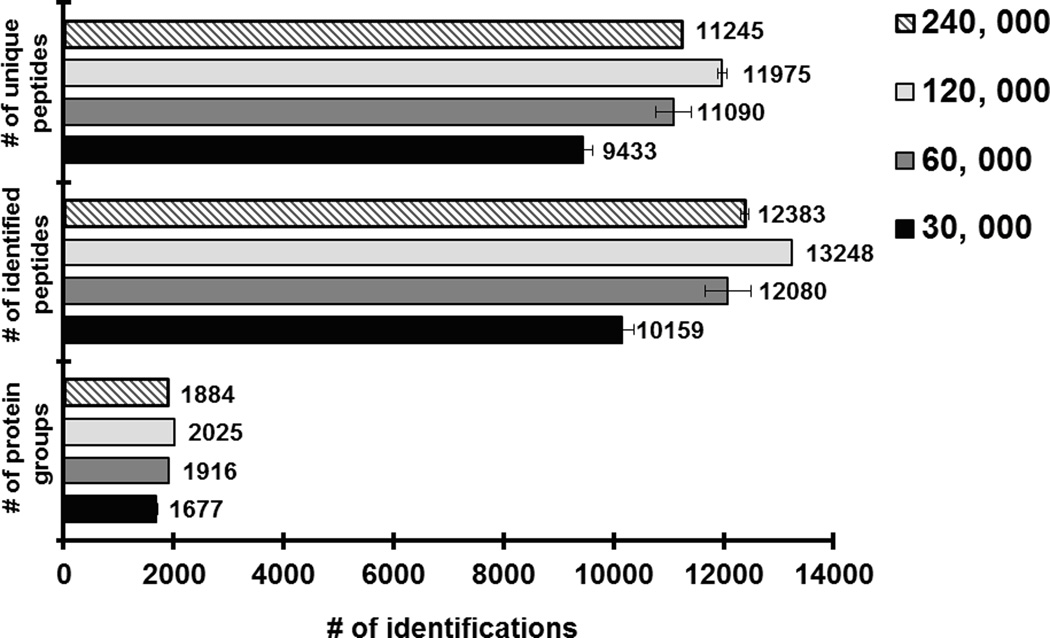
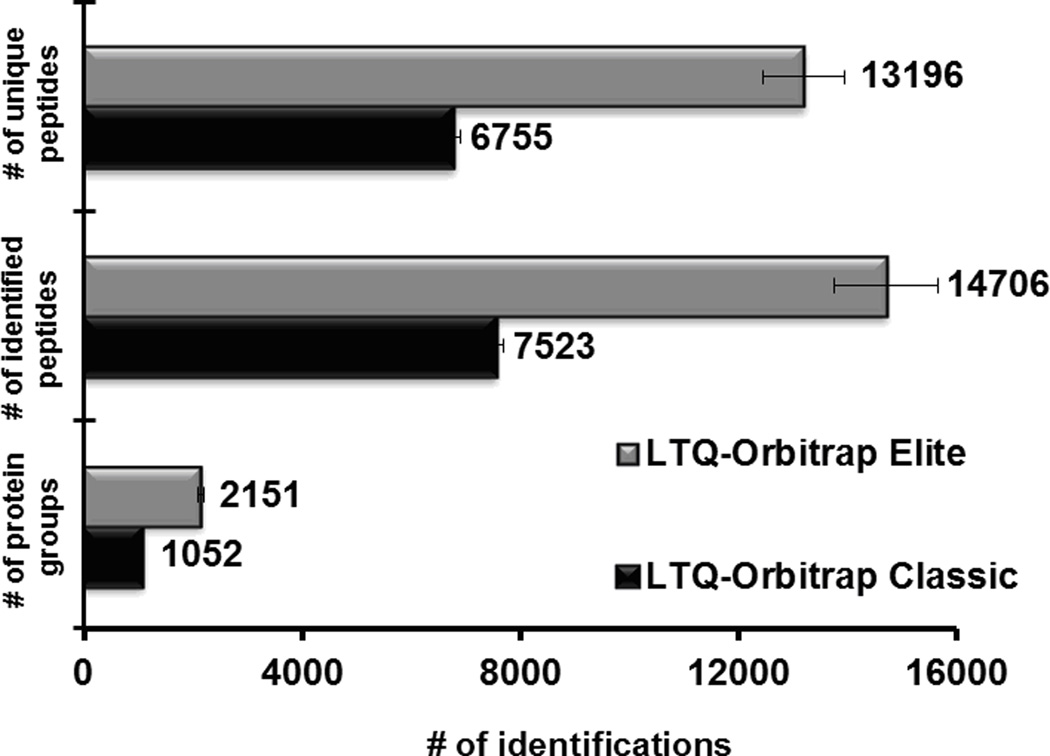
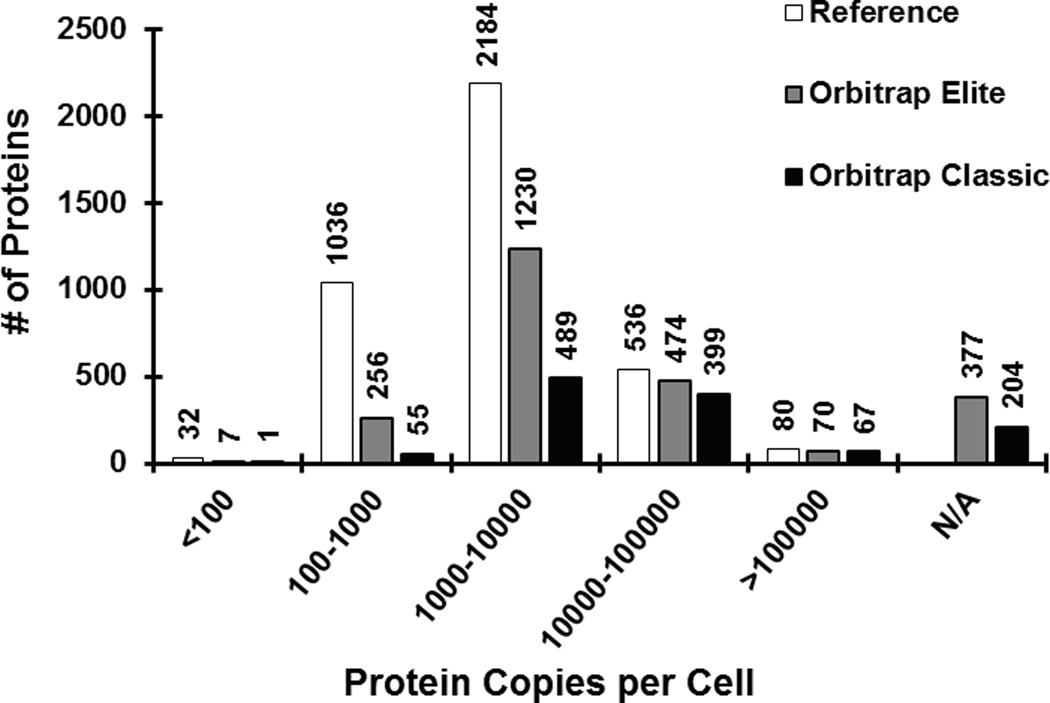
Mass-spectrometry-based proteomics has evolved as the preferred method for the analysis of complex proteomes. Undoubtedly, recent advances in mass spectrometry instrumentation have greatly enhanced proteomic analysis. A popular instrument platform in proteomics research is the LTQ-Orbitrap mass analyzer. In this tutorial, we discuss the significance of evaluating and optimizing mass spectrometric settings on the LTQ-Orbitrap during CID data-dependent acquisition (DDA) mode to improve protein and peptide identification rates. We focus on those MS and MS/MS parameters that have been systematically examined and evaluated by several researchers and are commonly used during DDA. More specifically, we discuss the effect of mass resolving power, preview mode for FTMS scan, monoisotopic precursor selection, signal threshold for triggering MS/MS events, number of microscans per MS/MS scan, number of MS/MS events, automatic gain control target value (ion population) for MS and MS/MS, maximum ion injection time for MS/MS, rapid and normal scan rate, and prediction of ion injection time. We furthermore present data from the latest generation LTQ-Orbitrap system, the Orbitrap Elite, along with recommended MS and MS/MS parameters. The Orbitrap Elite outperforms the Orbitrap Classic in terms of scan speed, sensitivity, dynamic range, and resolving power and results in higher identification rates. Several of the optimized MS parameters determined on the LTQ-Orbitrap Classic and XL were easily transferable to the Orbitrap Elite, whereas others needed to be reevaluated. Finally, the Q Exactive and HCD are briefly discussed, as well as sample preparation, LC-optimization, and bioinformatics analysis. We hope this tutorial will serve as guidance for researchers new to the field of proteomics and assist in achieving optimal results.
Figures
Similar articles
-
Effect of mass spectrometric parameters on peptide and protein identification rates for shotgun proteomic experiments on an LTQ-orbitrap mass analyzer.Proteomics. 2012 Jan;12(1):21-31. doi: 10.1002/pmic.201100464. Epub 2011 Nov 29. Proteomics. 2012. PMID: 22065615
-
Ultra high resolution linear ion trap Orbitrap mass spectrometer (Orbitrap Elite) facilitates top down LC MS/MS and versatile peptide fragmentation modes.Mol Cell Proteomics. 2012 Mar;11(3):O111.013698. doi: 10.1074/mcp.O111.013698. Epub 2011 Dec 9. Mol Cell Proteomics. 2012. PMID: 22159718 Free PMC article.
-
Synergistic optimization of Liquid Chromatography and Mass Spectrometry parameters on Orbitrap Tribrid mass spectrometer for high efficient data-dependent proteomics.J Mass Spectrom. 2021 Apr;56(4):e4653. doi: 10.1002/jms.4653. Epub 2020 Sep 13. J Mass Spectrom. 2021. PMID: 32924238
-
Evolution of Orbitrap Mass Spectrometry Instrumentation.Annu Rev Anal Chem (Palo Alto Calif). 2015;8:61-80. doi: 10.1146/annurev-anchem-071114-040325. Annu Rev Anal Chem (Palo Alto Calif). 2015. PMID: 26161972 Review.
-
Screening of synthetic PDE-5 inhibitors and their analogues as adulterants: analytical techniques and challenges.J Pharm Biomed Anal. 2014 Jan;87:176-90. doi: 10.1016/j.jpba.2013.04.037. Epub 2013 May 6. J Pharm Biomed Anal. 2014. PMID: 23721687 Review.
Cited by
-
Biological Applications for LC-MS-Based Proteomics.Adv Exp Med Biol. 2021;1336:17-29. doi: 10.1007/978-3-030-77252-9_2. Adv Exp Med Biol. 2021. PMID: 34628625
-
Identification of alkaloids and related intermediates of Dendrobium officinale by solid-phase extraction coupled with high-performance liquid chromatography tandem mass spectrometry.Front Plant Sci. 2022 Aug 4;13:952051. doi: 10.3389/fpls.2022.952051. eCollection 2022. Front Plant Sci. 2022. PMID: 35991437 Free PMC article.
-
O-GlcNAcylation Signal Mediates Proteasome Inhibitor Resistance in Cancer Cells by Stabilizing NRF1.Mol Cell Biol. 2018 Aug 15;38(17):e00252-18. doi: 10.1128/MCB.00252-18. Print 2018 Sep 1. Mol Cell Biol. 2018. PMID: 29941490 Free PMC article.
-
Comprehensive structural glycomic characterization of the glycocalyxes of cells and tissues.Nat Protoc. 2020 Aug;15(8):2668-2704. doi: 10.1038/s41596-020-0350-4. Epub 2020 Jul 17. Nat Protoc. 2020. PMID: 32681150 Free PMC article.
-
Proteomic Analysis of Caspofungin-Induced Responses in Planktonic Cells and Biofilms of Candida albicans.Front Microbiol. 2021 Feb 18;12:639123. doi: 10.3389/fmicb.2021.639123. eCollection 2021. Front Microbiol. 2021. PMID: 33679674 Free PMC article.
References
-
- Stahl DC, Swiderek KM, Davis MT, Lee TD. Data-controlled automation of liquid chromatography tandem mass spectrometry analysis of peptide mixtures. J. Am. Soc. Mass Spectrom. 1996;7(6):532–540. - PubMed
-
- Makarov A, Denisov E, Kholomeev A, Baischun W, Lange O, Strupat K, Horning S. Performance evaluation of a hybrid linear ion trap/orbitrap mass spectrometer. Anal. Chem. 2006;78(7):2113–2120. - PubMed
-
- Yates JR, Cociorva D, Liao LJ, Zabrouskov V. Performance of a linear ion trap-orbitrap hybrid for peptide analysis. Anal. Chem. 2006;78(2):493–500. - PubMed
-
- Perry RH, Cooks RG, Noll RJ. Orbitrap mass spectrometry: instrumentation, ion motion and applications. Mass Spectrom. Rev. 2008;27(6):661–699. - PubMed
Publication types
MeSH terms
Substances
Grants and funding
LinkOut - more resources
Full Text Sources
Other Literature Sources
