. 2013 May 2;12(5):602-15.
doi: 10.1016/j.stem.2013.03.002.

A microRNA miR-34a-regulated bimodal switch targets Notch in colon cancer stem cells

Affiliations

A microRNA miR-34a-regulated bimodal switch targets Notch in colon cancer stem cells

Pengcheng Bu et al. Cell Stem Cell. .

Abstract

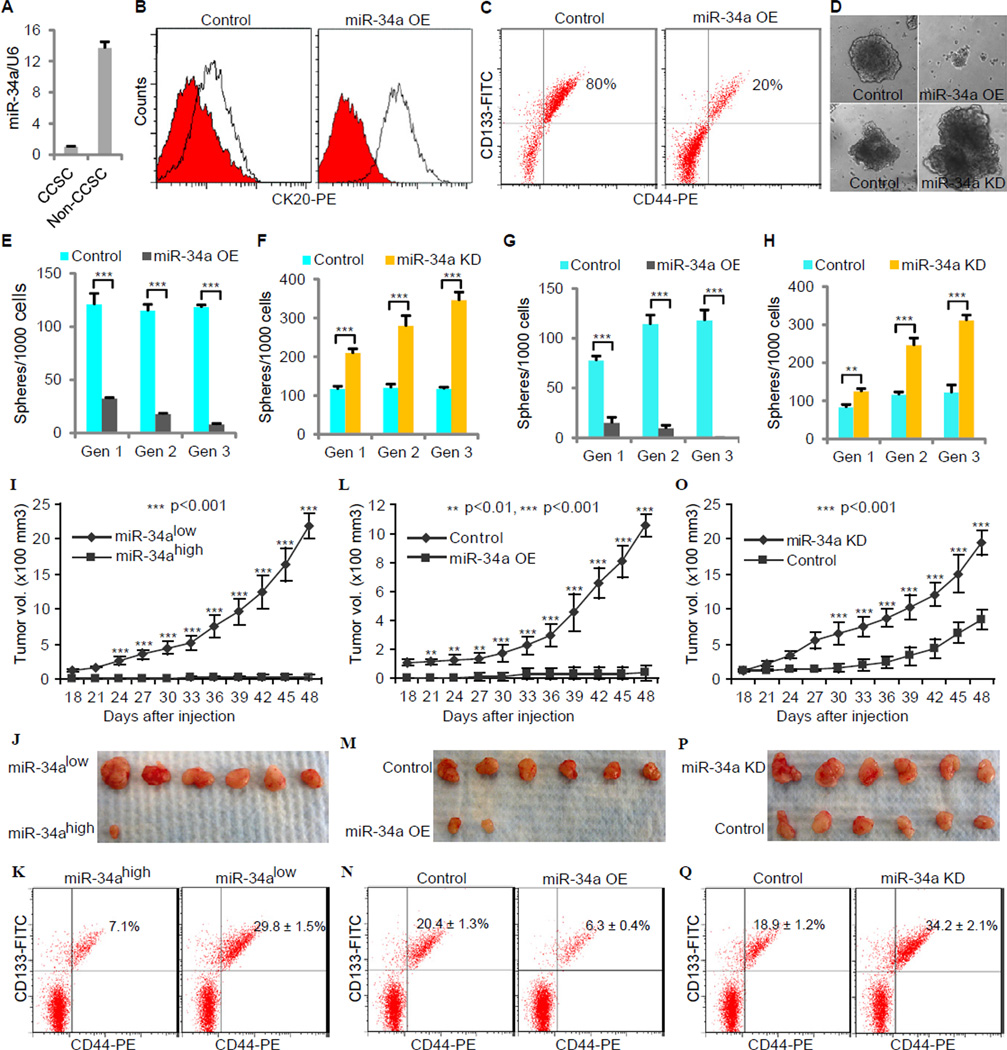
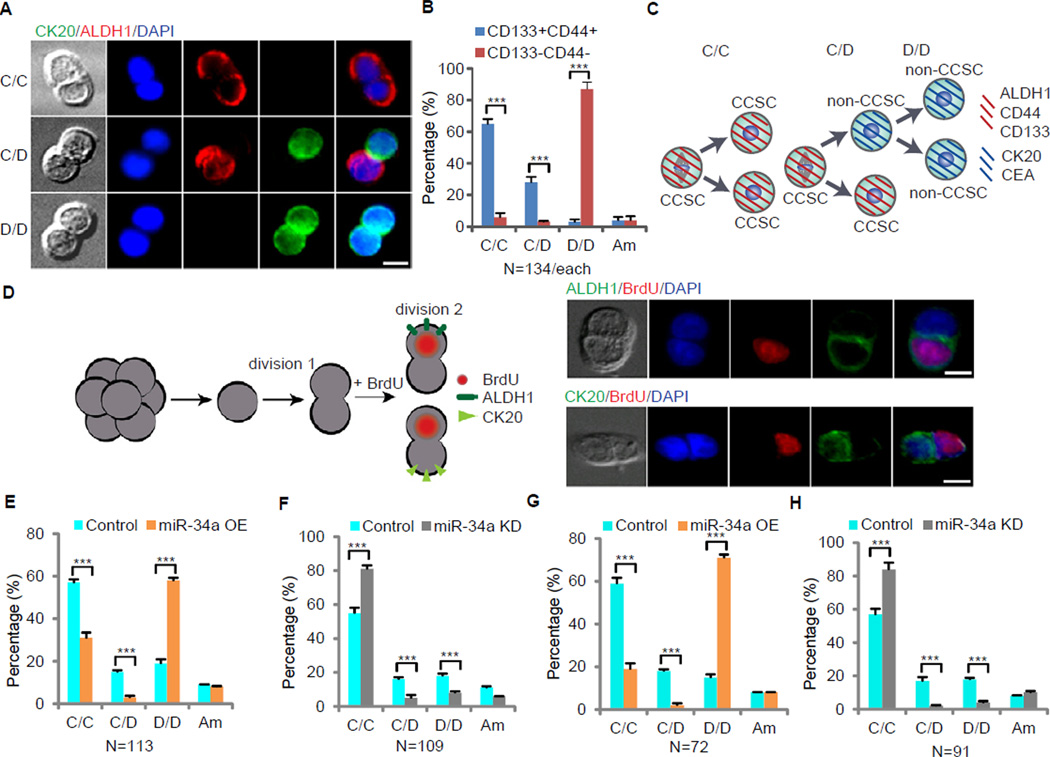
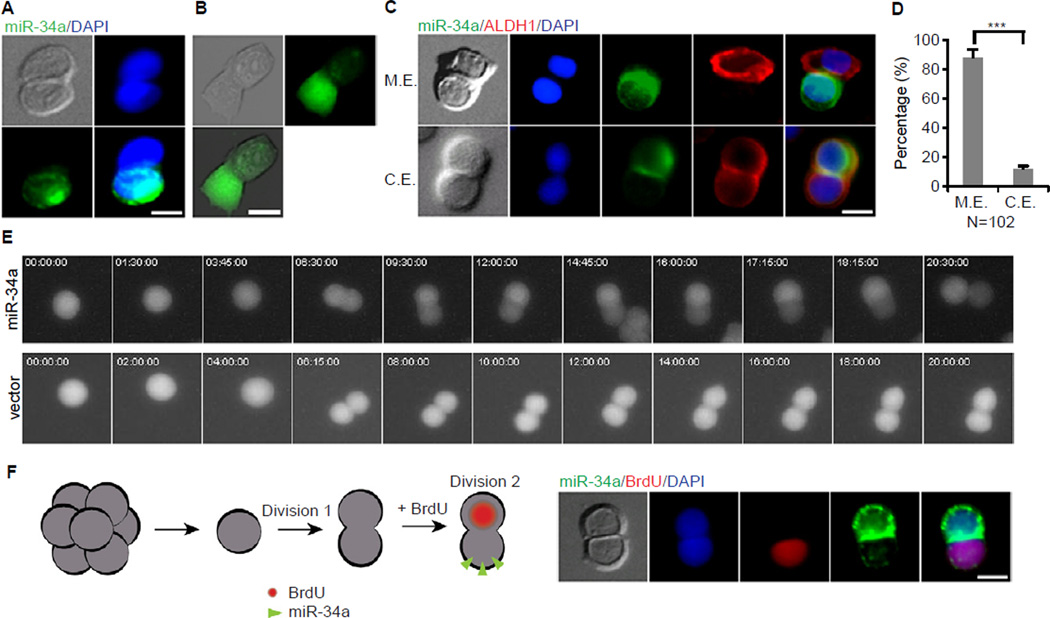
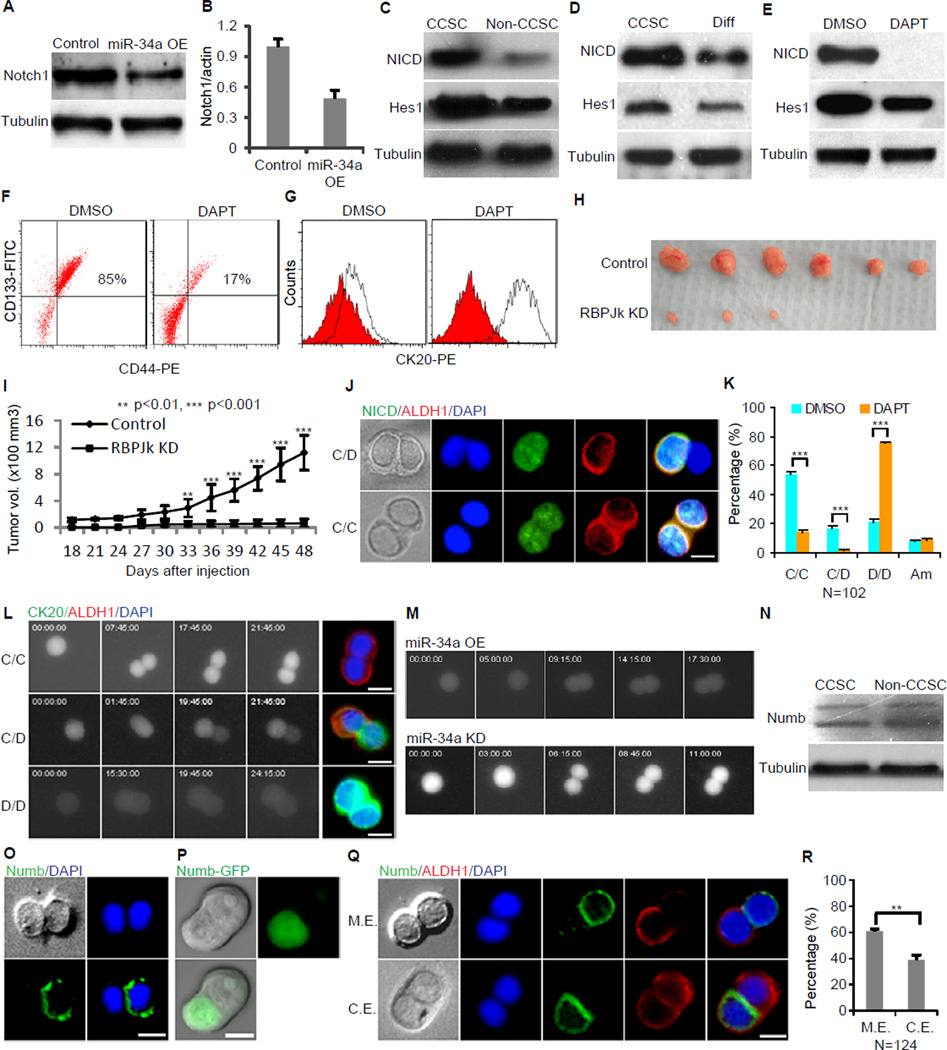
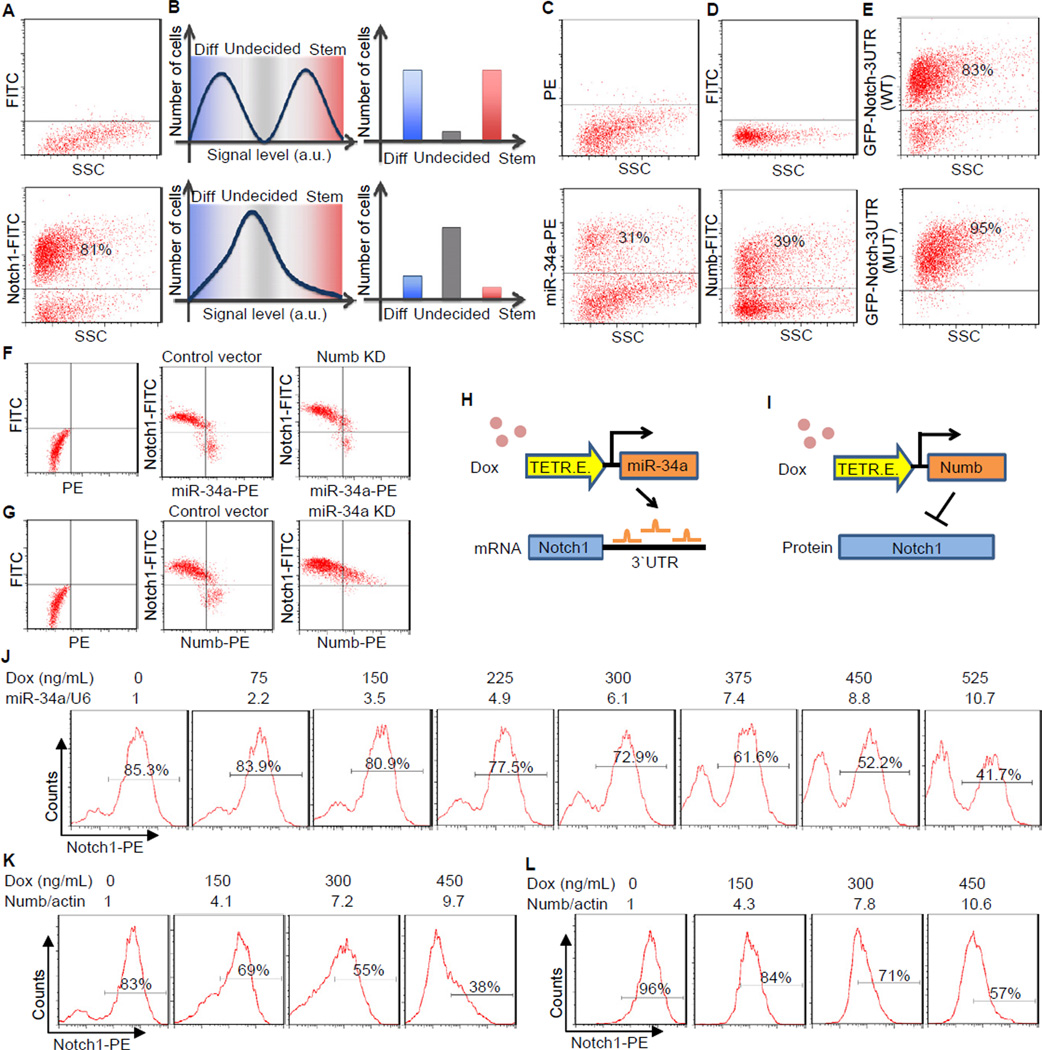
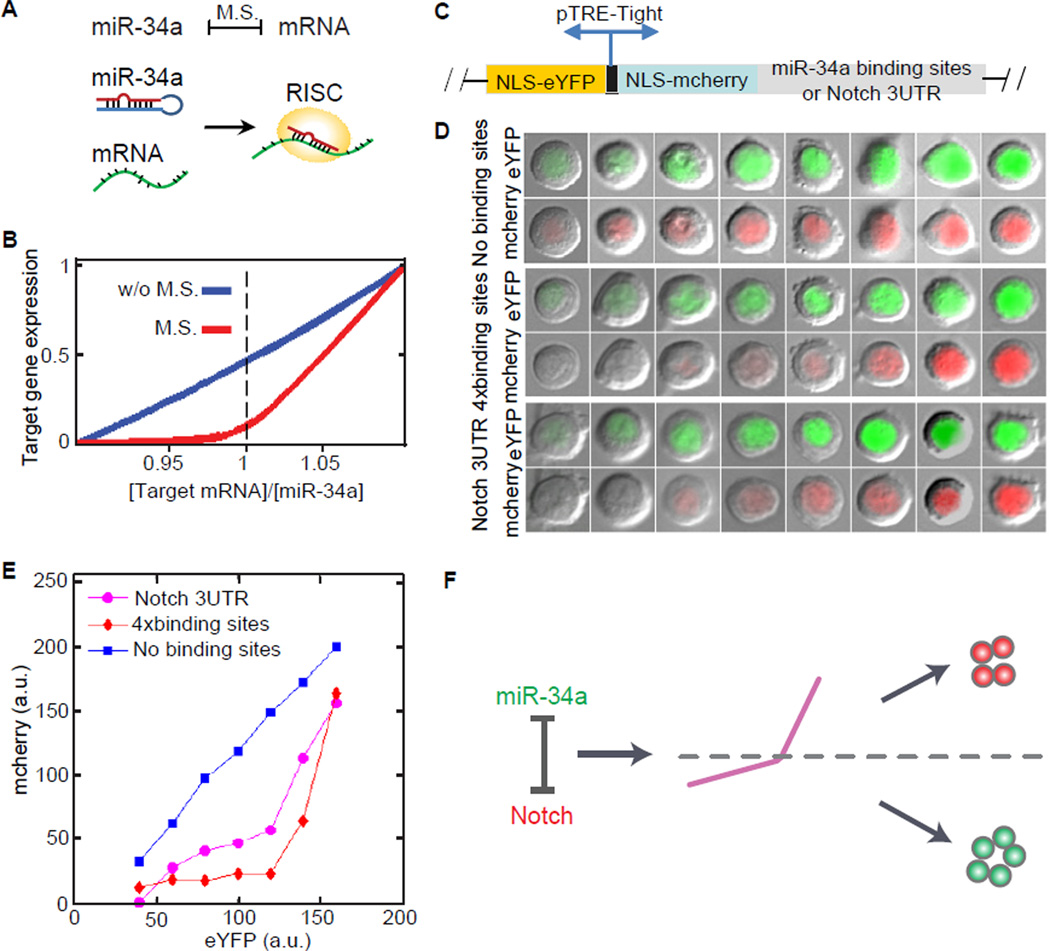
microRNAs regulate developmental cell-fate decisions, tissue homeostasis, and oncogenesis in distinct ways relative to proteins. Here, we show that the tumor suppressor microRNA miR-34a is a cell-fate determinant in early-stage dividing colon cancer stem cells (CCSCs). In pair-cell assays, miR-34a distributes at high levels in differentiating progeny, whereas low levels of miR-34a demarcate self-renewing CCSCs. Moreover, miR-34a loss of function and gain of function alter the balance between self-renewal versus differentiation both in vitro and in vivo. Mechanistically, miR-34a sequesters Notch1 mRNA to generate a sharp threshold response where a bimodal Notch signal specifies the choice between self-renewal and differentiation. In contrast, the canonical cell-fate determinant Numb regulates Notch levels in a continuously graded manner. Altogether, our findings highlight a unique microRNA-regulated mechanism that converts noisy input into a toggle switch for robust cell-fate decisions in CCSCs.


Figures

Figure 1
Figure 1. miR-34a Regulates CCSC self-renewal and Tumor Formation. Also see Figure S1 and Figure S2
(A) RT-qPCR showing miR-34a expression in CCSCs and non-CCSCs. Error bars denote the s.d. between triplicates. (B and C) FACS plots showing CK20, CD44 and CD133 levels in spheres after ectopic miR-34a expression (miR-34a OE). In (B), the red histograms represent isotype controls, and the blank histograms represent CK20+ cells. (D) Representative images of CCSC spheres after ectopic miR-34a expression (miR-34a OE, top) and miR-34a knockdown (miR-34a KD, bottom). (E and F) Sphere formation during serial passages after ectopic miR-34a expression (E) and miR-34a knockdown (F). Error bars denote the s.d. between triplicates. (G and H) Serial sphere formation of CCSCs from xenografts of miR-34a OE (G) and miR-34a KD (H) cells. Equal number of cells was passaged for 3 generation to form spheres. Error bars denote the s.d. between triplicates. (I and J) miR-34alow sphere cells were more tumorigenic than miR-34ahigh sphere cells in vivo, shown by tumor growth curves (I) and images of xenograft tumors (J). Error bars denote the s.d. derived from 6 mice per group. (K) FACS showing the percentages of tumor cells that are CCSCs. (L and M) Ectopic expression of miR-34a (miR-34a OE) reduces tumorigenicity, shown by tumor growth curves (L) and images of xenograft tumors (M). (N) FACS showing the percentages of tumor cells that are CCSCs. Error bars denote the s.d. derived from 6 mice per group. (O and P) Knockdown of miR-34a (miR-34a KD) enhances tumorigenicity, shown by tumor growth curves (O) and images of xenograft tumors (P). Error bars denote the s.d. derived from 6 mice per group. (Q) FACS showing the percentages of tumor cells that are CCSCs. Gen, generation. **, p<0.01; ***, p<0.001.
Figure 2
Figure 2. miR-34a Regulates CCSC Division. Also see Figure S3
(A) Representative images of sphere cell division. Immunofluorescence for ALDH1 (red) and CK20 (green) illustrates three types of division: CCSC/CCSC (C/C), CCSC/non-CCSC (C/D) and non-CCSC/non-CCSC (D/D). (B) Percentages of division types between the CCSC (CD133+CD44+) and non-CCSCs (CD133−CD44−) subpopulations. (C) Schematic illustration of CCSC divisions. (D) A functional assay showing cell fate asymmetry leads to distinct proliferation capacity. Left, schematic representation of the experimental approach. Single sphere cells were allowed to divide once in 24 hours (1st division). Cells were then treated with BrdU for 3 hours to label cells that were entering the 2nd division before co-staining for BrdU/ALDH1 and BrdU/CK20. Right, representative images showing that the CCSC daughter (ALDH1+ or CK20−) was more proliferative and incorporated BrdU. (E) Pair-cell assays with ALDH1 and CK20 co-immunofluorescence showing ectopic miR-34a expression promotes differentiation (D/D) at the expense of asymmetric division (C/D) and symmetric self-renewal (C/C). (F) Pair-cell assay with ALDH1 and CK20 co-immunofluorescence showing miR-34a knockdown increases symmetric self-renewal (C/C) at the expense of asymmetric division (C/D) and differentiation (D/D). (G and H) Immunofluorescence for ALDH1 and CK20 in pair-cell assays showing the percentages of symmetric CCSC/CCSC (C/C), asymmetric (C/D), and non-CCSC (D/D) divisions in sphere cells, which were cultured from CCSCs isolated from the xenografts of miR-34a OE (G) and miR-34a KD (H) spheres. Am, ambiguous. Blue is DAPI staining of the nucleus. Error bars denote the s.d. between triplicates. **, p<0.01; ***, p<0.001.
Figure 3
Figure 3. Symmetric and Asymmetric Distribution of miR-34a during division. Also see Figure S4
(A) Representative image of symmetric and asymmetric distribution of miR-34a (green) during division shown by RNA FISH. (B) Representative image of asymmetric expression of miR-34a shown by a miR-34a GFP reporter in living cells. A high GFP fluorescent signal indicates a low miR-34a expression level. (C) Representative images showing miR-34a (RNA FISH) and ALDH1 are mutually exclusive (M.E., top row) or are co-expressed (C.E., bottom row). (D) Percentages of CCSC divisions wherein miR-34a and ALDH1 are M.E. or C.E.. (E) Representative image of time-lapse images of asymmetric miR-34a expression during CCSC division with a miR-34a GFP reporter (top). CCSCs infected with a D2GFP control vector divided GFP symmetrically (bottom) (also see Movie S2). (F) miR-34alow daughter cell has more proliferative potential. Left, schematic representation of the experimental approach. Single cells were allowed to divide once in 24 hours (division 1). Cells were then treated with BrdU for 3 hours to label cells that were entering the 2nd division (division 2) before co-staining for BrdU/miR-34a. Right, representative image showing that the miR-34alow daughter was more proliferative and incorporated BrdU. Blue is DAPI staining of the nucleus. Scale bar, 8 µm. Error bars denote the s.d. between triplicates. ***, p<0.001.
Figure 4
Figure 4. miR-34a Targets Notch to Determine Cell Fate. Also see Figure S5
(A and B) Western blot (A) and RT-qPCR (B) showing that ectopic miR-34a expression (miR-34a OE) downregulates Notch1 expression. Error bars denote the s.d. between triplicates. (C) Notch signaling (NICD and Hes1) is upregulated in CCSCs and downregulated in non-CCSCs isolated by FACS. (D) Notch signaling (NICD and Hes1) is upregulated in CCSCs and downregulated in differentiation medium-induced differentiated cells. Diff: differentiation medium-induced differentiated cells. (E) The γ-secretase inhibitor DAPT inhibits Notch signaling (NICD, HES1) in CCSCs. (F) Notch inhibition by DAPT depletes CCSCs (CD133+CD44+) from spheres compared to the control (DMSO). (G) Notch inhibition by DAPT induces differentiation. The red histograms represent isotype controls, and the blank histograms represent CK20+ cells. (H and I) Inhibition of Notch signaling by anti-RBPJK shRNA reduced tumorigenicity of the sphere cells, shown by tumor images (H) and growth curves (I). Error bars denote the s.d. derived from 6 mice per group. (J) Representative images of immunofluorescence for NICD and ALDH1. Notch signaling (NICD, green) is only expressed in ALDH1+ (red) cells. (K) DAPT inhibits asymmetric division (C/D) and increases differentiation (D/D). C/C, CCSC/CCSC daughter pair; C/D, CCSC/non-CCSC daughter pair; D/D, non-CCSC/non-CCSC daughter pair ; Am, ambiguous. Error bars denote the s.d. between triplicates. (L) Representative time-lapse images of a Notch GFP reporter cell line showing the three types of division. Immunofluorescence of the same daughter pairs immediately after the movies confirmed that the Notch+ daughters were ALDH1+ and the Notch− daughters were CK20+ (also see Movie S2). (M) Representative time-lapse images showing that ectopic miR-34a expression increases symmetric Notchlow/Notchlow cell division (top) whereas miR-34a knockdown increases symmetric Notchhigh/Notchhigh cell division (bottom). (N) Western blot showing Numb levels in CCSCs and non-CCSCs. (O) Representative image of symmetric and asymmetric segregation of endogenous Numb (green) shown by immunofluorescence with Numb antibodies. (P) Representative image of asymmetric segregation of the Numb-GFP fusion protein in living cells. (Q) Representative image showing Numb and ALDH1 are mutually exclusive (M.E., top row) or are co-expressed (C.E) in at least one of the daughter cells (bottom row) during division. (R) Percentages of CCSC divisions wherein Numb and ALDH1 are M.E. or C.E. in daughter cells. Error bars denote the s.d. between triplicates. Blue is DAPI staining of the nucleus. Scale bar, 8 µm. **, p<0.01; ***, p<0.001.
Figure 5
Figure 5. miR-34a Generates Bimodal Notch levels. Also see Figure S6
(A) FACS plots of sphere cells showing bimodal Notch in CCSC sphere cells. The cutoff threshold was determined by the negative control in the top panel with isotype-matched IgG followed by FITC or PE conjugated secondary antibodies. Cutoff thresholds for the remaining FACs plots in Figure 5 were determined in a similar way. (B) Schematic representation showing signaling bimodality is important for robust cell fate decision. Bimodal signals enables the majority of cells to determine their fate unequivocally, while unimodal signals leave a big portion of the population undecided and subject to stochastic variations. (C and D) FACS plots showing miR-34a (C) and Numb (D) distribution in CCSC sphere cells. (E) FACS plot showing GFP levels from Notch1 3′UTR reporters with native (top) and mutated (bottom) miR-34a binding sites. (F) FACS plots showing the distribution of miR-34a and Notch levels in Numb knockdown (KD) and control CCSC sphere cells. Numb was knocked down by an shRNA vector. (G) FACS plots showing the distribution of Numb and Notch levels in miR-34a KD and control CCSC sphere cells. miR-34a was knocked down by microRNA sponges. (H) Schematic illustrating the inducible miR-34a construct used in the experiments shown in (J). (I) Schematic illustrating the inducible Numb construct used in the experiments shown in (K) and (L). (J) Notch1 displayed a bimodal, on-off response when miR-34a expression was incrementally induced by doxycycline, as shown by FACS. The miR-34a levels were measured by RT-qPCR and shown on top of the FACs plots. (K and L) FACS plots showing Notch1 distribution in wild-type CCSC sphere cells (K) and miR-34a KD ]CCSC sphere cells (L) when Numb expression was incrementally induced by doxycycline. The Numb levels were measured by RT-qPCR and shown on top of the FACs plots.
Figure 6
Figure 6. miR-34a generates Notch1 threshold response. Also see Figure S7
(A) A cartoon illustration of the mutual sequestration between miR-34a and Notch1 mRNA. (B) Mutual sequestration leads to a sharp, threshold response in simulation. M.S., mutual sequestration. (C) Schematic of a two-color fluorescent reporter. The reporter contains a bidirectional Tet-inducible promoter driving the expression of nuclear localization sequences (NLS) tagged mCherry and enhanced yellow fluorescent protein (eYFP). Notch 3′UTR or 4 repeats of bugled miR-34a binding sequence were cloned into the 3′UTR of mCherry. (D) Representative images of single cells expressing YFP and mCherry. Their 2 color reporters contain Notch 3′UTR (bottom), miR-34a binding sequence (middle) or neither (top). The reporters containing Notch 3′UTR or miR-34a binding sites show a sharper turn-on with a threshold-like response. (E) Transfer function relating eYFP to mCherry generated by binning the imaged cells according to eYFP intensity and plotting the mean mCherry level in each bin (a.u: arbitrary units). (F) A schematic illustration of the model. Mutual sequestration generates a threshold response that separates bimodal populations.

Comment in

References

    1. Alison MR, Lin WR, Lim SM, Nicholson LJ. Cancer stem cells: in the line of fire. Cancer treatment reviews. 2012;38:589–598. - PubMed
    1. Arrowsmith J. Trial watch: Phase II failures: 2008–2010. Nature reviews Drug discovery. 2011a;10:328–329. - PubMed
    1. Arrowsmith J. Trial watch: phase III and submission failures: 2007–2010. Nature reviews Drug discovery. 2011b;10:87. - PubMed
    1. Bultje RS, Castaneda-Castellanos DR, Jan LY, Jan YN, Kriegstein AR, Shi SH. Mammalian Par3 regulates progenitor cell asymmetric division via notch signaling in the developing neocortex. Neuron. 2009;63:189–202. - PMC - PubMed
    1. Choi YJ, Lin CP, Ho JJ, He X, Okada N, Bu P, Zhong Y, Kim SY, Bennett MJ, Chen C, et al. miR-34 miRNAs provide a barrier for somatic cell reprogramming. Nature cell biology. 2011;13:1353–1360. - PMC - PubMed

Publication types

MeSH terms