

Determination of the interfacial rheological properties of a poly(DL-lactic acid)-encapsulated contrast agent using in vitro attenuation and scattering
- PMID: 23643050
- PMCID: PMC3674163
- DOI: 10.1016/j.ultrasmedbio.2013.02.004
Determination of the interfacial rheological properties of a poly(DL-lactic acid)-encapsulated contrast agent using in vitro attenuation and scattering
Abstract
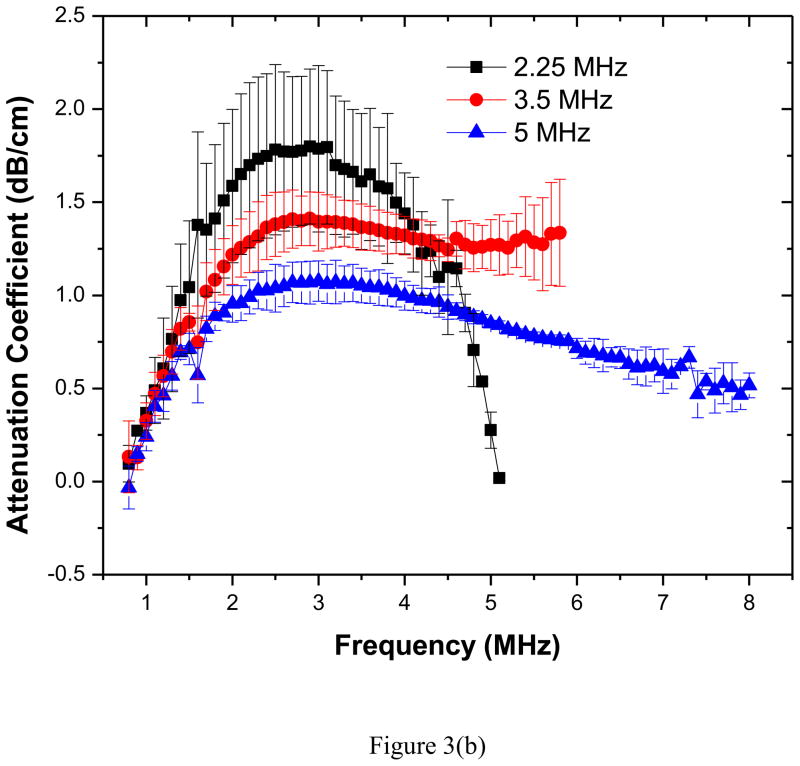
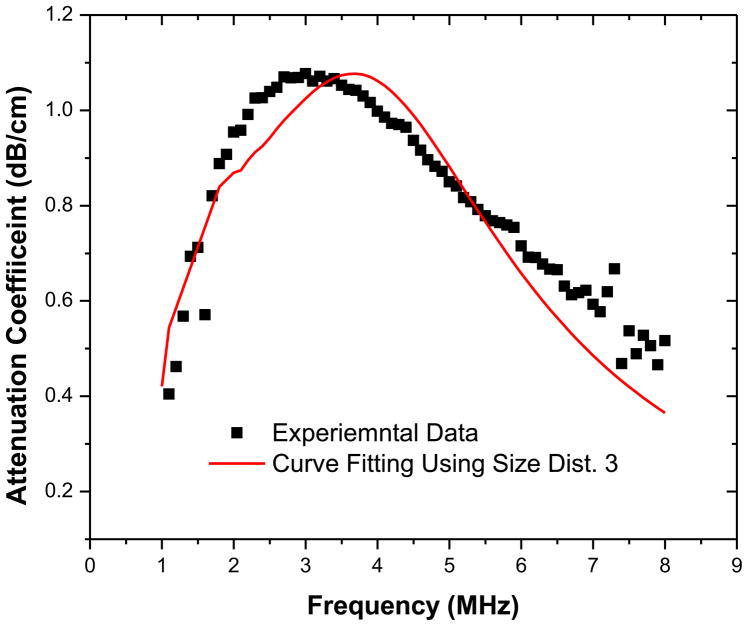
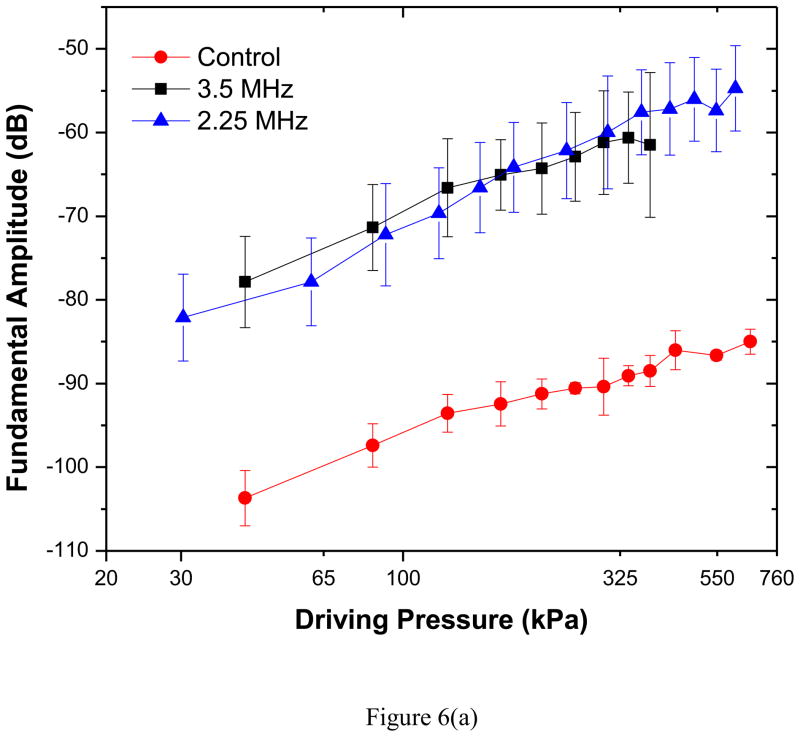
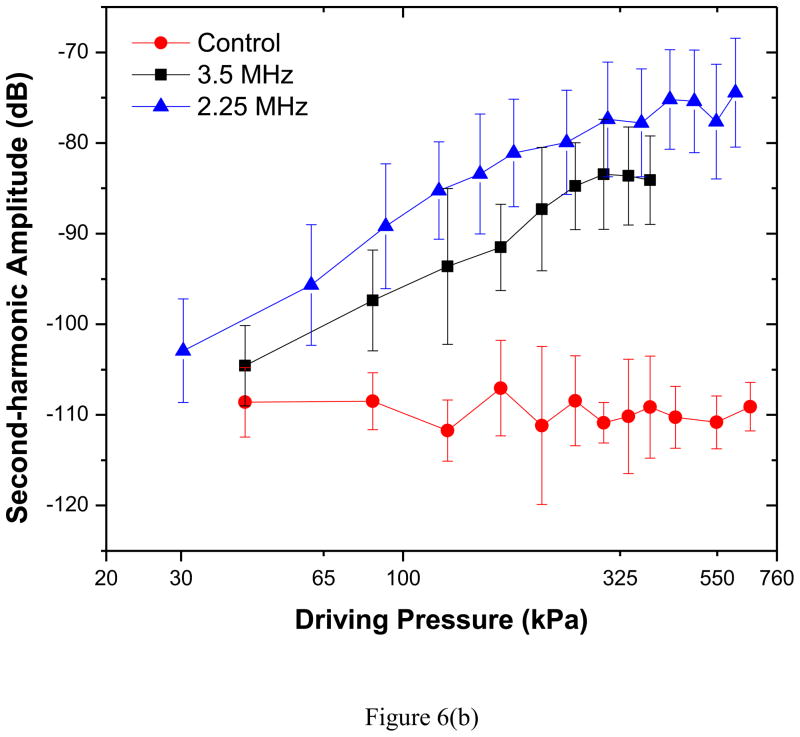
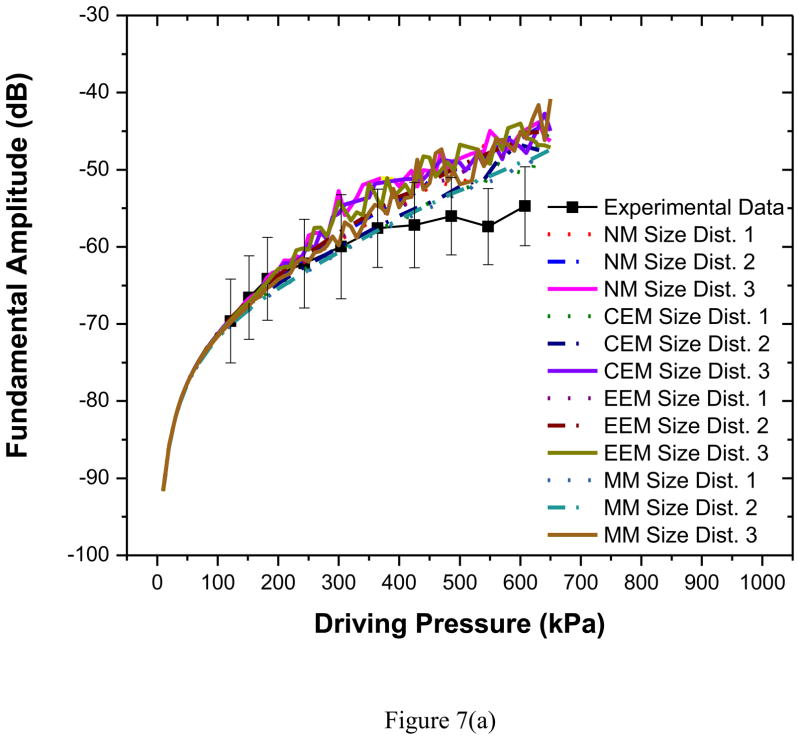
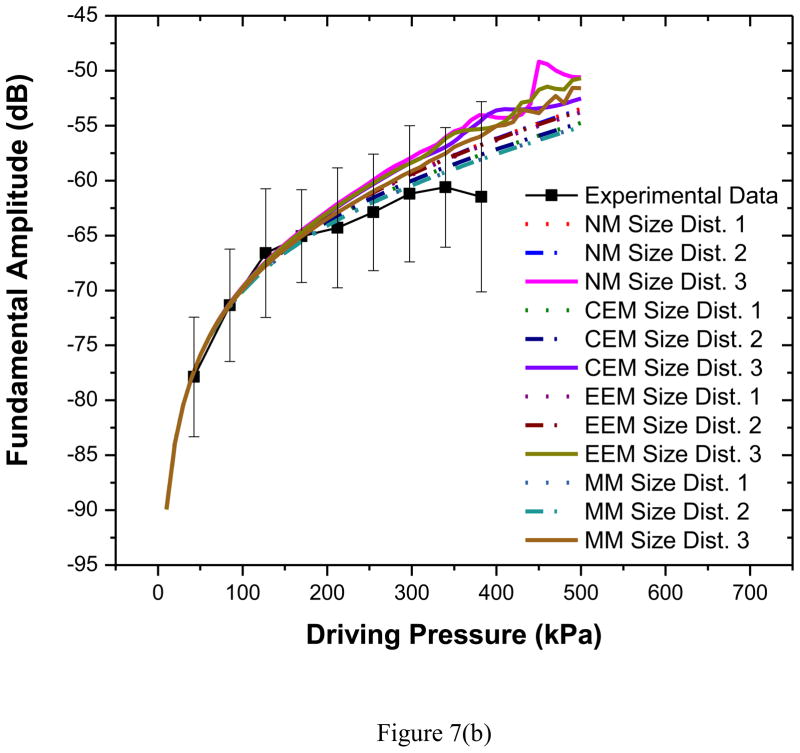
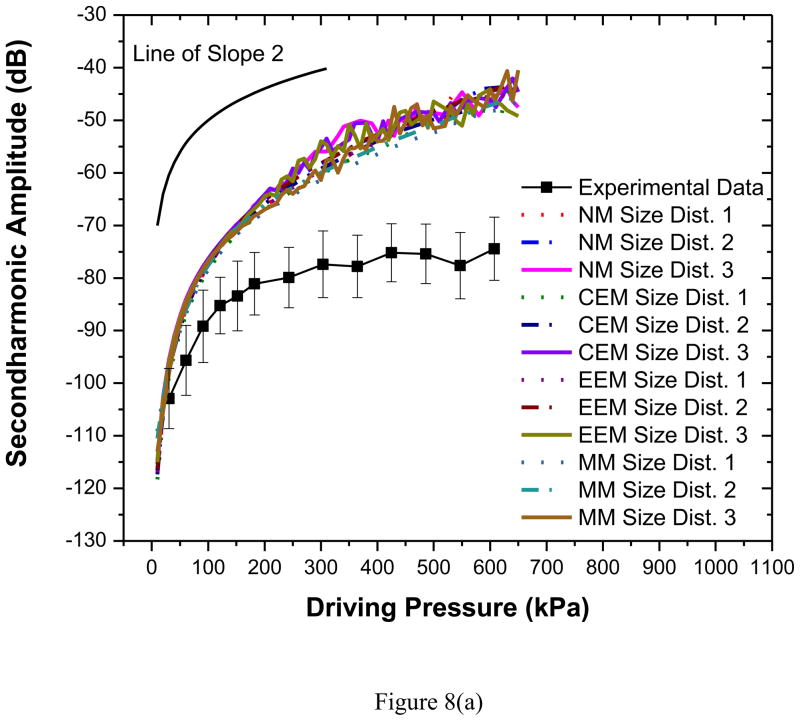
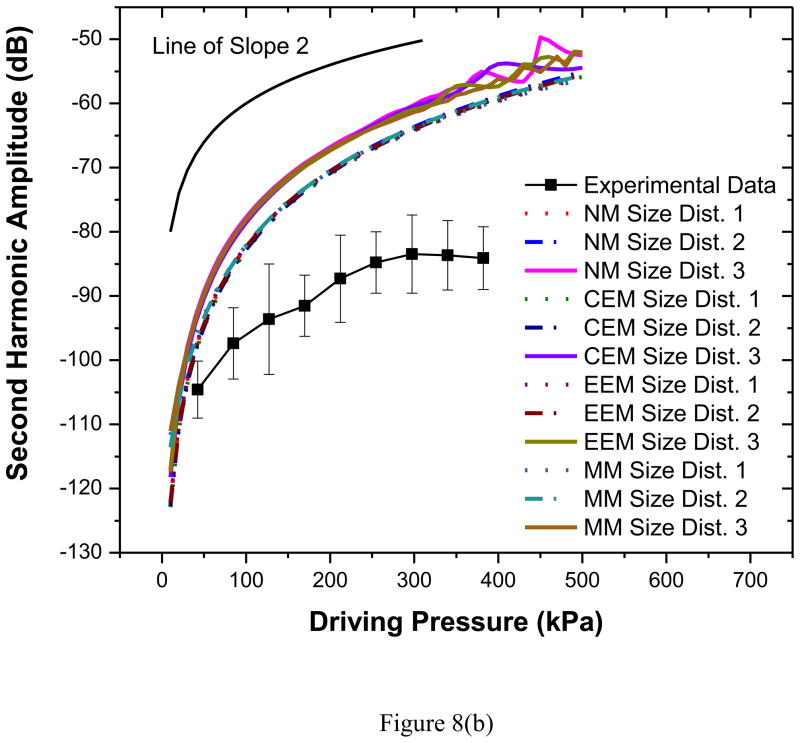
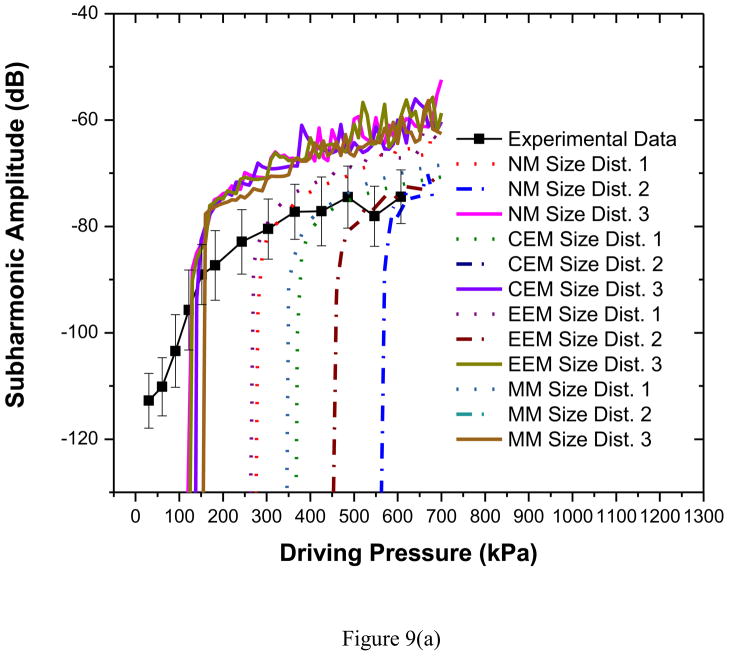
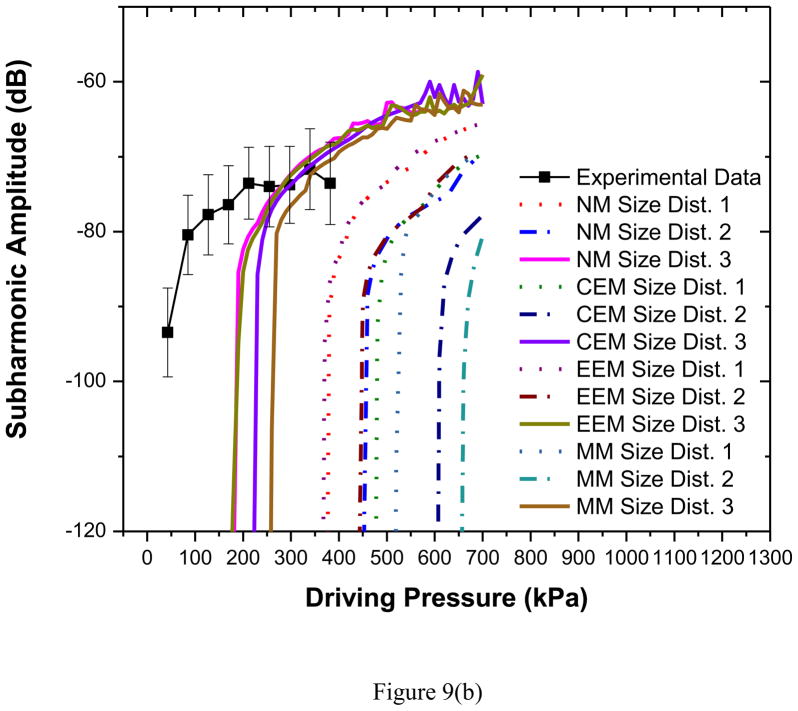
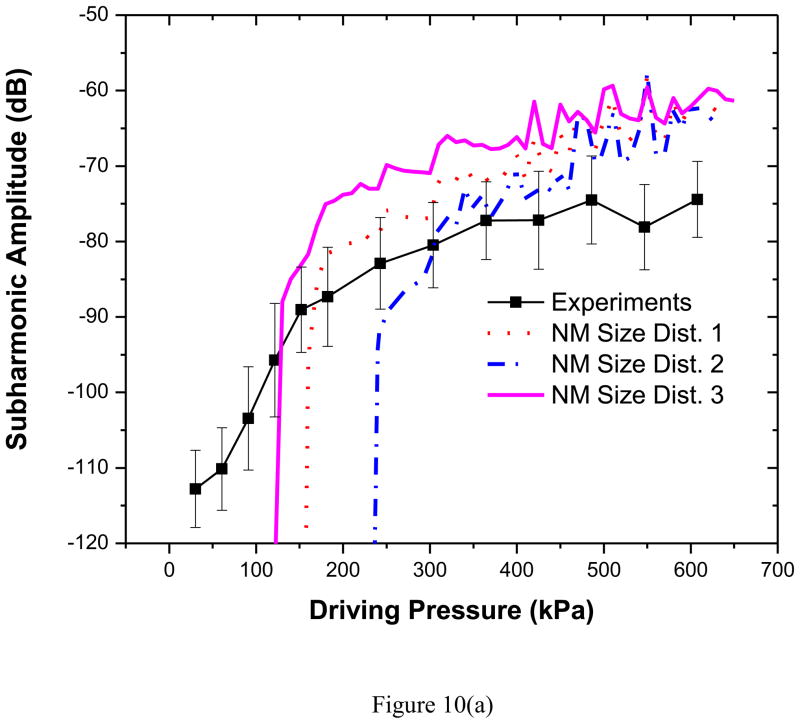
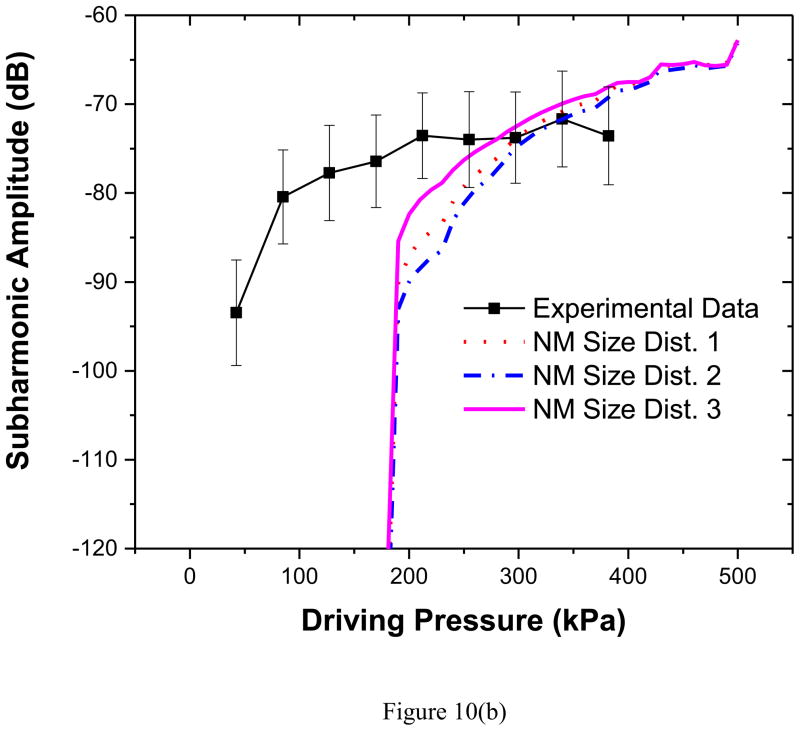
The stabilizing encapsulation of a microbubble-based ultrasound contrast agent (UCA) critically affects its acoustic properties. Polymers, which behave differently from materials commonly used (i.e., lipids or proteins) for monolayer encapsulation, have the potential for better stability and improved control of encapsulation properties. Air-filled microbubbles coated with poly(DL-lactic acid) (PLA) are characterized here using in vitro acoustic experiments and several models of encapsulation. The interfacial rheological properties of the encapsulation are determined according to each model using attenuation of ultrasound through a suspension of microbubbles. Then the model predictions are compared with scattered non-linear (sub- and second harmonic) responses. For this microbubble population (average diameter, 1.9 μm), the peak in attenuation measurement indicates a weighted-average resonance frequency of 2.5-3 MHz, which, in contrast to other encapsulated microbubbles, is lower than the resonance frequency of a free bubble of similar size (diameter, 1.9 μm). This apparently contradictory result stems from the extremely low surface dilational elasticity (around 0.01-0.07 N/m) and the reduced surface tension of the poly(DL-lactic acid) encapsulation, as well as the polydispersity of the bubble population. All models considered here are shown to behave similarly even in the non-linear regime because of the low surface dilational elasticity value. Pressure-dependent scattering measurements at two different excitation frequencies (2.25 and 3 MHz) revealed strongly non-linear behavior with 25-30 dB and 5-20 dB enhancements in fundamental and second-harmonic responses, respectively, for a contrast agent concentration of 1.33 μg/mL in the suspension. Sub-harmonic responses are registered above a relatively low generation threshold of 100-150 kPa, with up to 20 dB enhancement beyond that pressure. Numerical predictions from all models show good agreement with the experimentally measured fundamental response, but not with the experimental second-harmonic response. The characteristic features of sub-harmonic responses and the steady response beyond the threshold are matched well by model predictions. However, prediction of the threshold value depends on estimated properties and size distribution. The variation in size distribution from sample to sample leads to variation in estimates of encapsulation properties: the lowest estimated value for surface dilational viscosity better predicts the sub-harmonic threshold.
Copyright © 2013 World Federation for Ultrasound in Medicine & Biology. Published by Elsevier Inc. All rights reserved.
Figures

Similar articles
-
Interfacial Rheological Properties of Contrast Microbubble Targestar P as a Function of Ambient Pressure.Ultrasound Med Biol. 2016 Apr;42(4):1010-7. doi: 10.1016/j.ultrasmedbio.2015.11.017. Epub 2016 Jan 6. Ultrasound Med Biol. 2016. PMID: 26777069
-
Interpreting attenuation at different excitation amplitudes to estimate strain-dependent interfacial rheological properties of lipid-coated monodisperse microbubbles.J Acoust Soc Am. 2015 Dec;138(6):3994-4003. doi: 10.1121/1.4938234. J Acoust Soc Am. 2015. PMID: 26723353
-
Material characterization of the encapsulation of an ultrasound contrast microbubble and its subharmonic response: strain-softening interfacial elasticity model.J Acoust Soc Am. 2010 Jun;127(6):3846-57. doi: 10.1121/1.3418685. J Acoust Soc Am. 2010. PMID: 20550283 Free PMC article.
-
Ultrasound contrast agents: basic principles.Eur J Radiol. 1998 May;27 Suppl 2:S157-60. doi: 10.1016/s0720-048x(98)00057-6. Eur J Radiol. 1998. PMID: 9652516 Review.
-
Italian Society of Cardiovascular Echography (SIEC) Consensus Conference on the state of the art of contrast echocardiography.Ital Heart J. 2004 Apr;5(4):309-34. Ital Heart J. 2004. PMID: 15185894 Review.
Cited by
-
Effects of Different Gas Cores on the Ambient Pressure Sensitivity of the Subharmonic Response of SonoVue.Ultrasound Med Biol. 2025 Feb;51(2):373-380. doi: 10.1016/j.ultrasmedbio.2024.11.006. Epub 2024 Nov 24. Ultrasound Med Biol. 2025. PMID: 39581820
-
Echogenic Exosomes as ultrasound contrast agents.Nanoscale Adv. 2020 Aug 1;2(8):3411-3422. doi: 10.1039/d0na00339e. Epub 2020 Jun 18. Nanoscale Adv. 2020. PMID: 36034734 Free PMC article.
-
Encapsulated microbubbles and echogenic liposomes for contrast ultrasound imaging and targeted drug delivery.Comput Mech. 2014 Mar;53(3):413-435. doi: 10.1007/s00466-013-0962-4. Comput Mech. 2014. PMID: 26097272 Free PMC article.
-
Material Properties, Dissolution and Time Evolution of PEGylated Lipid-Shelled Microbubbles: Effects of the Polyethylene Glycol Hydrophilic Chain Configurations.Ultrasound Med Biol. 2022 Sep;48(9):1720-1732. doi: 10.1016/j.ultrasmedbio.2022.04.216. Epub 2022 Jun 10. Ultrasound Med Biol. 2022. PMID: 35697583 Free PMC article.
-
Acoustic vaporization threshold of lipid-coated perfluoropentane droplets.J Acoust Soc Am. 2018 Apr;143(4):2001. doi: 10.1121/1.5027817. J Acoust Soc Am. 2018. PMID: 29716255 Free PMC article.
References
-
- Brennen CE. Cavitation and Bubble Dynamics. Oxford University Press; 1995.
-
- Brenner MP, Hilgenfeldt S, Lohse D. Single-bubble sonoluminescence. Reviews of Modern Physics. 2002;74:425–84.
-
- Casciaro S, Errico RP, Conversano F, Demitri C, Distante A. Experimental investigations of nonlinearities and destruction mechanisms of an experimental phospholipid-based ultrasound contrast agent. Investigative Radiology. 2007;42:95–104. - PubMed
-
- Chatterjee D, Jain P, Sarkar K. Ultrasound-mediated destruction of contrast microbubbles used for medical imaging and drug delivery. Physics of Fluids. 2005a;17:100603.
-
- Chatterjee D, Sarkar K. A Newtonian rheological model for the interface of microbubble contrast agents. Ultrasound in Medicine and Biology. 2003;29:1749–57. - PubMed
Publication types
MeSH terms
Substances
Grants and funding
LinkOut - more resources
Full Text Sources
Other Literature Sources
Miscellaneous
