

Cardiac magnetic resonance T1 mapping of left atrial myocardium
- PMID: 23643513
- PMCID: PMC3757110
- DOI: 10.1016/j.hrthm.2013.05.003
Cardiac magnetic resonance T1 mapping of left atrial myocardium
Abstract
Background: Cardiac magnetic resonance (CMR) T1 mapping is an emerging tool for objective quantification of myocardial fibrosis.
Objectives: To (a) establish the feasibility of left atrial (LA) T1 measurements, (b) determine the range of LA T1 values in patients with atrial fibrillation (AF) vs healthy volunteers, and (c) validate T1 mapping vs LA intracardiac electrogram voltage amplitude measures.
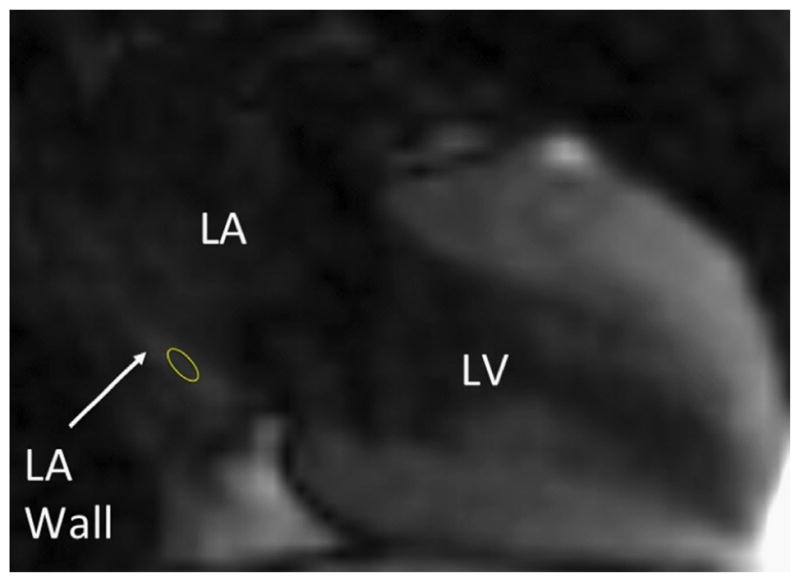
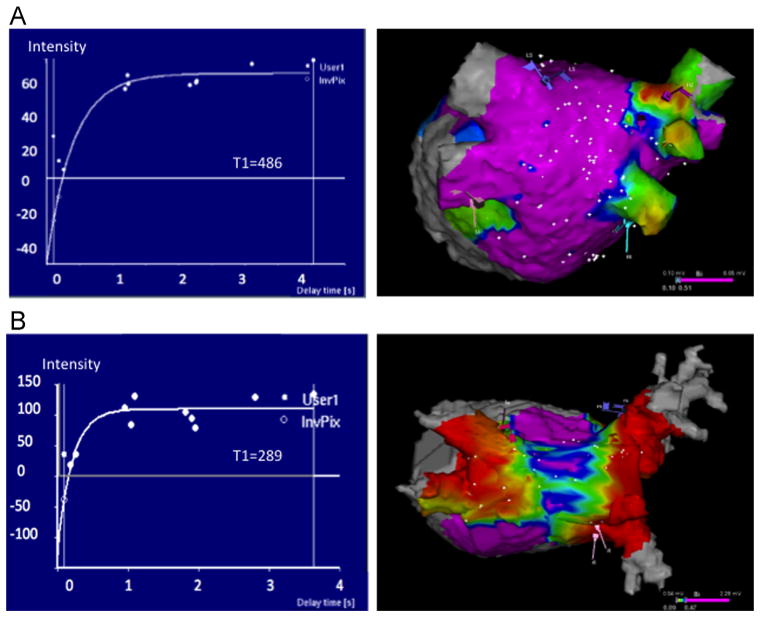
Methods: CMR imaging at 1.5 T was performed in 51 consecutive patients before AF ablation and in 16 healthy volunteers. T1 measurements were obtained from the posterior LA myocardium by using the modified Look-Locker inversion-recovery sequence. Given the established association of reduced electrogram amplitude with fibrosis, intracardiac point-by-point bipolar LA voltage measures were recorded for the validation of T1 measurements.
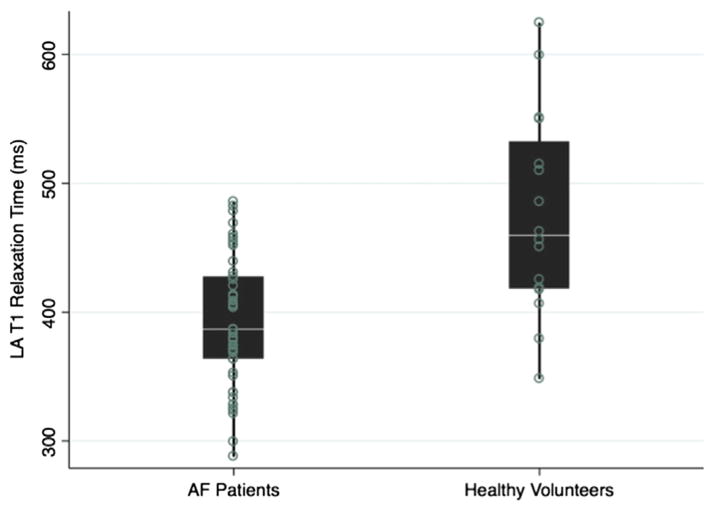
Results: The median LA T1 relaxation time was shorter in patients with AF (387 [interquartile range 364-428] ms) compared to healthy volunteers (459 [interquartile range 418-532] ms; P < .001) and was shorter in patients with AF with prior ablation compared to patients without prior ablation (P = .035). In a generalized estimating equations model, adjusting for data clusters per participant, age, rhythm during CMR, prior ablation, AF type, hypertension, and diabetes, each 100-ms increase in T1 relaxation time was associated with 0.1 mV increase in intracardiac bipolar LA voltage (P = .025).
Conclusions: Measurement of the LA myocardium T1 relaxation time is feasible and strongly associated with invasive voltage measures. This methodology may improve the quantification of fibrotic changes in thin-walled myocardial tissues.
Keywords: AF; Atrial fibrillation; CI; CMR; Cardiac magnetic resonance; GEE; IQR; LA; LGE-CMR; LV; Late gadolinium enhancement; Left atrial fibrosis; PVAI; ROI; T1 mapping; atrial fibrillation; cardiac magnetic resonance; confidence interval; generalized estimating equation; interquartile range; late gadolinium enhancement on cardiac magnetic resonance; left atrial; left ventricular; pulmonary vein antral isolation; region of interest.
© 2013 Heart Rhythm Society. Published by Elsevier Inc. All rights reserved.
Figures
Comment in
-
Toward better patient selection for ablation: a new method for measuring atrial fibrosis.Heart Rhythm. 2013 Sep;10(9):1332-3. doi: 10.1016/j.hrthm.2013.05.015. Epub 2013 May 21. Heart Rhythm. 2013. PMID: 23707490 No abstract available.
Similar articles
-
Sinus rhythm restores ventricular function in patients with cardiomyopathy and no late gadolinium enhancement on cardiac magnetic resonance imaging who undergo catheter ablation for atrial fibrillation.Heart Rhythm. 2013 Sep;10(9):1334-9. doi: 10.1016/j.hrthm.2013.06.019. Epub 2013 Jun 27. Heart Rhythm. 2013. PMID: 23811081
-
Myocardial extracellular volume expansion and the risk of recurrent atrial fibrillation after pulmonary vein isolation.JACC Cardiovasc Imaging. 2014 Jan;7(1):1-11. doi: 10.1016/j.jcmg.2013.08.013. Epub 2013 Nov 27. JACC Cardiovasc Imaging. 2014. PMID: 24290570 Free PMC article.
-
Evaluation of quantification methods for left arial late gadolinium enhancement based on different references in patients with atrial fibrillation.Int J Cardiovasc Imaging. 2015 Jun;31 Suppl 1:91-101. doi: 10.1007/s10554-014-0563-0. Epub 2014 Nov 4. Int J Cardiovasc Imaging. 2015. PMID: 25367893
-
New Insights Into the Use of Cardiac Magnetic Resonance Imaging to Guide Decision Making in Atrial Fibrillation Management.Can J Cardiol. 2018 Nov;34(11):1461-1470. doi: 10.1016/j.cjca.2018.07.007. Epub 2018 Jul 12. Can J Cardiol. 2018. PMID: 30297256 Review.
-
Assessment and impact of cardiac fibrosis on atrial fibrillation.Curr Cardiol Rep. 2014 Aug;16(8):518. doi: 10.1007/s11886-014-0518-z. Curr Cardiol Rep. 2014. PMID: 24950676 Review.
Cited by
-
Association of left atrial function and left atrial enhancement in patients with atrial fibrillation: cardiac magnetic resonance study.Circ Cardiovasc Imaging. 2015 Feb;8(2):e002769. doi: 10.1161/CIRCIMAGING.114.002769. Circ Cardiovasc Imaging. 2015. PMID: 25652181 Free PMC article.
-
New Technologies In Atrial Fibrillation Ablation.J Atr Fibrillation. 2014 Aug 31;7(2):1022. doi: 10.4022/jafib.1022. eCollection 2014 Aug-Sep. J Atr Fibrillation. 2014. PMID: 27957091 Free PMC article. Review.
-
MRI use for atrial tissue characterization in arrhythmias and for EP procedure guidance.Int J Cardiovasc Imaging. 2018 Jan;34(1):81-95. doi: 10.1007/s10554-017-1179-y. Epub 2017 Jun 7. Int J Cardiovasc Imaging. 2018. PMID: 28593399 Free PMC article. Review.
-
Atrial fibrillation therapy now and in the future: drugs, biologicals, and ablation.Circ Res. 2014 Apr 25;114(9):1532-46. doi: 10.1161/CIRCRESAHA.114.302362. Circ Res. 2014. PMID: 24763469 Free PMC article. Review.
-
Personalized biomechanical insights in atrial fibrillation: opportunities & challenges.Expert Rev Cardiovasc Ther. 2023 Jul-Dec;21(11):817-837. doi: 10.1080/14779072.2023.2273896. Epub 2023 Dec 10. Expert Rev Cardiovasc Ther. 2023. PMID: 37878350 Free PMC article. Review.
References
-
- Chugh SS, Blackshear JL, Shen WK, Hammill SC, Gersh BJ. Epidemiology and natural history of atrial fibrillation: clinical implications. Am Coll Cardiol. 2001;37:371–378. - PubMed
-
- Calkins H, Kuck KH, Cappato R, et al. HRS/EHRA/ECAS expert consensus statement on catheter and surgical ablation of atrial fibrillation: recommendations for patient selection, procedural techniques, patient management and follow-up, definitions, endpoints, and research trial design. A report of the Heart Rhythm Society (HRS) task force on catheter and surgical ablation of atrial fibrillation. Developed in partnership with the European Heart Rhythm Association (EHRA), a registered branch of the European Society of Cardiology (ESC) and the European Cardiac Arrhythmia Society (ECAS); and in collaboration with the American College of Cardiology (ACC), American Heart Association (AHA), the Asia Pacific Heart Rhythm Society (APHRS), and the Society of Thoracic Surgeons (STS). Endorsed by the governing bodies of the American College of Cardiology Foundation, the American Heart Association, the European Cardiac Arrhythmia Society, the European Heart Rhythm Association, the Society of Thoracic Surgeons, the Asia Pacific Heart Rhythm Society, and the Heart Rhythm Society. Heart Rhythm. 2012;9:632–696. e621. - PubMed
-
- Frustaci A, Chimenti C, Bellocci F, Morgante E, Russo MA, Maseri A. Histological substrate of atrial biopsies in patients with lone atrial fibrillation. Circulation. 1997;96:1180–1184. - PubMed
-
- Kostin S, Klein G, Szalay Z, Hein S, Bauer EP, Schaper J. Structural correlate of atrial fibrillation in human patients. Cardiovasc Res. 2002;54:361–379. - PubMed
Publication types
MeSH terms
Substances
Grants and funding
LinkOut - more resources
Full Text Sources
Other Literature Sources
Medical
