. 2013 May 23;38(5):906-17.
doi: 10.1016/j.immuni.2013.04.007. Epub 2013 May 2.

A truncated splice-variant of the FcεRIβ receptor subunit is critical for microtubule formation and degranulation in mast cells

Affiliations

A truncated splice-variant of the FcεRIβ receptor subunit is critical for microtubule formation and degranulation in mast cells

Glenn Cruse et al. Immunity. .

Abstract

Human linkage analyses have implicated the MS4A2-containing gene locus (encoding FcεRIβ) as a candidate for allergy susceptibility. We have identified a truncation of FcεRIβ (t-FcεRIβ) in humans that contains a putative calmodulin-binding domain and thus, we sought to identify the role of this variant in mast cell function. We determined that t-FcεRIβ is critical for microtubule formation and degranulation and that it may perform this function by trafficking adaptor molecules and kinases to the pericentrosomal and Golgi region in response to Ca2+ signals. Mutagenesis studies suggest that calmodulin binding to t-FcεRIβ in the presence of Ca2+ could be critical for t-FcεRIβ function. In addition, gene targeting of t-FcεRIβ attenuated microtubule formation, degranulation, and IL-8 production downstream of Ca2+ signals. Therefore, t-FcεRIβ mediates Ca2+ -dependent microtubule formation, which promotes degranulation and cytokine release. Because t-FcεRIβ has this critical function, it represents a therapeutic target for the downregulation of allergic inflammation.


Conflict of interest statement

The authors declare no conflicts of interest.

Figures
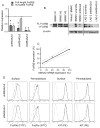
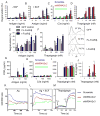
Figure 1
Figure 1. see also Figure S1
Validation of FcεRIβ silencing in LAD-2 HuMC. A. shMS4A2v1 silenced both FcεRIβ variants with low efficiency. shMS4A2v2 selectively silenced FL-FcεRIβ without accompanied silencing of t-FcεRIβ. shMS4A2v3 silenced both variants with high efficiency. Data are the means ± SEM (n=3). *p<0.05. D. Silencing the different constructs for FcεRIβ also resulted in a reduction in FcεRIβ protein levels. Two bands were detected in BMMC which corresponded to the predicted size of the FcεRIβ variants (~28 and ~22 kDa). These bands were not present in Ms4a2−/− BMMC. Data are representative of at least 2 separate blots. E. The reduction in FL-FcεRIβ mRNA expression correlates well with the reduction in FL-FcεRIβ protein levels. Each point represents the mean expression from the different shRNA constructs. R2 = 0.964, p=0.018. F. Silencing of FL-FcεRIβ, shMS4A2v2 (top panels), and both FcεRIβ variants, shMS4A2v3 (bottom panels), reduced FcεRIα expression without affecting KIT expression. Both surface expression of FcεRIα and total expression of FcεRIα (permeabilized cells) significantly decreased following transduction. Histograms are representative of at least 3 separate experiments. Gray line = isotype control, black line = scramble control, dashed line = shRNA constructs.
Figure 2
Figure 2. see also Figure S2
Multiple roles for FcεRIβ in MC degranulation. A. Both shMS4A2v2 and shMS4A2v3 inhibit antigen-induced β-hex release from LAD-2 HuMC to a similar degree. B. Addition of 100 ng/ml SCF increased β-hex release, but did not affect the degree of inhibition. C. IgE-independent degranulation induced by C3a was enhanced with FL-FcεRIβ targeting (shMS4A2v2 – gray bars) but was inhibited with silencing of both variants of FcεRIβ (shMS4A2v3 – open bars). D. Similarly, receptor-independent thapsigargin-induced β-hex release was potentiated with FL-FcεRIβ silencing at sub-maximal doses, but silencing both variants significantly reduced degranulation. Data are the means ± SEM from 4–6 experiments. *p<0.05. E. Overexpression of FL-FcεRIβ inhibits antigen-induced (E) and thapsigargin-induced (F) degranulation in LAD-2 HuMC whilst overexpression of t-FcεRIβ potentiates degranulation. Histograms demonstrate GFP expression assessed by FACS analysis prior to the assays. G. Both shMS4A2v2 and shMS4A2v3 inhibited antigen-induced PGD2 release with similar efficacy to β-hex release. H. C3a did not induce PGD2 release. I. Thapsigargin-induced PGD2 release was not affected by either shMS4A2v2 or shMS4A2v3. J. IL-8 release induced by thapsigargin was potentiated with FL-FcεRIβ silencing and significantly inhibited with shMS4A2v3. K. Ca2+ influx was reduced in antigen stimulated cells in the absence (K) and presence (L) of 100 ng/ml SCF which was comparable to mediator release. M. Ca2+ release from stores in response to thapsigargin was measured in Ca2+-free medium and was unaffected either shRNA construct. Store-operated Ca2+ entry was then assessed by the addition of extracellular Ca2+ and modest reductions in Ca2+ influx with the shRNA constructs were observed. Data are the means ± SEM from 3 experiments (E–J) * p<0.05. Ca2+ imaging data are representative of 2 separate experiments performed in duplicate (K–M).
Figure 3
Figure 3. see also Figure S3
Effects of FcεRIβ silencing on LAD-2 HuMC signaling. A. LAD-2 HuMC were stimulated with either Ag (100 ng/ml), C3a (1000 ng/ml), SCF (100 ng/ml) or mock-treated for 2 min. Immunoblots demonstrating a small reduction in both PLCγ1 and Akt phosphorylation with Ag stimulation with both shMS4A2v2 and shMS4A2v3. There were no significant differences with C3a and SCF stimulation. A similar pattern was observed with MAPK (Jnk and ERK1/2) phosphorylation. However, with the shMS4A2v3 cells, there was a reduction in Jnk phosphorylation with C3a and with SCF stimulation. There was no obvious difference in SHIP-1 phosphorylation with either shRNA construct. B. Immunoblots demonstrating that there was increased phosphorylation of MAPKs with shMS4A2v2, but there was no difference between the shMS4A2v3 and control after stimulation with 100 nM thapsigargin for 2 min. Numbers represent the relative phosphorylation compared to scramble control using densitometry with correction against total protein. Immunoblots are representative of at least 2 independent experiments.
Figure 4
Figure 4. see also Figure S4
T-FcεRIβ coimmunoprecipitates with Gab2, α-tubulin, PI3K, Fyn kinase and binds calmodulin in the presence of Ca2+. A. LAD-2 HuMC lysates were captured with an immunoprecipitated t-FcεRIβ:GFP chimera in the absence and presence of 2 mM Ca2+ and immunoblots demonstrated that CaM was pulled down preferentially with t-FcεRIβ in the presence of Ca2+. Probing with a phosphotyrosine Ab demonstrated phosphorylated bands concentrated around 50–60 kDa (bottom arrow) and 80–100 kDa (top arrow) in the presence of Ca2+. B. Immunoblotting for Gab2 (97 kDa), PI3K p85 (85 kDa), Fyn kinase (59 kDa) and α-tubulin (55 kDa) demonstrated pulldown of these proteins with t-FcεRIβ in the presence and absence of Ca2+. Binding of CaM to the complex was again enhanced in the presence of Ca2+. C. Mutation of the putative CaM binding domain of t-FcεRIβ reduced CaM binding. This was particularly evident with CaM mut 2 (see text). Histograms demonstrate equal transfection efficiencies and level of expression for each construct prior to pull-downs. Similar results were obtained with immunoprecipitated GFP:t-FcεRIβ variants used as bait for CaM, and CaM sepharose beads used to pull out CaM-binding proteins from transfected lysates. Cell lysates, after pulldown, were run as the unbound fraction and were 5x less concentrated than the bound fraction. Immunoblots are representative of at least 2 independent experiments. D. Mutation of the CaM binding domain of t-FcεRIβ (CaM mut 2) eliminates the potentiation of degranulation from transfection of t-FcεRIβ into LAD-2 HuMC in response to both antigen (D) and thapsigargin (E). Inset: histogram demonstrating equal expression of t-FcεRIβ and CaM mut 2 measured by FACS analysis prior to assays for D and E. F. Transfection of WT t-FcεRIβ, but not t-FcεRIβ CaM mut 2, after silencing of both FcεRIβ isoforms partially recovered thapsigargin-induced degranulation measured by β-hex release (F) and surface LAMP2 (G). Inset: histograms demonstrate comparable expression levels for each transfected construct (gray = untransfected, black = transfected). Data are the means ± SEM from 3 experiments (DG).*p≤0.05, **p≤0.01, ***p ≤0.001.
Figure 5
Figure 5. see also Figure S5
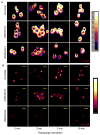
Silencing of t-FcεRIβ results in a deficiency in microtubule formation and cytoskeletal dynamics. A. 3D intensity plots demonstrating the dynamics of filamentous (F)-actin. The top panels demonstrate a decrease in fluorescence intensity of phalloidin (FITC) stained LAD-2 HuMC treated with scramble shRNA at 2 min post-stimulation with thapsigargin followed by a marked increase in intensity evident at 5 and 10 min. The middle panels and lower panels show the equivalent conditions with silencing of FL-FcεRIβ and both FL-FcεRIβ and t-FcεRIβ, respectively. There was a dramatic reduction in repolymerization of actin evident at 5 min when additional silencing of t-FcεRIβ (shMS4A2v3) was compared to scrambled control. B. Microtubule assembly. The top panels show the same cells as A co-stained for α-tubulin. There was a marked induction of microtubule formation with stimulation of the scramble control and FL-FcεRIβ silenced cells showing the typical intense point adjacent to the nucleus representing activation of the MTOC indicative of microtubule formation. Bottom panels show that there was a deficiency in microtubule formation with additional silencing of t-FcεRIβ. Data are representative of several fields from 2 independent experiments. Yellow scale bar = 20 μm. Rabbit IgG control Ab was negative (see Figure S7).
Figure 6
Figure 6. see also Figure S6 and Supplemental movie 1
The t-FcεRIβ complex translocates following Ca2+ influx. A. The t-FcεRIβ:GFP chimera transfected into LAD-2 HuMC rapidly translocates to form a ring-like structure adjacent to the nucleus after stimulation with 100 nM thapsigargin. B. Immunofluorescence and confocal micrographs of Fyn kinase and Gab2 localization following stimulation with 100 nM thapsigargin for 1 min. There was accumulation of both Fyn and Gab2 to a similar location as t-FcεRIβ after stimulation with thapsigargin in the scramble controls and with silencing of FL-FcεRIβ. However, when both variants of FcεRIβ were silenced perinuclear localization was less evident.
Figure 7
Figure 7. see also Figure S7 and Supplemental movies, 2, 3, 4 and 5
T-FcεRIβ and Gab2 colocalized to the Golgi Apparatus which surrounds the microtubule organization center. A. Confocal micrographs showing that t-FcεRIβ (green) and Gab2 (red) colocalized (yellow) to a structure near the nucleus (top panels). CaM mut 2 t-FcεRIβ exhibited reduced colocalization with Gab2 (bottom panels and bar graph – data expressed as mean ± SD, ***p<0.001 ANOVA). B. 3D reconstruction and surface rendering of deconvolved image stacks revealed t-FcεRIβ (green) and Gab2 (purple) form a structure with a hollow center adjacent to the bilobed nucleus (blue). There was colocalization (yellow) only in the region adjacent to the nucleus (top panels), which was less evident with CaM mut 2 (bottom panels). C. The t-FcεRIβ complex surrounds the MTOC. Confocal micrographs demonstrating that t-FcεRIβ (green) circles the MTOC, which appears as a dense α-tubulin (red) rich region adjacent to the nucleus. 3D render of average intensity of the Z stack demonstrates that t-FcεRIβ surrounds the MTOC. The translocation of t-FcεRIβ was less evident with CaM mut 2 (bottom panels). D. 3D reconstruction of these structures revealed that the hollow center of the t-FcεRIβ (green) structure was completely filled with α-tubulin (red). There was little colocalization (yellow) of t-FcεRIβ and α-tubulin, but points of contact were apparent which could represent nucleation of microtubules at the Golgi. It was also apparent that the centrosome structure formed by the MTOC and t-FcεRIβ complex caused considerable indentation into the nucleus (blue). E. Confocal micrographs demonstrating that t-FcεRIβ (green) forms an identical structure as the cis-Golgi protein GM130 (red).

References

    1. Blank U, Rivera J. The ins and outs of IgE-dependent mast-cell exocytosis. Trends Immunol. 2004;25:266–273. - PubMed
    1. Cookson WO, Sharp PA, Faux JA, Hopkin JM. Linkage between immunoglobulin E responses underlying asthma and rhinitis and chromosome 11q. Lancet. 1989;1:1292–1295. - PubMed
    1. Cruse G, Kaur D, Leyland M, Bradding P. A novel FcεRIβ-chain truncation regulates human mast cell proliferation and survival. FASEB J. 2010;24:4047–4057. - PMC - PubMed
    1. Donnadieu E, Cookson WO, Jouvin MH, Kinet JP. Allergy-associated polymorphisms of the FcεRIβ subunit do not impact its two amplification functions. J Immunol. 2000a;165:3917–3922. - PubMed
    1. Donnadieu E, Jouvin MH, Kinet JP. A second amplifier function for the allergy-associated FcεRI-β subunit. Immunity. 2000b;12:515–523. - PubMed

Publication types

MeSH terms