. 2013 Sep 20:90:15-24.
doi: 10.1016/j.visres.2013.04.011. Epub 2013 Apr 30.

Psychophysical contrast calibration

Affiliations

Psychophysical contrast calibration

Long To et al. Vision Res. .

Abstract

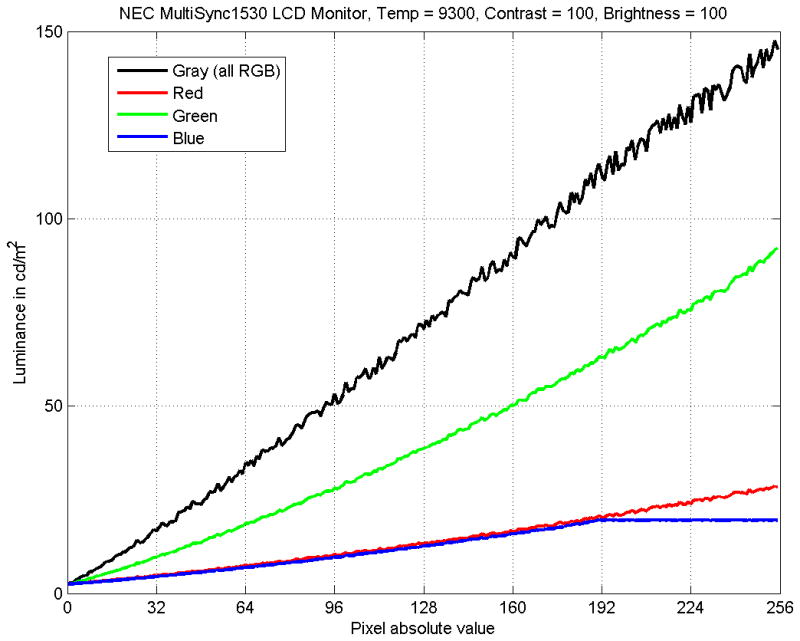
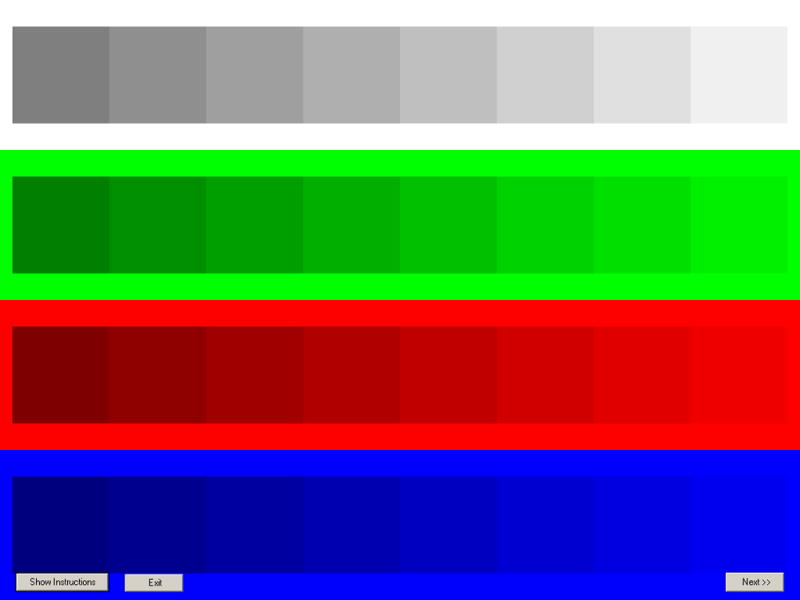
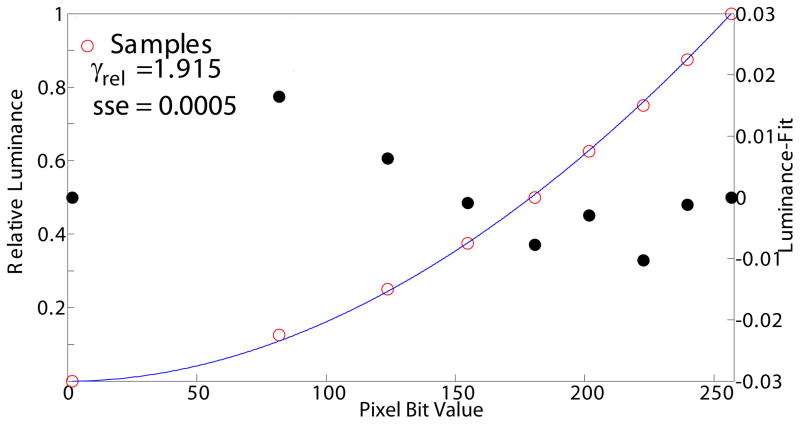
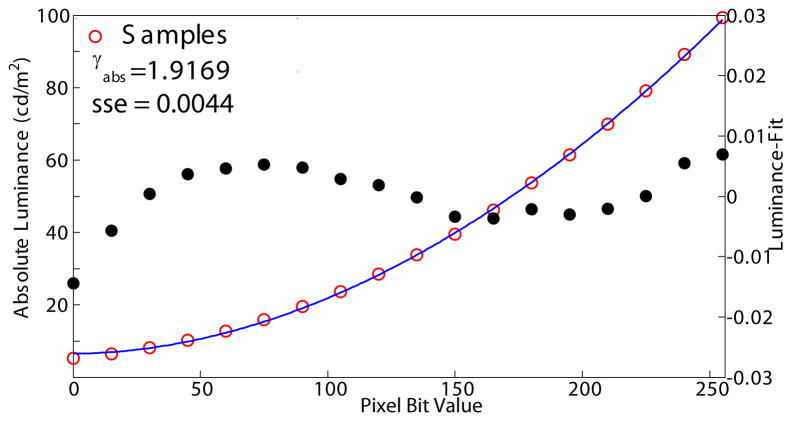
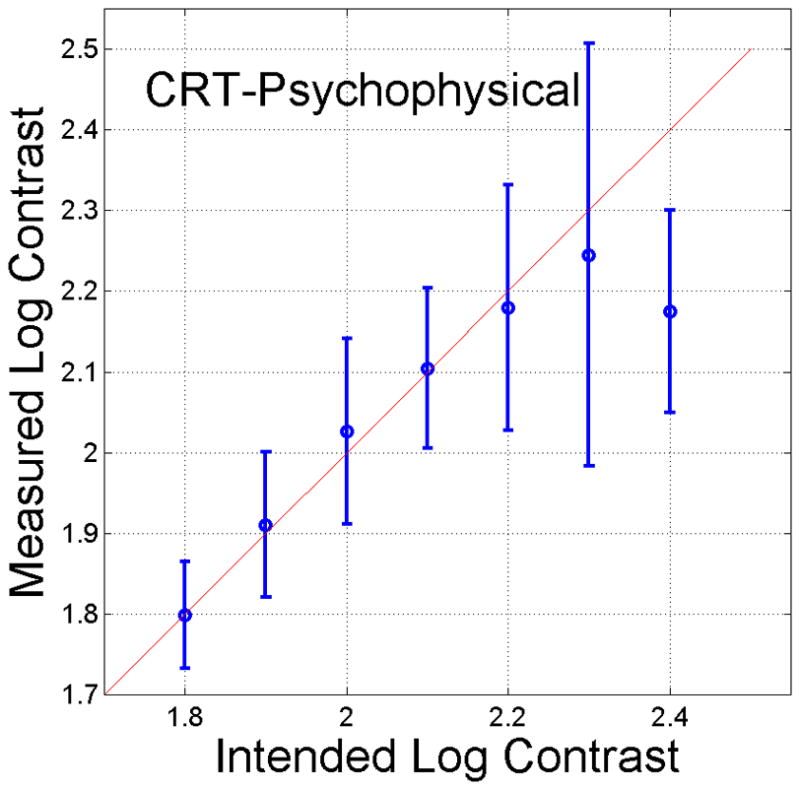
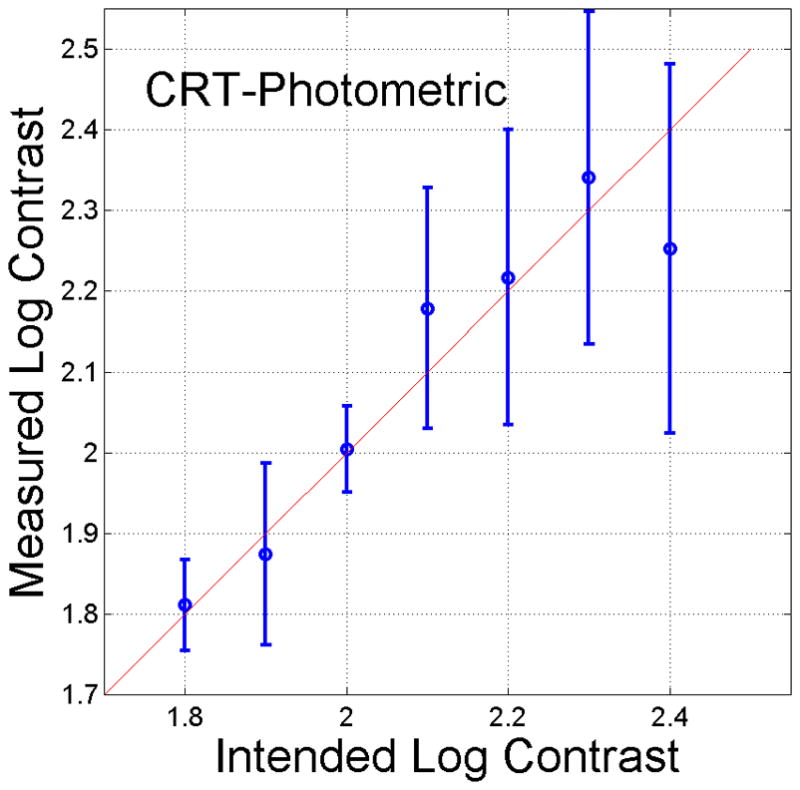
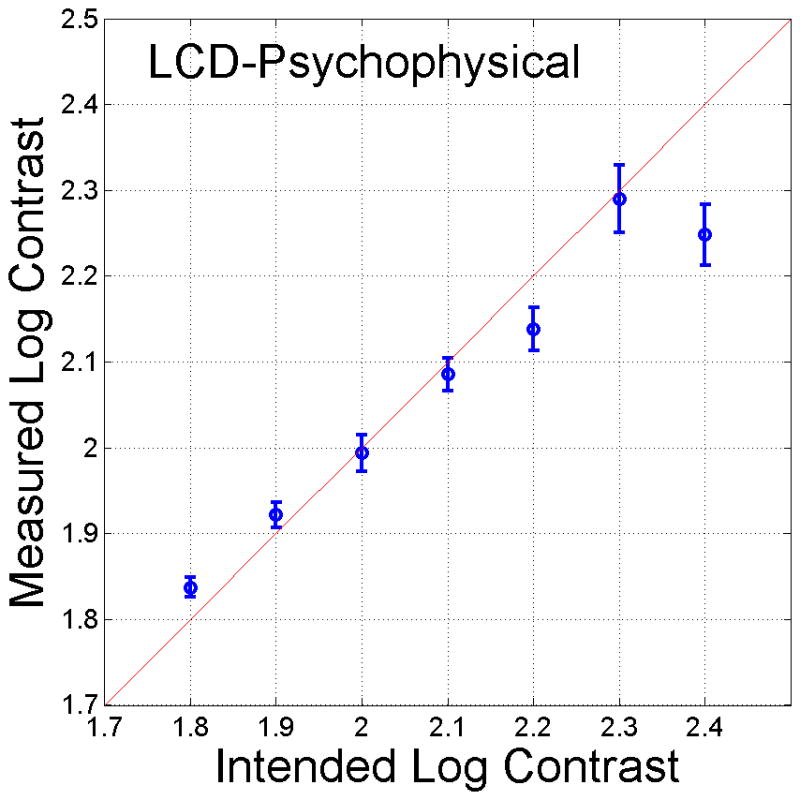
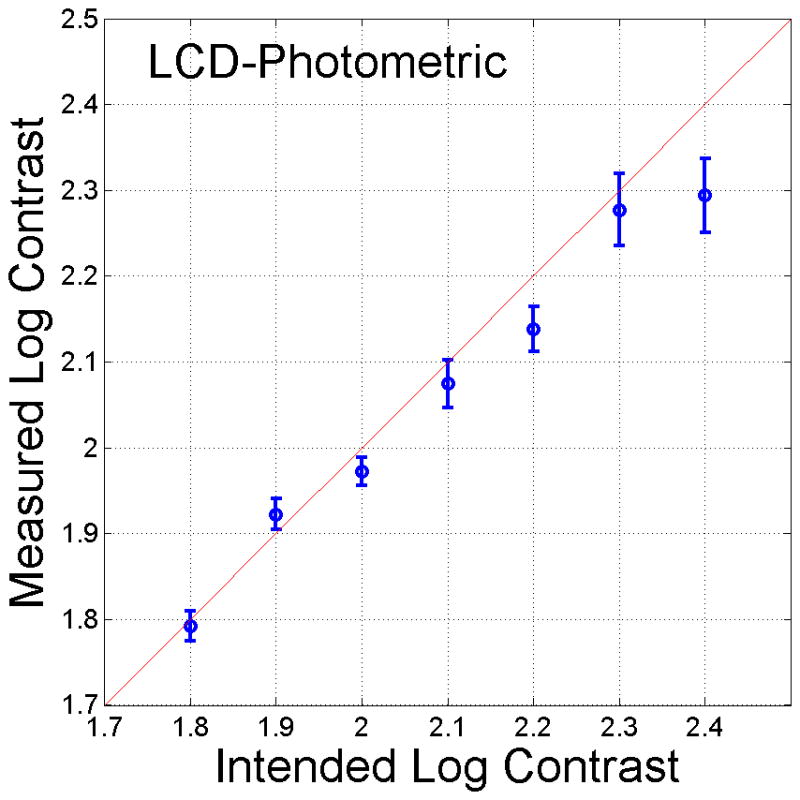
Electronic displays and computer systems offer numerous advantages for clinical vision testing. Laboratory and clinical measurements of various functions and in particular of (letter) contrast sensitivity require accurately calibrated display contrast. In the laboratory this is achieved using expensive light meters. We developed and evaluated a novel method that uses only psychophysical responses of a person with normal vision to calibrate the luminance contrast of displays for experimental and clinical applications. Our method combines psychophysical techniques (1) for detection (and thus elimination or reduction) of display saturating non-linearities; (2) for luminance (gamma function) estimation and linearization without use of a photometer; and (3) to measure without a photometer the luminance ratios of the display's three color channels that are used in a bit-stealing procedure to expand the luminance resolution of the display. Using a photometer we verified that the calibration achieved with this procedure is accurate for both LCD and CRT displays enabling testing of letter contrast sensitivity to 0.5%. Our visual calibration procedure enables clinical, internet and home implementation and calibration verification of electronic contrast testing.

Keywords: CRT; Contrast; Display calibration; LCD; Linearization; Luminance.


Figures

Figure 1
Figure 1
(A). Luminance output of a LCD monitor where only one channel (blue) was saturated. The grayscale luminance (black) appears to be most “noisy” in the region of saturated-blue, but did not saturate itself. The data consists of one measurement at each pixel value for each color. The noise in the gray signal is photometer measurement noise and is the reason that we programmed the photometer-based procedure to take 10 samples at each RGB level. This figure is meant to illustrate saturation non-linearity and these data were not used to estimate gamma. (B) Pattern for detecting and removing saturating non-linearity at high pixel values. Square patches of decreasing contrast against the bright background to detect saturation in grayscale and individual color channels. To remove saturating non-linearity, an observer adjusted the manual controls of the display device until all eight patches in each zone were visible, and the rightmost patch was just visible against the background. A similar stimulus was used for cut-off testing at low pixel values.
Figure 1
Figure 1
(A). Luminance output of a LCD monitor where only one channel (blue) was saturated. The grayscale luminance (black) appears to be most “noisy” in the region of saturated-blue, but did not saturate itself. The data consists of one measurement at each pixel value for each color. The noise in the gray signal is photometer measurement noise and is the reason that we programmed the photometer-based procedure to take 10 samples at each RGB level. This figure is meant to illustrate saturation non-linearity and these data were not used to estimate gamma. (B) Pattern for detecting and removing saturating non-linearity at high pixel values. Square patches of decreasing contrast against the bright background to detect saturation in grayscale and individual color channels. To remove saturating non-linearity, an observer adjusted the manual controls of the display device until all eight patches in each zone were visible, and the rightmost patch was just visible against the background. A similar stimulus was used for cut-off testing at low pixel values.
Figure 2
Figure 2
Abutting square patches for the gray level matching task. The reference patch (left) has alternating lines of two preset luminance values The calibration patch (right, in this example) was solidly filled with a single gray level and its brightness was adjusted by the observer, until the perceived brightness is as close as possible to the reference patch. Note that printed or displayed version of this figure may be distorted due to sub-sampling of the alternating lines of the reference patch.
Figure 3
Figure 3
Comparison between CRT gamma values estimated using the psychophysical method (A) and from a photometer-based measurement (B) (left axis scale). Residuals are shown as filled black circles and relate to the right axis scale. Note the non-zero luminance measured with photometer at grey value=0.
Figure 3
Figure 3
Comparison between CRT gamma values estimated using the psychophysical method (A) and from a photometer-based measurement (B) (left axis scale). Residuals are shown as filled black circles and relate to the right axis scale. Note the non-zero luminance measured with photometer at grey value=0.
Figure 4
Figure 4
The four-frame sequence used in the Green/Red equi-luminance matching task. In frames 1 and 3, the Red bar remains constant and the green bar is adjusted according to the observer response. The sequence shown here with the green brighter than red will result in image motion to the left. Note that all bars in this figure are uniform (i.e. one color). On some displays and printers, the 2nd and 4th frames may show sampling/aliasing artifacts.
Figure 5
Figure 5
Relative green/red ratio (A) and relative red/blue ratio (B) for an LCD obtained from 3 experienced observers (filled markers) and 4 initially naïve observers (open symbols) measured repeatedly over a period of weeks. The green-red ratio of that LCD display, measured with the photometer, was 2.43, and the red/blue ratio was 2.78.
Figure 5
Figure 5
Relative green/red ratio (A) and relative red/blue ratio (B) for an LCD obtained from 3 experienced observers (filled markers) and 4 initially naïve observers (open symbols) measured repeatedly over a period of weeks. The green-red ratio of that LCD display, measured with the photometer, was 2.43, and the red/blue ratio was 2.78.
Figure 6
Figure 6
Model of the variability of log contrast values with a range of color ratios. The output log-contrast was modeled with the ratios G/R ∈ (1.5, 6.5) and R/B ∈ (0.8,5.0). An initial lookup table was generated using two fixed ratios G/R=3.5 and R/B=2.0. From the lookup table, RGB values (R=252, G=253, B=252) corresponding to an intended log-contrast of 2.0 (1%) were extracted, and then used to calculate the contrast at each set of hypothetical color ratios in the above ranges. The log-contrast (on the z-axis) varied between 1.90 and 2.04.
Figure 7
Figure 7
Comparison of contrasts achieved using the psychophysical method against its intended values for the lowest contrast values (1.8 to 2.4 log units) of a CRT and an LCD. For contrast below 1.8 log units (not shown), and for all conditions, the intended versus measured values fell exactly on the 45 degree line. Note that the error bars (standard deviations) for the LCD are smaller than the CRT, which suggests that low contrast stimuli presented on an LCD may be more stable than on CRT.
Figure 7
Figure 7
Comparison of contrasts achieved using the psychophysical method against its intended values for the lowest contrast values (1.8 to 2.4 log units) of a CRT and an LCD. For contrast below 1.8 log units (not shown), and for all conditions, the intended versus measured values fell exactly on the 45 degree line. Note that the error bars (standard deviations) for the LCD are smaller than the CRT, which suggests that low contrast stimuli presented on an LCD may be more stable than on CRT.

References

    1. Ahumada A, Scharff L. Lines and dipoles are efficiently detected (abstract) Journal of Vision. 2007;7(9):337.
    1. Anstis SM, Cavanagh P. A minimum motion technique for judging equiluminance. In: Mollon JD, Sharpe LT, editors. Color Vision: Psychophysics and Physiology. London: Academic Press; 1983. pp. 66–77.
    1. Arditi A. Improving the design of the letter contrast sensitivity test. Investigative Ophthalmology and Visual Science. 2005;46(6):2225–2229. - PubMed
    1. Badano A, Gallas BD, Myers KJ, Burgess AE. Effect of viewing angle on visual detection in liquid crystal displays. Proceedings of SPIE, Medical Imaging 2003: Visualization, Image-Guided Procedures, and Display; Bellingham, WA. 2003. pp. 474–483.
    1. Besuijen J. Visual gamma measurement and methods to compare gamma models. Journal of the Society for Information Display. 2007;15(8):611–623.

Publication types