. 2013 Aug 9;336(1):185-95.
doi: 10.1016/j.canlet.2013.04.027. Epub 2013 May 2.

OXER1, a G protein-coupled oxoeicosatetraenoid receptor, mediates the survival-promoting effects of arachidonate 5-lipoxygenase in prostate cancer cells

Affiliations

OXER1, a G protein-coupled oxoeicosatetraenoid receptor, mediates the survival-promoting effects of arachidonate 5-lipoxygenase in prostate cancer cells

Sivalokanathan Sarveswaran et al. Cancer Lett. .

Abstract

Inhibition of 5-Lox induces apoptosis in prostate cancer cells by inactivating PKCε which is prevented by 5-oxoETE, and activators of PKCε prevent 5-Lox inhibition-induced apoptosis, suggesting that 5-Lox metabolites exert survival signaling via PKCε. However, mechanisms by which 5-Lox metabolites activate PKCε are not understood yet. We found that prostate cancer cells express high levels of OXER1, a G protein-coupled 5-oxoETE receptor, which delivers signal by generating diacyl-glycerol through phospholipase C-beta. Interestingly, we found that U73122, an inhibitor of PLC-beta, interrupts the apoptosis-preventing effect of 5-oxoETE, and exogenous diacyl-glycerol effectively prevents 5-Lox inhibition-induced apoptosis, suggesting that 5-oxoETE signals via OXER1 to promote prostate cancer cell survival.


Conflict of interest statement

Conflict of interest: None.

Figures

Fig. 1
Fig. 1
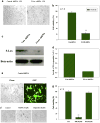
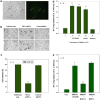
Effect of 5-Lox inhibition on prostate cancer cell survival. In (a–e), LNCaP cells (∼40,000 per well) were plated in 12 well tissue culture plates in complete growth medium and treated with control or 5-Lox shRNA lentiviral particles (cell to virus ratio = 1:20). After 5 days, photographs were taken at ×400 (a), and cell viability was measured by MTS/PES Cell Titer assay (*p < 0.05, n = 4) (b). Expression of 5-Lox was analyzed by Western blot (c). In (d), relative levels of 5-Lox protein is shown by densitometric analysis of bands (AU = arbitrary unit). Transfection efficiency of lentivirus is shown in (e) using GFP-labeled control shRNA plasmids. Note: More than 90% of cells are transfected using lentiviral particles. In (f and g), LNCaP prostate cancer cells (∼30,000 per well) were plated in 24 well tissue culture plates in RPMI medium and treated with MK591 or ibuprofen. Plates were incubated for 24 h at 37 °C in the CO2 incubator and photographs were taken at ×400 (f). Cell viability was measured by MTS/PES Cell Titer assay from Promega (g). Results are presented as mean value of each data point ± standard error (*p < 0.05, n = 4).
Fig. 2
Fig. 2
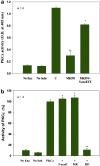
Effects of 5-oxoETE on MK591-induced loss of PKCε activity in prostate cancer cells and on the activity of isolated PKCε in cell-free system. In (a), LNCaP prostate cancer cells (1 × 10⁶ per plate) were plated and allowed to grow for 48 h. Then the cells were treated with MK591 (10 μM) with or without 5-oxoETE (10 μM) for 8 h. Control cells were treated with the vehicle only (0.2% DMSO). At the end of treatment period, cells were lysed and the enzymatic activity of PKCε was determined by IP-kinase assay. In (b), PKCε was first isolated from untreated LNCaP cells and then treated with 5-oxoETE or MK591 (10 μM) for 10 min in the assay buffer. RO-318220 (10 μM), an inhibitor of PKC, was used as positive control. Enzymatic reaction was started by adding substrate to the assay mixture. After 15 min of reaction, enzyme activity was calculated as described in Section 2. Results are presented as mean value of each data point ± standard error (n = 4).
Fig. 3
Fig. 3
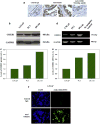
Expression of OXER1 in prostate tumors and prostate cancer cells. In (a), prostate tumor tissue slides were processed and treated with rabbit anti-OXER1 antibody (1:50) and detected by IHC as described in Section 2. Photographs were taken with a Nikon digital camera at ×400. Representative pictures of Gleason 5–7 tumors are shown here (total number of tumors analyzed = 5; all positive). Note: Intermediate grade tumors with multilayered epithelium and intra-lacunar intrusion are visible. A non-specific rabbit IgG was used as negative control. The specificity of OXER1 antibody was confirmed by mixing with 50-fold excess of the peptide against which the antibody was generated. In (b), LNCaP, PC3 and DU145 prostate cancer cells (1 × 10⁶) were plated in 100 mm diameter plates and allowed to grow for 48 h. Then the cells were lysed in lysis buffer and cell lysate proteins (∼100 μg per lane) were separated in 12% SDS–PAGE to detect expression of OXER1 by Western blot. (c) Shows relative expression of OXER1 protein (normalized to GAPDH) by densitometry. In (d), expression of OXER1 mRNA in prostate cancer cells was detected by RT-PCR using gene-specific primer sets as described in Section 2. Relative expression of OXER1 mRNA (normalized to GAPDH) is shown in (e) by densitometric analysis. Surface localization of OXER1 in prostate cancer cells. LNCaP (f), and PC3 (g), cells were fixed in 4% paraformaldehyde in PBS, washed in PBS, and treated with anti-OXER1 antibody (1:50) for 1 h at RT with gentle shaking. Non-specific rabbit IgG (1:50) was used as negative control. After washing cells were treated with secondary FITC-labeled anti-rabbit IgG and observed under a fluorescence microscope. Photographs were taken with a Nikon digital camera attached to a Leica fluorescence microscope at ×400. Arrows in the enlarged plate indicate localization of OXER1 at the boundary of cells. In (h), PC3 cells were stained as in (g) and analyzed by a Zeiss LASER-confocal microscope to show different planes at 1 micron increment from the bottom. On the right, an enlarged view of plate #4 (at a plane of 4 μm up from the bottom) is presented showing surface localization of OXER1.
Fig. 3
Fig. 3
Expression of OXER1 in prostate tumors and prostate cancer cells. In (a), prostate tumor tissue slides were processed and treated with rabbit anti-OXER1 antibody (1:50) and detected by IHC as described in Section 2. Photographs were taken with a Nikon digital camera at ×400. Representative pictures of Gleason 5–7 tumors are shown here (total number of tumors analyzed = 5; all positive). Note: Intermediate grade tumors with multilayered epithelium and intra-lacunar intrusion are visible. A non-specific rabbit IgG was used as negative control. The specificity of OXER1 antibody was confirmed by mixing with 50-fold excess of the peptide against which the antibody was generated. In (b), LNCaP, PC3 and DU145 prostate cancer cells (1 × 10⁶) were plated in 100 mm diameter plates and allowed to grow for 48 h. Then the cells were lysed in lysis buffer and cell lysate proteins (∼100 μg per lane) were separated in 12% SDS–PAGE to detect expression of OXER1 by Western blot. (c) Shows relative expression of OXER1 protein (normalized to GAPDH) by densitometry. In (d), expression of OXER1 mRNA in prostate cancer cells was detected by RT-PCR using gene-specific primer sets as described in Section 2. Relative expression of OXER1 mRNA (normalized to GAPDH) is shown in (e) by densitometric analysis. Surface localization of OXER1 in prostate cancer cells. LNCaP (f), and PC3 (g), cells were fixed in 4% paraformaldehyde in PBS, washed in PBS, and treated with anti-OXER1 antibody (1:50) for 1 h at RT with gentle shaking. Non-specific rabbit IgG (1:50) was used as negative control. After washing cells were treated with secondary FITC-labeled anti-rabbit IgG and observed under a fluorescence microscope. Photographs were taken with a Nikon digital camera attached to a Leica fluorescence microscope at ×400. Arrows in the enlarged plate indicate localization of OXER1 at the boundary of cells. In (h), PC3 cells were stained as in (g) and analyzed by a Zeiss LASER-confocal microscope to show different planes at 1 micron increment from the bottom. On the right, an enlarged view of plate #4 (at a plane of 4 μm up from the bottom) is presented showing surface localization of OXER1.
Fig. 4
Fig. 4
Effect of U73122 on the prevention of MK591-induced apoptosis by 5-oxoETE. In (a), cells were plated as in Fig. 1, pre-treated for 30 min with U73122 (20 μM), and then treated with 10 μM MK591 with or without 10 μM 5-oxoETE for 16 h. Control cells were treated with the vehicle only (0.2% DMSO). At the end of incubation period, apoptosis was measured by cell death ELISA. Results represent mean values of each data point ± standard error (n = 4). In (b), cells were pre-treated with varying doses of 1,2-dioleoyl-sn-glycerol for 30 min and then treated with 10 μM MK591 for 16 h. Apoptosis was measured by ELISA. In (c), cells were treated with varying doses of U73122 for 16 h and then the apoptosis was measured by ELISA. In (d), cells were pre-treated with varying doses of 1,2-dioleoyl-sn-glycerol for 30 min and then treated with U73122 (40 μM) for 16 h. After incubation, apoptosis was measured by ELISA. Results are presented as mean value of each data point ± standard error (n = 4).
Fig. 5
Fig. 5
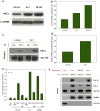
Expression and enzymatic activity of PKCε in cultured prostate cancer cells. LNCaP, PC3 and DU145 prostate cancer cells (1 × 10⁶) were plated in 100 mm diameter plates and allowed to grow for 48 h. Then the cells were washed and lysed in lysis buffer. In (a), cell lysate proteins (100 μg per lane) were separated in 12% SDS–PAGE and expression of PKCε was detected by Western blot. In (c), PKCε was immunoprecipitated from whole cell lysates (500 μg protein per sample) using 2 μg/ml anti-PKCε antibody (or control rabbit IgG antibody) and then detected by Western blot. Relative levels of PKCε protein in IP was measured by densitometry and normalized to IgG heavy chains (H) which is detected in all rabbit antibodies (d). In (e), kinase activity of PKCε was measured by IP-kinase assay as described in Section 2. No Enz (=no enzyme added) and No Subs (=no peptide substrate added) were used as negative controls, and a recombinant human PKCε (20 ng per assay) was used in parallel as positive control. Activity of PKCε was confirmed using 40 μM of the specific peptide inhibitor KIE1–1. Results are shown as mean value ± standard error (n = 4). In(f), cells were treated either with vehicle only (Con), or 10 μM MK591, or 10 μM Ibuprofen for 16 h and whole cell lysates were made. Then, OXER1 proteins were immunoprecipitated from cell lysates (equivalent to 800 μg of proteins in each sample) using 2 μg/ml rabbit anti-OXER1 antibody and analyzed by Western blot. A rabbit anti-survivin antibody (2 μg/ml) was used in parallel to make control IP. Note: IgG heavy chains (H) are detected in both anti-OXER1 and anti-survivin rabbit antibodies.
Fig. 6
Fig. 6
Effects of inhibitors and activators of PKCε on prostate cancer cell survival. In (a), PC3 cells were plated overnight and transfected with a dominant-negative PKCε-GFP construct. At 72 h post-transfection the cells were photographed under a fluorescence microscope at ×400. Note: Only cells over-expressing d/n-PKCε (arrows) are affected. In (b) and (c), LNCaP cells were treated with a lentiviral construct against PKCε shRNA or control shRNA and incubated at 37 °C for 4 days. At the end of incubation period, cells were photographed under a microscope at ×400 (b). Cell viability was measured by MTS/PES Cell Titer assay (c). In (d), cells were treated with a PKC chemical inhibitor (RO-318220) as indicated and apoptosis was measured by histone-ELISA. MK591 and Ibuprofen were used as positive and negative controls respectively. Results represent mean values of each data point ± standard error (n = 4). In (e), LNCaP cells (3 × 10⁵) were plated in 60 mm diameter plates and allowed to grow for 48 h. Then the old medium was replaced by 2 ml fresh RPMI medium and the cells were treated with MK591 (10 μM) with or without a peptide activator (KAE1-1) or inhibitor (KIE1-1) of PKCε (10 μM) at 37 °C for 8 h. Control cells were treated with solvent only (0.2% DMSO). At the end of incubation period, apoptosis was measured by cell death ELISA. Data presented as mean ± standard error (n = 4).
Fig. 7
Fig. 7
Proposed model for the regulation of prostate cancer cell survival by 5-Lox. Arachidonic acid is metabolized by 5-Lox to generate 5(S)-HETE which is converted to 5-oxoETE by a dehydrogenase. The ligand (5-oxoETE) binds with the GPCR (OXER1) on the cell surface and activates PLC-beta to generate DAG. DAG in turn activates PKCε and regulates prostate cancer cell survival by preventing apoptosis.

Similar articles

Cited by

References

    1. Jemal A, Siegel R, Xu J, Ward E. Cancer statistics, 2010. CA Cancer J Clin. 2010;60:277–300. - PubMed
    1. Fleshner N, Bagnell PS, Klotz L, Venkateswaran V. Dietary fat and prostate cancer. J Urol. 2004;171:19–24. - PubMed
    1. Kolonel LN, Nomura AN, Cooney RV. Dietary fat and prostate cancer: current status. J Natl Cancer Inst. 1999;91:414–428. - PubMed
    1. Wang Y, Corr JG, Thaler HT, Tao Y, Fair WR, Heston WD. Decreased growth of established prostate LNCaP tumors in nude mice fed a low-fat diet. J Natl Cancer Inst. 1995;87:1456–1462. - PubMed
    1. West DW, Slattery ML, Robison LM, French TK, Mahoney AW. Adult dietary intake and prostate cancer risk in Utah: a case control study with special emphasis on aggressive tumors. Cancer Causes Control. 1991;2:85–94. - PubMed

Publication types

Substances