

Neurovascular factors in resting-state functional MRI
- PMID: 23644003
- PMCID: PMC3746765
- DOI: 10.1016/j.neuroimage.2013.04.071
Neurovascular factors in resting-state functional MRI
Abstract
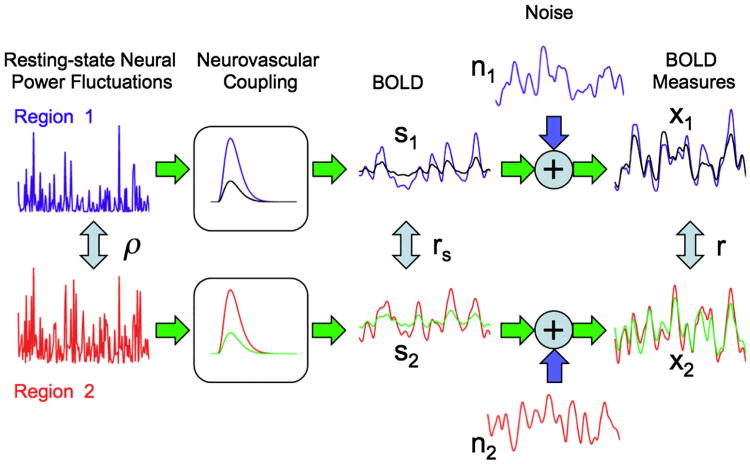
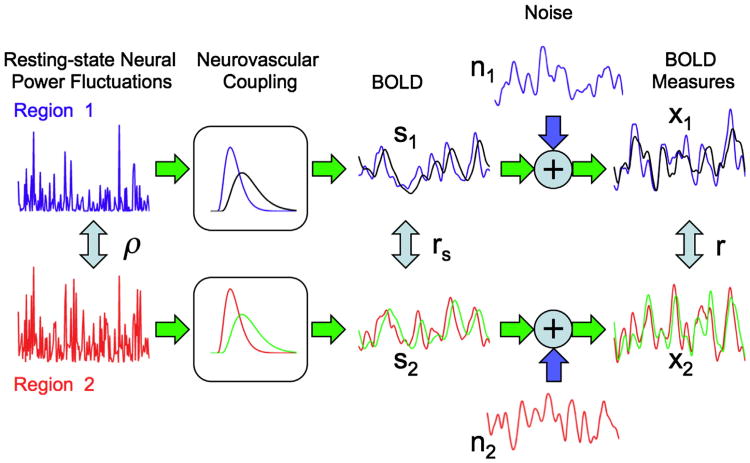
There has been growing interest in the use of resting-state functional magnetic resonance imaging (rsfMRI) for the assessment of disease and treatment, and a number of studies have reported significant disease-related changes in resting-state blood oxygenation level dependent (BOLD) signal amplitude and functional connectivity. rsfMRI is particularly suitable for clinical applications because the approach does not require the patient to perform a task and scans can be obtained in a relatively short amount of time. However, the mechanisms underlying resting-state BOLD activity are not well understood and thus the interpretation of changes in resting state activity is not always straightforward. The BOLD signal represents the hemodynamic response to neural activity, and changes in resting-state activity can reflect a complex combination of neural, vascular, and metabolic factors. This paper examines the role of neurovascular factors in rsfMRI and reviews approaches for the interpretation and analysis of resting state measures in the presence of confounding factors.
Keywords: BOLD; Functional connectivity; Neurovascular coupling; fMRI.
Copyright © 2013 Elsevier Inc. All rights reserved.
Figures
Similar articles
-
Resting-state fMRI confounds and cleanup.Neuroimage. 2013 Oct 15;80:349-59. doi: 10.1016/j.neuroimage.2013.04.001. Epub 2013 Apr 6. Neuroimage. 2013. PMID: 23571418 Free PMC article. Review.
-
Modeling the impact of neurovascular coupling impairments on BOLD-based functional connectivity at rest.Neuroimage. 2020 Sep;218:116871. doi: 10.1016/j.neuroimage.2020.116871. Epub 2020 Apr 23. Neuroimage. 2020. PMID: 32335261
-
Spatial heterogeneity of the relation between resting-state connectivity and blood flow: an important consideration for pharmacological studies.Hum Brain Mapp. 2014 Mar;35(3):929-42. doi: 10.1002/hbm.22224. Epub 2012 Dec 26. Hum Brain Mapp. 2014. PMID: 23281174 Free PMC article. Clinical Trial.
-
Dynamic functional connectivity: promise, issues, and interpretations.Neuroimage. 2013 Oct 15;80:360-78. doi: 10.1016/j.neuroimage.2013.05.079. Epub 2013 May 24. Neuroimage. 2013. PMID: 23707587 Free PMC article. Review.
-
Metabolic and vascular origins of the BOLD effect: Implications for imaging pathology and resting-state brain function.J Magn Reson Imaging. 2015 Aug;42(2):231-46. doi: 10.1002/jmri.24786. Epub 2015 Feb 26. J Magn Reson Imaging. 2015. PMID: 25727523 Review.
Cited by
-
Imaging the response to deep brain stimulation in rodent using functional ultrasound.Phys Med Biol. 2021 Feb 25;66(5):05LT01. doi: 10.1088/1361-6560/abdee5. Phys Med Biol. 2021. PMID: 33482648 Free PMC article.
-
Imaging and Anesthesia Protocol Optimization in Sedated Clinical Resting-State fMRI.AJNR Am J Neuroradiol. 2025 Feb 3;46(2):293-301. doi: 10.3174/ajnr.A8438. AJNR Am J Neuroradiol. 2025. PMID: 39134370
-
Human connectomics - what will the future demand?Neuroimage. 2013 Oct 15;80:541-4. doi: 10.1016/j.neuroimage.2013.05.082. Epub 2013 May 29. Neuroimage. 2013. PMID: 23727322 Free PMC article. Review.
-
Transcranial focused ultrasound stimulation of human primary visual cortex.Sci Rep. 2016 Sep 23;6:34026. doi: 10.1038/srep34026. Sci Rep. 2016. PMID: 27658372 Free PMC article.
-
Contributions of structural connectivity and cerebrovascular parameters to functional magnetic resonance imaging signals in mice at rest and during sensory paw stimulation.J Cereb Blood Flow Metab. 2017 Jul;37(7):2368-2382. doi: 10.1177/0271678X16666292. Epub 2016 Jan 1. J Cereb Blood Flow Metab. 2017. PMID: 27596833 Free PMC article.
References
-
- Allen G, Barnard H, McColl R, Hester AL, Fields JA, Weiner MF, Ringe WK, Lipton AM, Brooker M, McDonald E, Rubin CD, Cullum CM. Reduced hippocampal functional connectivity in Alzheimer disease. Arch Neurol. 2007;64:1482–1487. - PubMed
-
- Barry RJ, Clarke AR, Johnstone SJ, Rushby JA. Timing of caffeine's impact on autonomic and central nervous system measures: clarification of arousal effects. Biol Psychol. 2008;77:304–316. - PubMed
-
- Behzadi Y, Liu TT. An arteriolar compliance model of the cerebral blood flow response to neural stimulus. Neuroimage. 2005;25:1100–1111. - PubMed
-
- Birn RM, Diamond JB, Smith MA, Bandettini PA. Separating respiratory- variation-related fluctuations from neuronal-activity-related fluctuations in fMRI. Neuroimage. 2006;31:1536–1548. - PubMed
-
- Biswal B, Hudetz AG, Yetkin FZ, Haughton VM, Hyde JS. Hypercapnia reversibly suppresses low-frequency fluctuations in the human motor cortex during rest using echo-planar MRI. J Cereb Blood Flow Metab. 1997;17:301–308. - PubMed
Publication types
MeSH terms
Substances
Grants and funding
LinkOut - more resources
Full Text Sources
Other Literature Sources
Medical
