. 2013 Jun;45(6):656-63.
doi: 10.1038/ng.2625. Epub 2013 May 5.

Population genomics of post-vaccine changes in pneumococcal epidemiology

Affiliations

Population genomics of post-vaccine changes in pneumococcal epidemiology

Nicholas J Croucher et al. Nat Genet. 2013 Jun.

Abstract

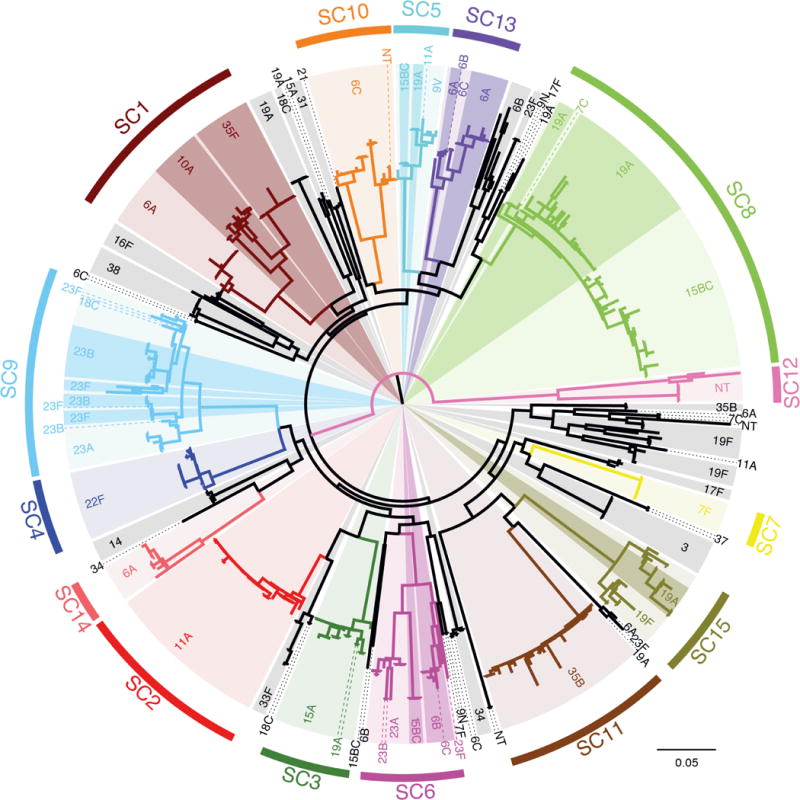
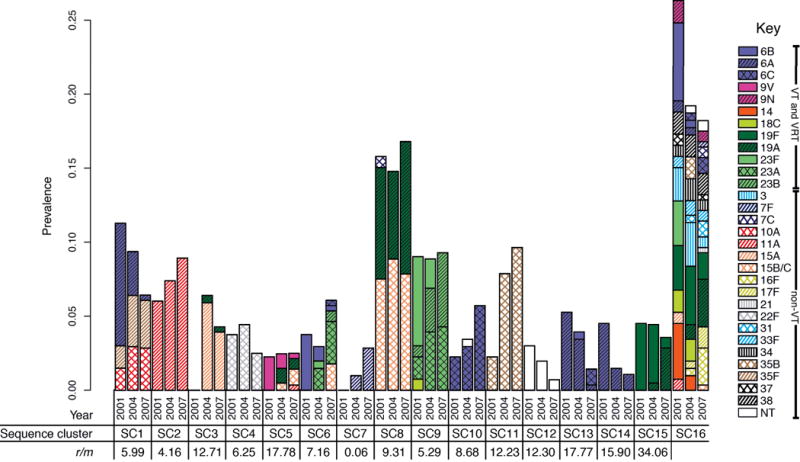
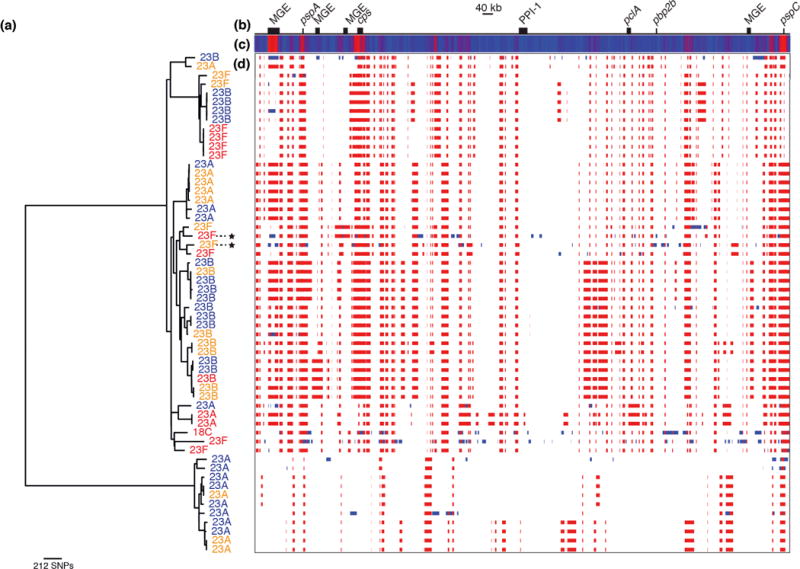
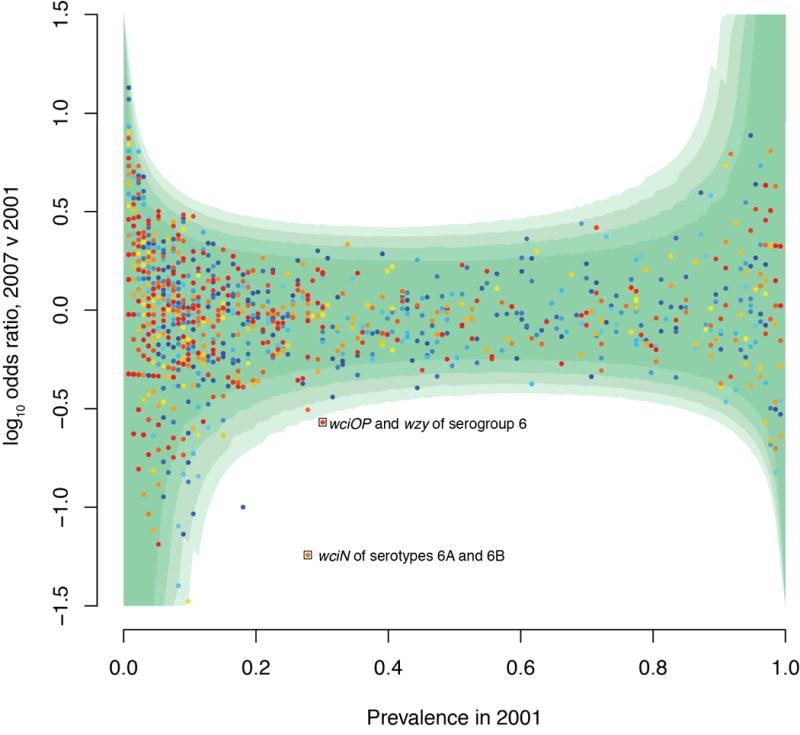
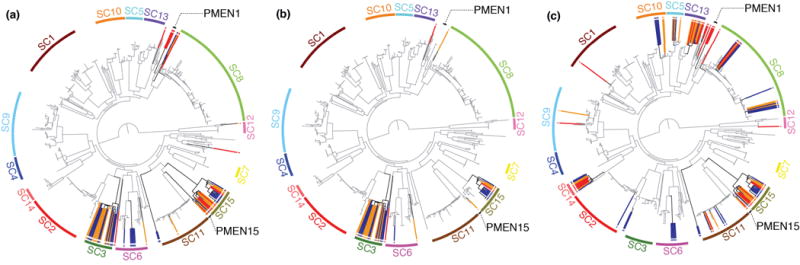
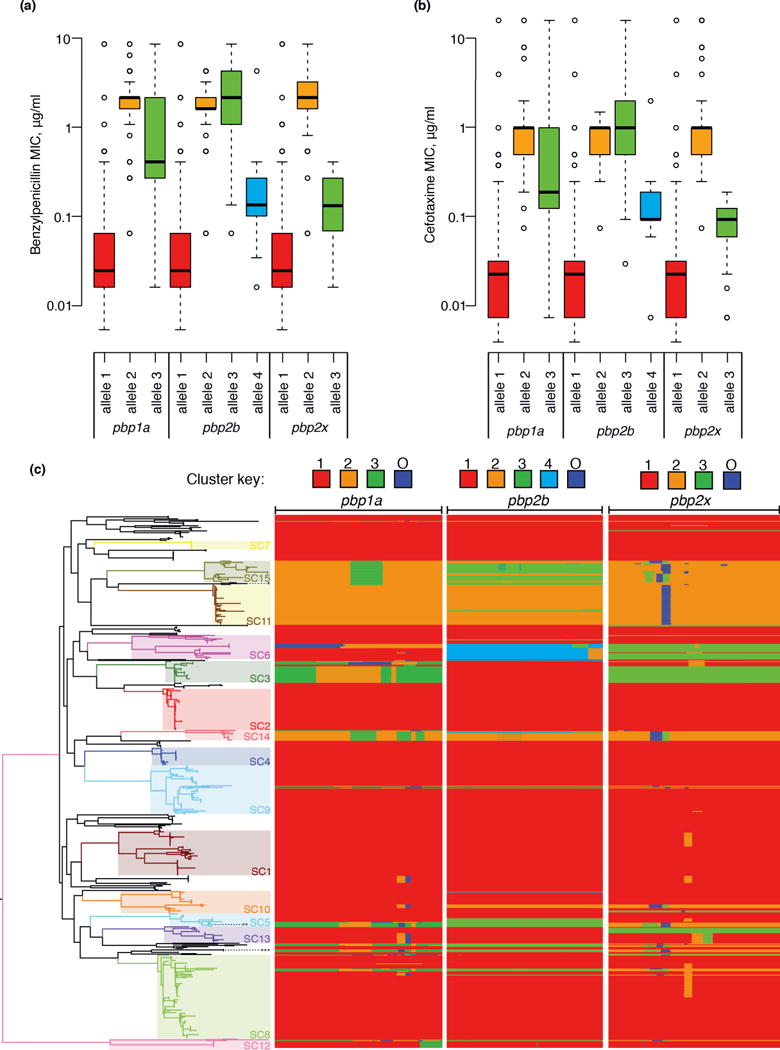
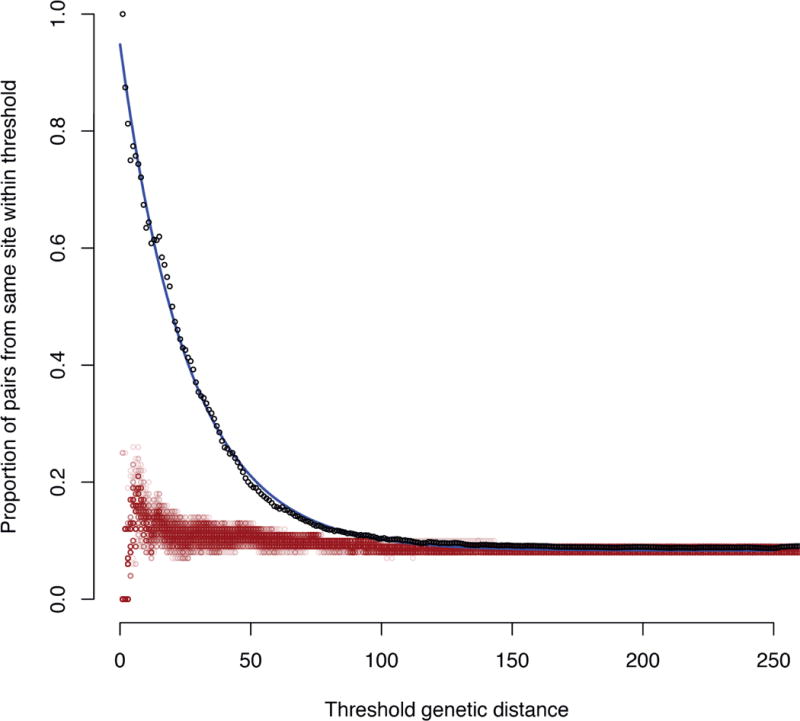
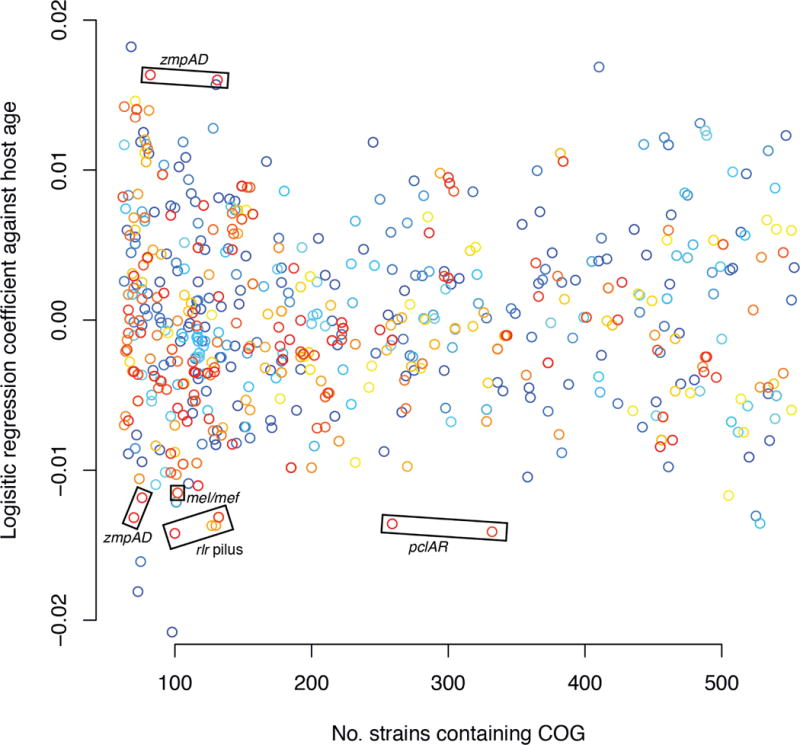
Whole-genome sequencing of 616 asymptomatically carried Streptococcus pneumoniae isolates was used to study the impact of the 7-valent pneumococcal conjugate vaccine. Comparison of closely related isolates showed the role of transformation in facilitating capsule switching to non-vaccine serotypes and the emergence of drug resistance. However, such recombination was found to occur at significantly different rates across the species, and the evolution of the population was primarily driven by changes in the frequency of distinct genotypes extant before the introduction of the vaccine. These alterations resulted in little overall effect on accessory genome composition at the population level, contrasting with the decrease in pneumococcal disease rates after the vaccine's introduction.


Figures

Figure 1
Figure 1
Structure of the pneumococcal population. The maximum likelihood phylogeny was generated using 106,196 polymorphic sites within a 1.14 Mb codon alignment of 1,194 ‘core’ COGs. The coloring of this phylogeny represents the sequence clusters (SCs) defined using the same alignment: fifteen monophyletic sequence clusters are labeled, with the terminal branches of the tree colored black indicating taxa that constitute a sixteenth polyphyletic group. Within the monophyletic sequence clusters, light background shading indicates one particular serotype, with darker shading and dashed lines used to indicate groups of isolates of alternative serotypes.
Figure 2
Figure 2
Dynamics of the carried pneumococcal population. The proportion of the population constituted by each of the sequence clusters in the three collection periods is plotted as adjacent bars. Each bar is split according to the serotype composition of the sequence cluster in each year; VT capsule types are represented by solid fill, VRT are represented by solid fill (of the color of the VT of the same serogroup) overlaid with black hatching and non-VT are represented by colored hatched patterns on a white background. Underneath the chart, the per site r/m statistic for the fifteen monophyletic clades is displayed, as calculated from the analyses displayed in Supplementary Figure 5–Supplementary Figure 19.
Figure 3
Figure 3
Serotype dynamics of SC9. (a) Maximum likelihood phylogeny of SC9 based on point mutations, excluding polymorphisms introduced through the horizontal import of sequence. Taxa are labeled with their serotype: all have a serogroup 23 capsule, with the exception of a single serotype 18C isolate. The taxa are colored according to their year of isolation: red taxa are from 2001, orange taxa were isolated in 2004, and blue indicates isolates from 2007. Two taxa that developed high-level beta lactam resistance are marked with stars. The right side of the figure shows the putative recombination events detected acrss the genome alignment. (b) A simplified annotation of the SC9 reference genome. (c) A heatmap showing the density of recombination events across the genome, with blue indicating regions undergoing few, or no, recombinations, while red indicates loci undergoing high rates of recombination. The highest levels are observed at a putative mobile genetic element (MGE), in the regions encoding the protein antigens PspA and PspC, and at the capsule biosynthesis cluster (cps). (d) This panel displays the position of the putative recombination events relative to the genome annotation, with a row for each taxon in the tree. Each detected recombination event is indicated by a red block, if reconstructed as occurring on an internal branch and therefore shared by multiple taxa through common descent, or blue block, if occurring on a terminal branch and therefore unique to a single taxon.
Figure 4
Figure 4
Alteration in COG frequency between 2001 and 2007. The logarithm of the odds ratio indicating the proportion of isolates carrying each COG in 2007 relative to 2001 is displayed relative to the prevalence of the COG in 2001. Points are colored according to the mean length of the member proteins, ranging from red (for longer sequences) to blue (for shorter sequences). The four contours of green shading indicate the positions of the critical values for significance at confidence intervals of 99.999%, 99.99%, 99.9% and 99% with increasing intensity. The two labelled points lying outside all these confidence intervals are involved in synthesis of the serogroup 6 capsules; the other, blue, point is a false positive that appears to have been introduced through differences in the assembly of data from 2001 (75 nt reads) and 2007 (100 nt reads).
Figure 5
Figure 5
Distribution of antibiotic resistance genes. The maximum likelihood phylogeny, annotated as displayed in Figure 1, is emboldened where resistance genes are present and lightly shaded where they are absent. Taxa containing the resistance genes are linked to a colored point at the edge of the tree by a radiating line that is red for isolates from 2001, orange for isolates from 2004, and blue for isolates from 2007. In addition to the sequence clusters, the multidrug-resistant PMEN1 and PMEN15 lineages are labeled. (a) shows the distribution of the tetM tetracycline resistance gene. (b) shows the distribution of the ermB macrolide resistance gene. (c) shows the distribution of the mef gene.
Figure 6
Figure 6
Changes in beta lactam resistance. (a) Resistance to benzylpenicillin. Each of the three penicillin binding protein genes involved in resistance was independently clustered on the basis of sequence similarity using nextgenBRAT; this identified three alleles for pbp1a and pbp2x and four alleles for pbp2b. Box and whisker plots display the distribution of benzylpenicillin MICs associated with strains possessing each of these alleles. (b) Box and whisker plot equivalent to panel (a), but showing MICs to the cephalosporin cefotaxime. (c) Distribution of pbp alleles throughout the pneumococcal population. The phylogeny displayed in Figure 1 is shown on the left, with the multidrug-resistant lineages PMEN1 (***), PMEN3 (**) and PMEN15 (*) labeled with asterisks. The three columns on the right represent the independent analyses for the three pbp genes involved in beta lactam resistance. These are comprised of one row for each taxon in the tree, with the width of the column representing the length of the gene. Blocks are colored according to the group to which the sequence belongs, as indicated by the key at the top of the column; changes of color indicate recombination breakpoints characteristic of mosaic genes. The ‘O’ group represents sequence that comes from an ‘outgroup’; that is, from a strain or species not represented within the collection.
Figure 7
Figure 7
Geographic structure within the population. The pairwise genetic distance, equating to a separation in terms of point mutations, between all strains within the same monophyletic sequence cluster were calculated and combined into a single dataset. For a series of maximum genetic distance thresholds, the proportion of all pairwise comparisons meeting the condition that both isolates originated within the same location was calculated. These are plotted as the black points, which appear to fit an approximately exponential decay, indicated by the blue line. The red points represent the outcome of one hundred permutations whereby the same statistic was calculated when the locations of the isolates were randomized.
Figure 8
Figure 8
Effect of host age on pneumococcal genotype. A logistic regression coefficient of each COG against the host child’s age, in months, was calculated. Terms relating to year of isolation were included in the regression to account for differences in age distributions between samples, and children under six months of age were excluded to avoid the confounding effects of maternal immunity. The coefficient relating to host age is plotted against the prevalence of the COG within the bacterial population; only those present in between 10% and 90% of the population, suggesting they may be under balancing selection, are displayed. Points are colored according to the mean length of the member proteins, ranging from red (for longer sequences) to blue (for shorter sequences).

References

    1. Weinberger DM, et al. Pneumococcal capsular polysaccharide structure predicts serotype prevalence. PLoS Pathog. 2009;5:e1000476. - PMC - PubMed
    1. Whitney CG, et al. Decline in invasive pneumococcal disease after the introduction of protein-polysaccharide conjugate vaccine. N Engl J Med. 2003;348:1737–46. - PubMed
    1. Steenhoff AP, Shah SS, Ratner AJ, Patil SM, McGowan KL. Emergence of vaccine-related pneumococcal serotypes as a cause of bacteremia. Clin Infect Dis. 2006;42:907–14. - PubMed
    1. Hicks LA, et al. Incidence of pneumococcal disease due to non-pneumococcal conjugate vaccine (PCV7) serotypes in the United States during the era of widespread PCV7 vaccination, 1998–2004. J Infect Dis. 2007;196:1346–54. - PubMed
    1. Pai R, et al. Postvaccine genetic structure of Streptococcus pneumoniae serotype 19A from children in the United States. J Infect Dis. 2005;192:1988–95. - PubMed

Publication types

MeSH terms

Substances