. 2013 Jun;14(6):619-32.
doi: 10.1038/ni.2590. Epub 2013 May 5.

The transcriptional landscape of αβ T cell differentiation

Affiliations

The transcriptional landscape of αβ T cell differentiation

Michael Mingueneau et al. Nat Immunol. 2013 Jun.

Abstract

The differentiation of αβT cells from thymic precursors is a complex process essential for adaptive immunity. Here we exploited the breadth of expression data sets from the Immunological Genome Project to analyze how the differentiation of thymic precursors gives rise to mature T cell transcriptomes. We found that early T cell commitment was driven by unexpectedly gradual changes. In contrast, transit through the CD4(+)CD8(+) stage involved a global shutdown of housekeeping genes that is rare among cells of the immune system and correlated tightly with expression of the transcription factor c-Myc. Selection driven by major histocompatibility complex (MHC) molecules promoted a large-scale transcriptional reactivation. We identified distinct signatures that marked cells destined for positive selection versus apoptotic deletion. Differences in the expression of unexpectedly few genes accompanied commitment to the CD4(+) or CD8(+) lineage, a similarity that carried through to peripheral T cells and their activation, demonstrated by mass cytometry phosphoproteomics. The transcripts newly identified as encoding candidate mediators of key transitions help define the 'known unknowns' of thymocyte differentiation.


Figures
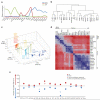
Figure 1
Figure 1
Bird’s-eye view of transcriptome changes in the course of T cell differentiation. (a) Maximum-normalized mean expression values for Rag1, Tcra and Kit in indicated BM and thymocyte populations. (b) Hierarchical clustering, (c) Principal Component Analysis and (d) heatmap of Euclidian distances between indicated populations, calculated using the 15% of probes with the greatest difference in expression among these subsets and with expression values over 120 for at least one of the subsets. Expression values were log2-transformed and row-standardized prior to the analysis. (e) Number of probes upregulated (red symbols) or downregulated (blue symbols) by 2-fold or more at the indicated transitions during T cell differentiation. Filled symbols, total number of probes; open symbols, number of probes which are not part of the proliferation signature.
Figure 2
Figure 2
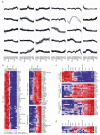
Dynamics of gene expression during early T cell differentiation. K-means clusters of genes showing differential expression during early T cell differentiation. (a) Log2-transformed mean-centered expression values for the genes (black lines) and cluster centroids (grey line) for each cluster. Clusters are named by a characteristic gene or group of genes in the cluster. The complete list of genes in each cluster is provided in Supplementary Table 2. (b) Heatmaps showing expression levels of genes from PU.1 (left), TCF-1/LEF-1 (top right), and CD4/CD8 (bottom right) clusters. (c) Heatmaps showing expression levels of transcriptional regulators from indicated clusters. (d) Heatmap showing expression levels of diacylglycerol kinase genes whose expression changed by 3-fold or more during early T cell differentiation.
Figure 3
Figure 3
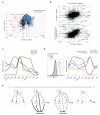
Transcriptional footprint of β-selection. (a) Volcano plot comparing DN3b and DN3a thymocyte stages (Fold Change: x axis; t test p-value: y axis). Probes corresponding to the proliferation signature (see Methods section for definition) and components of NOTCH signaling pathway are highlighted in blue and red, respectively. (b) Fold change/FC plots comparing transcriptome changes induced by preTCR signaling in DN thymocytes (DN3b vs DN3a, x-axis) versus αβTCR signaling in DP thymocytes (top, CD69+ DP (DP69+) versus small DP (DPsm), y-axis) and in peripheral T cells (bottom, OT1 TCR transgenic cells, 24 hours after Listeria-OVA infection vs naïve OT1 cells). Blue lines mark a FC of 2. (c) Maximum-normalized mean expression of Notch1 and indicated NOTCH target genes in thymocyte subsets. (d) Histogram showing expression levels of MYC, detected by flow cytometry (left) and maximum-normalized mRNA levels of Myc and negative regulators of MYC in the indicated thymocyte populations (right). MYC protein levels are indicated with a dashed line for comparison. Flow cytometry analysis of MYC expression is representative of 3 independent experiments. (e) Schematic of the proposed model describing the interplay between the preTCR, NOTCH1, IL-7R and MYC in T cell physiology during early T cell differentiation.
Figure 4
Figure 4
Transcriptional shutdown in small DP thymocytes. (a) Heatmaps showing normalized expression values for probes belonging to the GO categories for: ribosome and translation (GO:0005840 and 0006412) (top); mitochondrion (GO:0005739) (middle); and cell cycle (GO:0007049) (bottom) across BM progenitor, B cell, myeloid and T cell subsets. Probes are sorted by increasing value in small DP (DPsm). (b) Scatter plot showing ‘proliferation’ and ‘translation’ indexes calculated by averaging row maximum-normalized expression values for each probe in the proliferation signature (‘proliferation’ index) or translation and ribosome categories (‘translation’ index), for the same set of cell populations shown in (a). (c) Pyronin Y quantification of total RNA content in thymocytes. Histogram overlay (top) and mean fluorescence intensity (bottom) in indicated thymocyte subsets. (d) Analysis of transcriptional activity via eU incorporation. Total thymocytes were incubated for 2 hrs in presence of eU nucleotide, followed by flow cytometric detection of incorporated eU by click chemistry. Representative eU saining histograms (left) and corresponding mean fluorescence intensity (right) in indicated thymocyte subsets. Panels (c) and (d) are representative of two independent experiments.
Figure 5
Figure 5
Reactivation of housekeeping activities upon positive selection. (a) Volcano plot comparing CD69+ DP (DP69+) and small DP (DPsm) thymocytes (Fold Change: x axis; t test p-value: y axis). Signature genes upregulated (violet) and downregulated (cyan) at early time points following in vitro TCR stimulation of DP thymocytes are highlighted. Signature genes were derived from the previously described transcriptome analysis of BDC2.5 TCR transgenic DP thymocytes , and include all genes induced or repressed (FC threshold of 2) at 3 h or 7 h post-stimulation with mimotope-pulsed splenic APCs. The number of signature genes in the upregulated and downregulated transcriptome, are indicated. Immediate early response genes (orange) were derived from the transcriptome analysis of a PDGF-stimulated cell line . (b) Gene probes remaining after subtraction of TCR-stimulated DP signature genes (highlighted in (a)). Transcriptional regulators upregulated (violet) and downregulated (cyan) are highlighted (using a list of 1,680 known or putative transcriptional regulators, provided in Supplementary Table 4). (c) Relative expression of MHC class I on indicated thymocyte subsets, detected by flow cytometry with anti-H2-Kb (green) and H2-Db (blue) antibodies in Nlrc5-sufficient (solid lines), and Nlrc5-deficient mice (dashed lines). (d) Maximum-normalized mean expression of 8 metabolism-related transcripts regulated at the small DP to CD69+ DP transition, whose gene-products control key steps of the glycolytic and tricarboxylic acid cycle pathways. The schematic diagram displays the function of each of the corresponding enzymes along the glycolytic and tricarboxylic acid cycle pathways. Abbreviations: Glu=glucose; P=phosphate; G=glycerate; Pyr=pyruvate; PDH=pyruvate dehydrogenase; HK=hexokinase (e) Maximum-normalized expression of 20 ribosome and translation-related transcripts regulated at the small DP to CD69+ DP transition. The following genes encode the structural ribosomal proteins: Rpl3, Rpl37, Rpl38, Rpl39, Rplp1, Rps12, Rps20, Rps25, Rps28, Rps29, Rrp15, Rpsa.
Figure 6
Figure 6
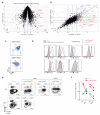
Transcriptional and functional footprints of clonal deletion in CD69+ DP thymocytes. (a) Volcano plot comparing CD69+ DP (DP69+) and small DP (DPsm) thymocytes (Fold Change: x axis; t test p-value: y axis). Genes which have been reproducibly associated with negative selection in TCR transgenic models are highlighted in red. (b) Fold change/FC plot showing transcriptome changes induced in CD69+ DP (DP69+) (x-axis) and intermediate (CD4+CD8int) thymocytes, relative to small DP (DPsm). Blue lines mark a FC >2. Genes induced by >2-fold in CD69+ DP thymocytes and showing higher (violet), similar (gray), or, lower (red) upregulation in intermediate thymocytes are highlighted. (c) Expression of CD4 and CD8 on CD69negMHCIneg (top) or CD69hiMHCIneg (bottom) thymocytes (see gating strategy in Supplementary Fig. 7). The frequencies of cells falling within each gate are indicated. (d) Cell surface expression of PD-1, IL-7R, CD5, TCRβ, and intracellular expression of IKZF2 (HELIOS), NR4A1, BCL2 on indicated subpopulations (see key). Panels (c-d) are representative of three independent experiments. (e) Intracellular expression of the activated, cleaved form of Caspase-3 (Act-Casp.3) and CD69 on subpopulations defined in panels (c-d), from WT and b2m−/−.Iab−/− (Mhc−/−) mice. (f) Proportion of activated Caspase-3+ cells within the indicated thymocyte subpopulations from b2m−/−.Iab−/− (Mhc−/−), Bcl2l11−/− mice (Bim−/−) and wild-type (WT) mice. Each pair of mice corresponds to one experiment.
Figure 7
Figure 7
Acquisition of CD4 and CD8 transcriptional identities during thymocyte differentiation. (a) Fold change/FC plot showing transcriptome changes induced in mature CD4SP (4SP24) (x-axis) and mature CD8SP (8SP24) thymocytes (y-axis), relative to small DP (DPsm). Blue lines mark a FC of 2. Genes showing similar (gray) or preferential upregulation during CD4SP (red) or CD8SP (blue) differentiation are highlighted (FC threshold of 2, with the corresponding number of genes indicated). (b) Same as (a), filtered using a list of 1,680 known or putative transcriptional regulators (provided in Supplementary Table 4).
Figure 8
Figure 8
Definition of CD4 and CD8 transcriptional identities. (a) Fold change/FC plot showing transcriptome changes induced in lymph node CD4 (x-axis) and CD8 T cells (y-axis), relative to their respective thymic parental populations, mature CD4SP (4SP24) (x-axis) and mature CD8SP (8SP24) thymocytes (y-axis). Blue lines mark a FC of 2. Genes upregulated by >2-fold in peripheral CD4 and CD8 T cells, relative to their thymic counterparts, are highlighted in orange. Treg cell-related and proliferation signature genes are highlighted in green and blue, respectively (see text). (b) Expression/expression plot comparing lymph node CD4 (x-axis) and CD8 T cell transcriptomes (y-axis). Genes preferentially expressed in CD4+ (red) or CD8+ (blue) T cells are highlighted, with the corresponding number of gene probes. Transcriptional regulators are indicated in bold. (c) Heatmaps showing the level of phosphorylation of indicated signaling molecules in CD8+ (left) and CD4+ (right) lymph node T cells, detected simultaneously by mass cytometry at multiple time points following anti-CD3 and anti-CD28 crosslinking. Cells were fixed after antibody crosslinking at the indicated time points and analyzed on the CyTOF instrument. First column, unstimulated cells; Last column, PMA positive control. Panel c is representative of 4 independent experiments. (d) Fold change/FC plots showing transcriptome changes induced in anti-CD3and anti-CD28 stimulated CD4+ (x-axis) and CD8+ lymph node T cells (y-axis), relative to corresponding unstimulated cell populations at the indicated time points. Blue lines mark a FC of 2. Genes showing similar (gray) or lineage preferential regulation in CD4+ T cells (red) or CD8+ T cells (blue) are highlighted (FC threshold >2, with the corresponding number of genes indicated).

Similar articles

Cited by

References

    1. Miller JF. The golden anniversary of the thymus. Nat Rev. Immunol. 2011;11:489–495. - PubMed
    1. von Boehmer H, Teh HS, Kisielow P. The thymus selects the useful, neglects the useless and destroys the harmful. Immunol. Today. 1989;10:57–61. - PubMed
    1. Jameson SC, Hogquist KA, Bevan MJ. Positive selection of thymocytes. Annu. Rev. Immunol. 1995;13:93–126. - PubMed
    1. Robey E. Regulation of T cell fate by Notch. Annu. Rev. Immunol. 1999;17:283–295. - PubMed
    1. Hogquist KA, Baldwin TA, Jameson SC. Central tolerance: learning self-control in the thymus. Nat. Rev. Immunol. 2005;5:772–782. - PubMed

Publication types

MeSH terms

Associated data