. 2013 May;8(5):522-33.
doi: 10.4161/epi.24506. Epub 2013 Apr 17.

A genome-wide methylation study on obesity: differential variability and differential methylation

Affiliations

A genome-wide methylation study on obesity: differential variability and differential methylation

Xiaojing Xu et al. Epigenetics. 2013 May.

Abstract

Besides differential methylation, DNA methylation variation has recently been proposed and demonstrated to be a potential contributing factor to cancer risk. Here we aim to examine whether differential variability in methylation is also an important feature of obesity, a typical non-malignant common complex disease. We analyzed genome-wide methylation profiles of over 470,000 CpGs in peripheral blood samples from 48 obese and 48 lean African-American youth aged 14-20 y old. A substantial number of differentially variable CpG sites (DVCs), using statistics based on variances, as well as a substantial number of differentially methylated CpG sites (DMCs), using statistics based on means, were identified. Similar to the findings in cancers, DVCs generally exhibited an outlier structure and were more variable in cases than in controls. By randomly splitting the current sample into a discovery and validation set, we observed that both the DVCs and DMCs identified from the first set could independently predict obesity status in the second set. Furthermore, both the genes harboring DMCs and the genes harboring DVCs showed significant enrichment of genes identified by genome-wide association studies on obesity and related diseases, such as hypertension, dyslipidemia, type 2 diabetes and certain types of cancers, supporting their roles in the etiology and pathogenesis of obesity. We generalized the recent finding on methylation variability in cancer research to obesity and demonstrated that differential variability is also an important feature of obesity-related methylation changes. Future studies on the epigenetics of obesity will benefit from both statistics based on means and statistics based on variances.

Keywords: African-Americans; epigenome-wide association study (EWAS); genome-wide association study (GWAS); methylation variation; obesity.


Figures

None
Figure 1. DMC, DVCs and DMVCs. (A) Density histograms of DMCs (differentially methylated CpG sites). These P-values were derived from linear regression based on the Limma package comparing differences in means between lean and obese subjects. (B) Density histograms of DVCs (differentially variable CpG sites). These P-values were derived from Bartlett’s test comparing differences in variances between lean and obese. (C) Venn diagram illustrating DMCs, DVCs and DMVCs (differentially methylated and variable CpG sites). The overlapping DMVCs were significantly enriched with P.Fisher < 2.2E-16 and P.permutation (1000 times) < 0.001. (D) Top ranked DMC cg08339189. Y-axis shows the β value, x-axis the sample. Phenotypes were indicated as lean (black, n = 48) and obese (red, n = 48). The dashed lines show the mean levels in lean (0.15) and obese (0.18) separately. (E) Top ranked DVC cg24570070. The mean levels were not significantly different (0.88 in obese vs. 0.91 in lean). However, obese cases showed a large methylation variance. (F) Top ranked DMVC cg00033915. The mean levels (dashed line) were significantly different between the two groups (0.92 in obese vs. 0.93 in lean, raw p = 1.1E-5 and FDR = 4.2E-3). Furthermore, the obese group also showed significantly larger variance.
None
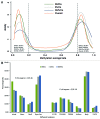
Figure 2. Distributions of DMCs, DVCs and DMVCs. (A) Distributions across average methylation levels. The Y-axis represents the density, x-axis the average methylation β value. The orange line presented the kernel density curve of overall CpG sites across β 0–1, the green line presented DMCs, the gray line DVCs and the blue line DMVCs. The percentages of each of these four types of CpG sites with betas below 0.2 or above 0.8 are also listed in the plot. (B) Distribution across genomic locations. Chi-square test found significant difference among their distributions across the genome with P-value < 2.2E-16. TSS200, CpG sites within 200bp from the transcription starting site (TSS); TSS1500, CpG sites within 200–1500bp from the transcription starting site (TSS); body, gene body.
None
Figure 3. Increased methylation variance in obese. (A) Scatter plot of mean methylation difference (x-axis) against methylation variance ratio (y-axis) comparing lean and obese. The percentage of DMCs, DVCs and DMVCs within each of the four quadrants was also listed. (B) Scatter plot of mean methylation difference (x-axis) against methylation variance ratio (y-axis) comparing lean and obese limited to the CpG sites on the illumina 27K chip. The percentage of DMCs, DVCs and DMVCs within each of the four quadrants was also listed.
None
Figure 4. Predictive ability of DMCs and DVCs. (A) Predictive ability of DMCs. The receiver operating characteristic (ROC) analysis showed the area under curve (AUC) and its 95% confidence interval (CI) in a randomly split testing set (24 obese vs. 24 lean) from the whole data set. (B) Predictive ability of DVCs. AUC and 95%CI was presented in a randomly split testing set (24 obese vs. 24 lean) from the whole data set.
None
Figure 5. Gene ontology enrichment analysis of DMCs, DVCs and DMVCs. Gene ontology analysis was performed using DAVID (http://david.abcc.ncifcrf.gov). The human genome was used as background. The top 500 DMCs (A), the top 500 DVCs (B) and all DMVCs (n = 1608) (C) were selected for analysis. The top ten enriched pathways are listed here together with their enrichment P-values, which are derived from a modified Fisher’s exact test.

References

    1. Feinberg AP, Irizarry RA. Evolution in health and medicine Sackler colloquium: Stochastic epigenetic variation as a driving force of development, evolutionary adaptation, and disease. Proc Natl Acad Sci U S A. 2010;107(Suppl 1):1757–64. doi: 10.1073/pnas.0906183107. - DOI - PMC - PubMed
    1. Hansen KD, Timp W, Bravo HC, Sabunciyan S, Langmead B, McDonald OG, et al. Increased methylation variation in epigenetic domains across cancer types. Nat Genet. 2011;43:768–75. doi: 10.1038/ng.865. - DOI - PMC - PubMed
    1. Teschendorff AE, Jones A, Fiegl H, Sargent A, Zhuang JJ, Kitchener HC, et al. Epigenetic variability in cells of normal cytology is associated with the risk of future morphological transformation. Genome Med. 2012;4:24. doi: 10.1186/gm323. - DOI - PMC - PubMed
    1. Teschendorff AE, Widschwendter M. Differential variability improves the identification of cancer risk markers in DNA methylation studies profiling precursor cancer lesions. Bioinformatics. 2012;28:1487–94. doi: 10.1093/bioinformatics/bts170. - DOI - PubMed
    1. Danaei G, Ding EL, Mozaffarian D, Taylor B, Rehm J, Murray CJ, et al. The preventable causes of death in the United States: comparative risk assessment of dietary, lifestyle, and metabolic risk factors. PLoS Med. 2009;6:e1000058. doi: 10.1371/journal.pmed.1000058. - DOI - PMC - PubMed

Publication types

LinkOut - more resources