. 2013 May;8(5):534-41.
doi: 10.4161/epi.24507. Epub 2013 Apr 17.

First evidence of DNA methylation in insect Tribolium castaneum: environmental regulation of DNA methylation within heterochromatin

Affiliations

First evidence of DNA methylation in insect Tribolium castaneum: environmental regulation of DNA methylation within heterochromatin

Isidoro Feliciello et al. Epigenetics. 2013 May.

Abstract

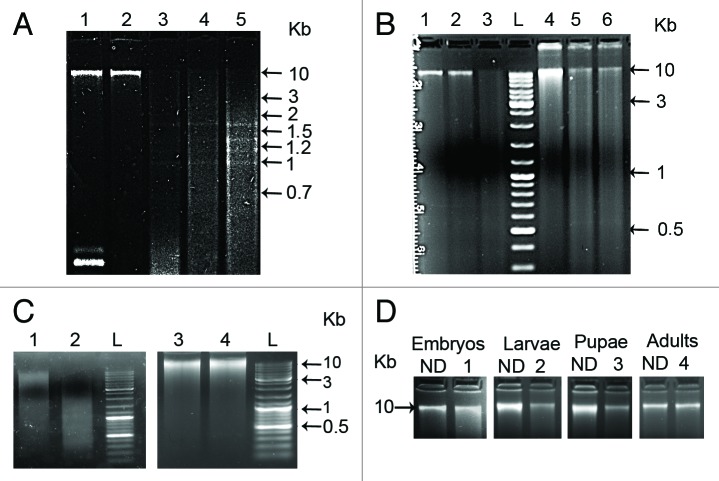
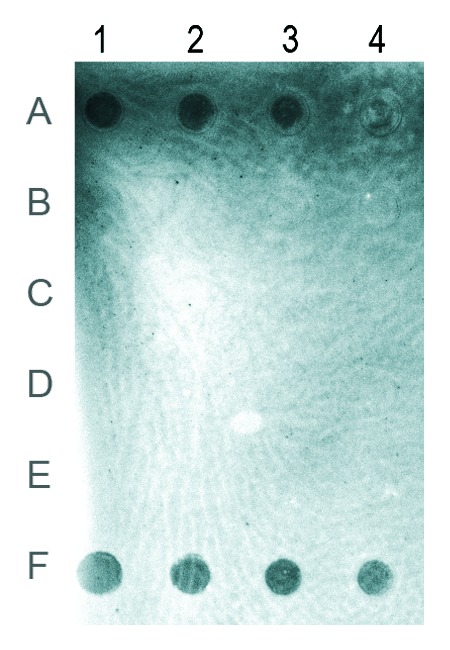
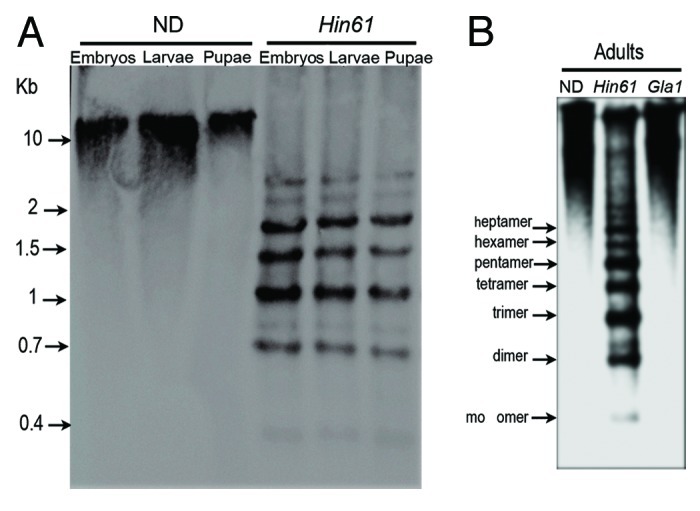
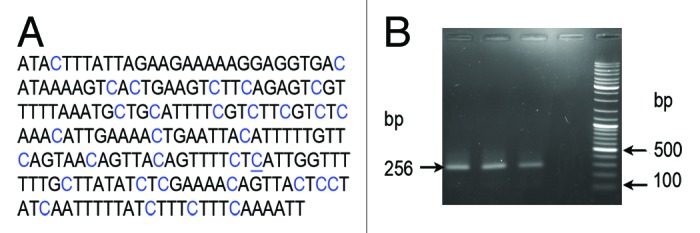
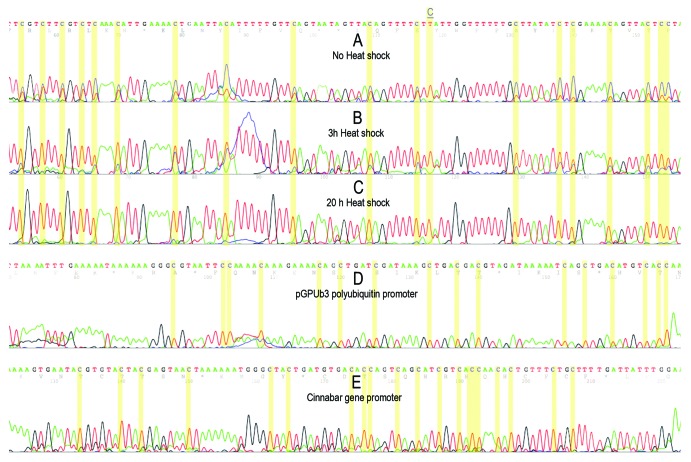
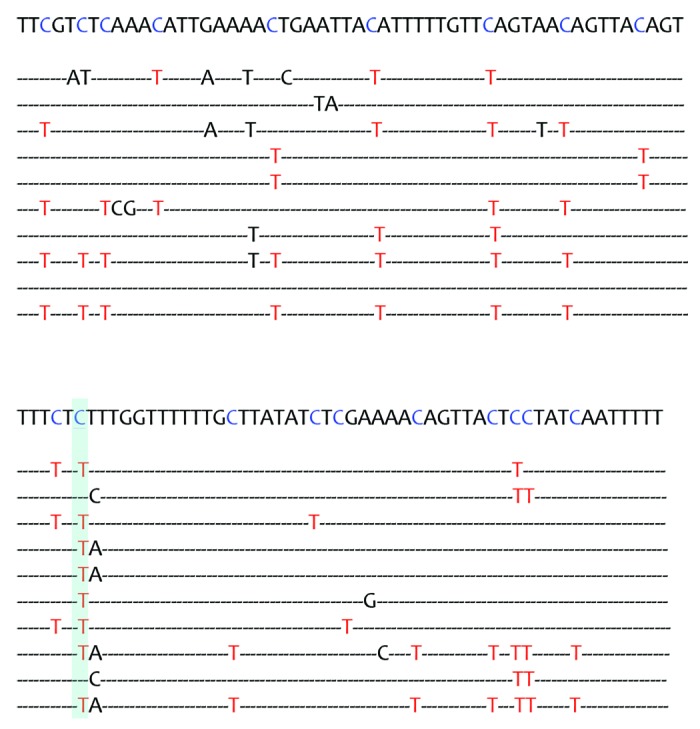
DNA methylation has been studied in many eukaryotic organisms, in particular vertebrates, and was implicated in developmental and phenotypic variations. Little is known about the role of DNA methylation in invertebrates, although insects are considered as excellent models for studying the evolution of DNA methylation. In the red flour beetle, Tribolium castaneum (Tenebrionidae, Coleoptera), no evidence of DNA methylation has been found till now. In this paper, a cytosine methylation in Tribolium castaneum embryos was detected by methylation sensitive restriction endonucleases and immuno-dot blot assay. DNA methylation in embryos is followed by a global demethylation in larvae, pupae and adults. DNA demethylation seems to proceed actively through 5-hydroxymethylcytosine, most probably by the action of TET enzyme. Bisulfite sequencing of a highly abundant satellite DNA located in pericentromeric heterochromatin revealed similar profile of cytosine methylation in adults and embryos. Cytosine methylation was not only restricted to CpG sites but was found at CpA, CpT and CpC sites. In addition, complete cytosine demethylation of heterochromatic satellite DNA was induced by heat stress. The results reveal existence of DNA methylation cycling in T. castaneum ranging from strong overall cytosine methylation in embryos to a weak DNA methylation in other developmental stages. Nevertheless, DNA methylation is preserved within heterochromatin during development, indicating its role in heterochromatin formation and maintenance. It is, however, strongly affected by heat stress, suggesting a role for DNA methylation in heterochromatin structure modulation during heat stress response.

Keywords: DNA methylation; Tribolium castaneum; heat shock response; heterochromatin; satellite DNA.


Figures

None
Figure 1. (A) Agarose gel electrophoresis of equivalent amounts of genomic DNA from 3 d old embryos, larvae, pupae and adults digested using: Hin6I restriction enzyme (lanes: 1-embryos with plasmid pUC18R as a control of digestion, 2-embryos, 3-larvae, 4-pupae, 5 -adults). (B) Methylation-sensitive restriction enzyme HpaII (lanes: 2-embryos, 5-adults) and with the methylation-insensitive restriction enzyme MspI (lanes: 3-embryos, 6- adults). Undigested DNA from embryos and adults is present in lanes 1 and 4, respectively. (C) Methylation specific GlaI enzyme digestion of DNAs from embryos (lane 2) and from adults (lane 4) compared with the undigested controls (lanes: 1-embryos, 3-adults). (D)PvuRts1I enzyme digestion of DNA from embryos, larvae, pupae and adults (lanes 1, 2, 3, 4 respectively) compared with the undigested controls (ND). The tracks labeled L contain GeneRuler Ladder mix (Fermentas).
None
Figure 2. Immuno-dot blot using antibody specific for 5-methylcytosine. Rows (A) to (D) represent genomic DNAs from embryos, larvae, pupae and adults, respectively. Row (E), unmethylated DNA used as a negative control. Row (F), 5-methylcytosine DNA used as a positive control. The amount of genomic DNA in the dots of columns 1–4 was 100, 50, 25 and 12.5 ng. The brightness of the image was modified using the Curve function in Photoshop.
None
Figure 3. Southern hybridization analysis of T. castaneum genomic DNA using as a hybridization probe mixture of biotin labeled Tcast1a and Tcast1b monomers. (A) Equivalent amounts of genomic DNA from embryos (three days old), larvae and pupae were digested using Hin6I and compared with undigested DNA. (B) Equivalent amounts of genomic DNA from adults were digested with Hin6I and GlaI and compared with undigested DNA.
None
Figure 4.(A) A region of TCAST satellite sequence of 265 bp used for cytosine methylation analysis by bisulfite treatment. Positions of 33 cytosines are marked in blue, and a single position where no methylation was detected is underlined. (B) PCR amplification using TCAST methylprimers and bisulfite treated genomic DNAs (lanes 1, 2, 3) and untreated, control DNA (lane 4). In lanes 1–3 genomic DNA was isolated from T. castaneum adults not subjected to heat shock and heat shocked for 3 h and 20 h, respectively. The size of amplicon is 265 bp. The lane 5 contains GeneRuler Ladder mix (Fermentas).
None
Figure 5. Electropherograms of a part of TCAST satellite sequence after bisulfite treatment of genomic DNAs isolated from adults (A), from adults heat shocked for 3 h (B) and 20 h (C). Red and blue peaks indicate thymine and cytosine, respectively. Each cytosine position is indicated by yellow column and a single position within TCAST region where the cytosine is present in completely unmethylated state is marked and underlined. For each sample, the methylation status of polyubiquitin and cinnabar gene promoters were also checked and the results were identical for all samples, as shown in (D) and (E).
None
Figure 6. A part (108 bp) of the most common sequence (MCS) of TCAST satellite DNA is aligned with the sequences of clones obtained after amplification of bisulfite treated DNA from adults. Each cytosine is indicated in blue and the corresponding thymines occurring when cytosines are not methylated are indicated in red. The single position where no methylation was detected by genomic bisulfite sequencing is indicated by blue column. (-) lines represent identical bases as those present in MSC of TCAST satellite DNA.

Similar articles

Cited by

References

    1. Bird A. DNA methylation patterns and epigenetic memory. Genes Dev. 2002;16:6–21. doi: 10.1101/gad.947102. - DOI - PubMed
    1. Feil R, Khosla S. Genomic imprinting in mammals: an interplay between chromatin and DNA methylation? Trends Genet. 1999;15:431–5. doi: 10.1016/S0168-9525(99)01822-3. - DOI - PubMed
    1. Suzuki MM, Bird A. DNA methylation landscapes: provocative insights from epigenomics. Nat Rev Genet. 2008;9:465–76. doi: 10.1038/nrg2341. - DOI - PubMed
    1. Field LM, Lyko F, Mandrioli M, Prantera G. DNA methylation in insects. Insect Mol Biol. 2004;13:109–15. doi: 10.1111/j.0962-1075.2004.00470.x. - DOI - PubMed
    1. Xiang H, Zhu J, Chen Q, Dai F, Li X, Li M, et al. Single base-resolution methylome of the silkworm reveals a sparse epigenomic map. Nat Biotechnol. 2010;28:516–20. doi: 10.1038/nbt.1626. - DOI - PubMed

Publication types

LinkOut - more resources