

Adaptive optics optical coherence tomography for in vivo mouse retinal imaging
- PMID: 23644903
- PMCID: PMC4023643
- DOI: 10.1117/1.JBO.18.5.056007
Adaptive optics optical coherence tomography for in vivo mouse retinal imaging
Abstract
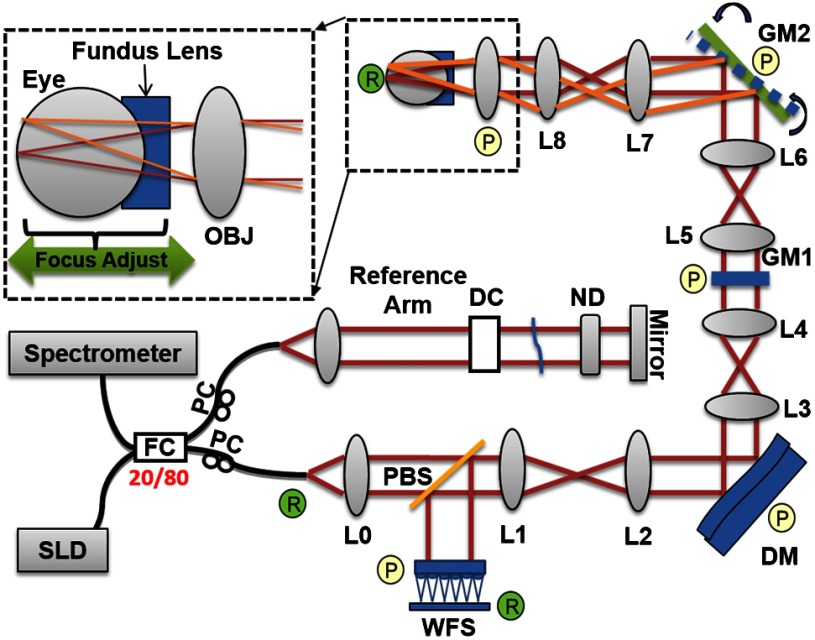
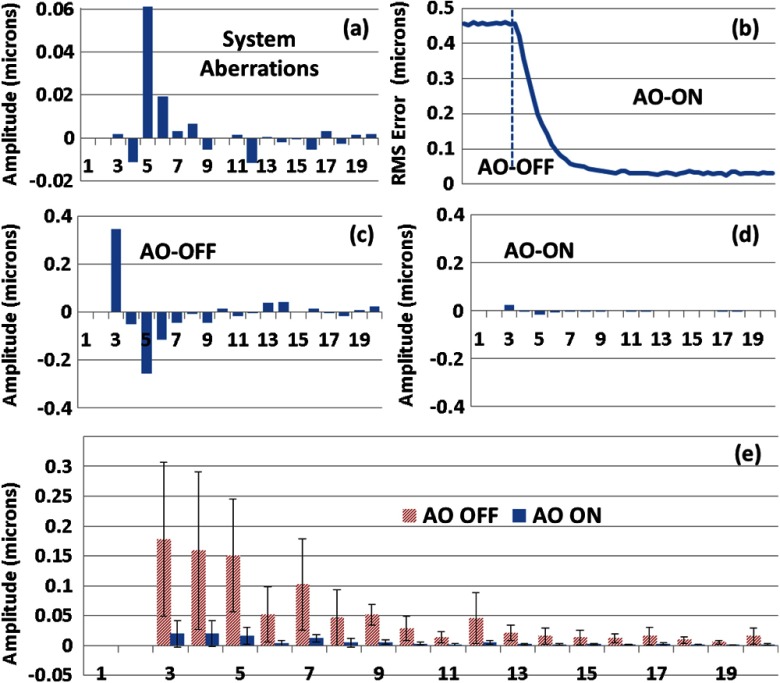
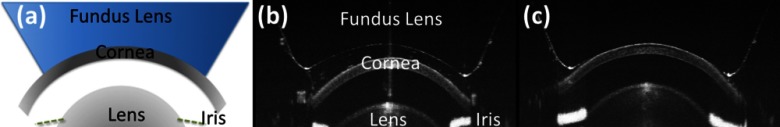
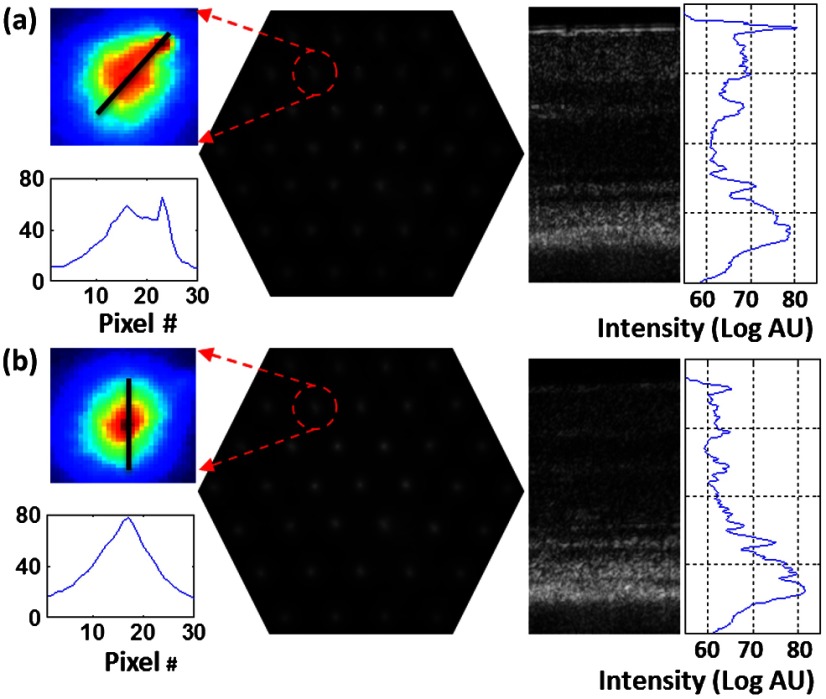
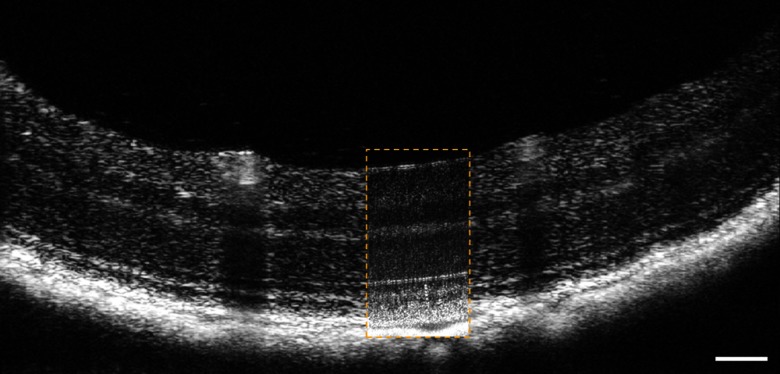
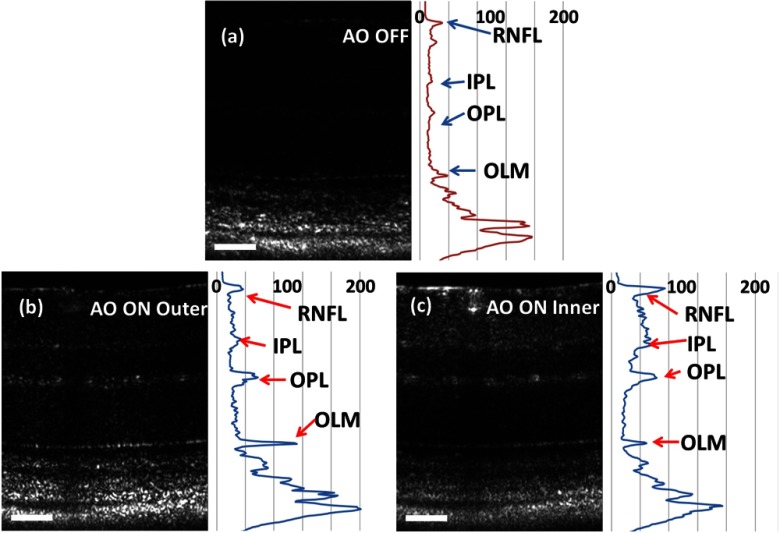
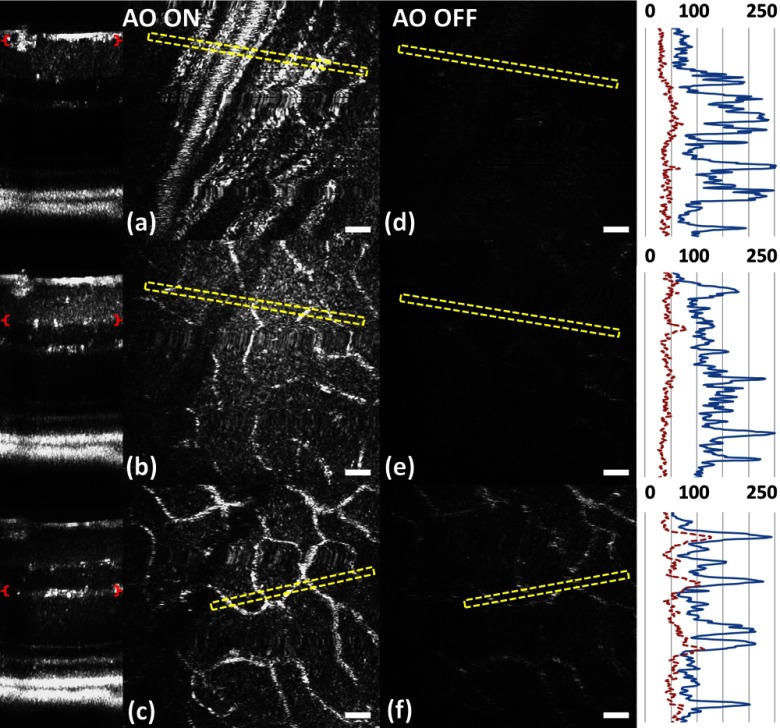
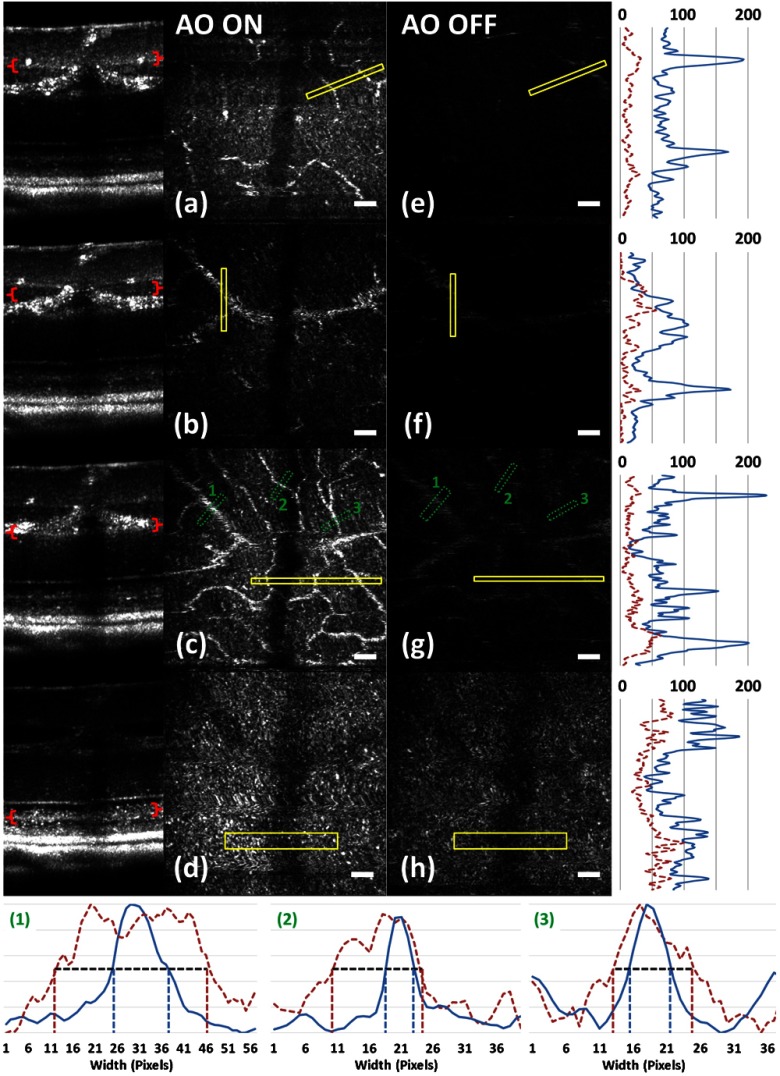
Small animal models of retinal diseases are important to vision research, and noninvasive high resolution in vivo rodent retinal imaging is becoming an increasingly important tool used in this field. We present a custom Fourier domain optical coherence tomography (FD-OCT) instrument for high resolution imaging of mouse retina. In order to overcome aberrations in the mouse eye, we incorporated a commercial adaptive optics system into the sample arm of the refractive FD-OCT system. Additionally, a commercially available refraction canceling lens was used to reduce lower order aberrations and specular back-reflection from the cornea. Performance of the adaptive optics (AO) system for correcting residual wavefront aberration in the mice eyes is presented. Results of AO FD-OCT images of mouse retina acquired in vivo with and without AO correction are shown as well.
Figures
Similar articles
-
Lens-based wavefront sensorless adaptive optics swept source OCT.Sci Rep. 2016 Jun 9;6:27620. doi: 10.1038/srep27620. Sci Rep. 2016. PMID: 27278853 Free PMC article.
-
Cellular resolution volumetric in vivo retinal imaging with adaptive optics-optical coherence tomography.Opt Express. 2009 Mar 2;17(5):4084-94. doi: 10.1364/oe.17.004084. Opt Express. 2009. PMID: 19259248 Free PMC article.
-
Effect of contact lens on optical coherence tomography imaging of rodent retina.Curr Eye Res. 2013 Dec;38(12):1235-40. doi: 10.3109/02713683.2013.815218. Epub 2013 Sep 3. Curr Eye Res. 2013. PMID: 24000814 Free PMC article.
-
Review of adaptive optics OCT (AO-OCT): principles and applications for retinal imaging [Invited].Biomed Opt Express. 2017 Apr 19;8(5):2536-2562. doi: 10.1364/BOE.8.002536. eCollection 2017 May 1. Biomed Opt Express. 2017. PMID: 28663890 Free PMC article. Review.
-
Adaptive optics optical coherence tomography in glaucoma.Prog Retin Eye Res. 2017 Mar;57:76-88. doi: 10.1016/j.preteyeres.2016.11.001. Epub 2016 Dec 1. Prog Retin Eye Res. 2017. PMID: 27916682 Free PMC article. Review.
Cited by
-
Lens-based wavefront sensorless adaptive optics swept source OCT.Sci Rep. 2016 Jun 9;6:27620. doi: 10.1038/srep27620. Sci Rep. 2016. PMID: 27278853 Free PMC article.
-
Wavefront sensorless adaptive optics optical coherence tomography for in vivo retinal imaging in mice.Biomed Opt Express. 2014 Jan 21;5(2):547-59. doi: 10.1364/BOE.5.000547. eCollection 2014 Feb 1. Biomed Opt Express. 2014. PMID: 24575347 Free PMC article.
-
High-speed and widefield handheld swept-source OCT angiography with a VCSEL light source.Biomed Opt Express. 2021 May 20;12(6):3553-3570. doi: 10.1364/BOE.425411. eCollection 2021 Jun 1. Biomed Opt Express. 2021. PMID: 34221678 Free PMC article.
-
Detecting abnormalities in choroidal vasculature in a mouse model of age-related macular degeneration by time-course indocyanine green angiography.J Vis Exp. 2014 Feb 19;(84):e51061. doi: 10.3791/51061. J Vis Exp. 2014. PMID: 24637497 Free PMC article.
-
Wide-field retinal optical coherence tomography with wavefront sensorless adaptive optics for enhanced imaging of targeted regions.Biomed Opt Express. 2016 Dec 2;8(1):16-37. doi: 10.1364/BOE.8.000016. eCollection 2017 Jan 1. Biomed Opt Express. 2016. PMID: 28101398 Free PMC article.
References
Publication types
MeSH terms
Grants and funding
LinkOut - more resources
Full Text Sources
Other Literature Sources
