. 2013 May;25(5):1657-73.
doi: 10.1105/tpc.112.104869. Epub 2013 May 3.

Antagonistic basic helix-loop-helix/bZIP transcription factors form transcriptional modules that integrate light and reactive oxygen species signaling in Arabidopsis

Affiliations

Antagonistic basic helix-loop-helix/bZIP transcription factors form transcriptional modules that integrate light and reactive oxygen species signaling in Arabidopsis

Dongqin Chen et al. Plant Cell. 2013 May.

Abstract

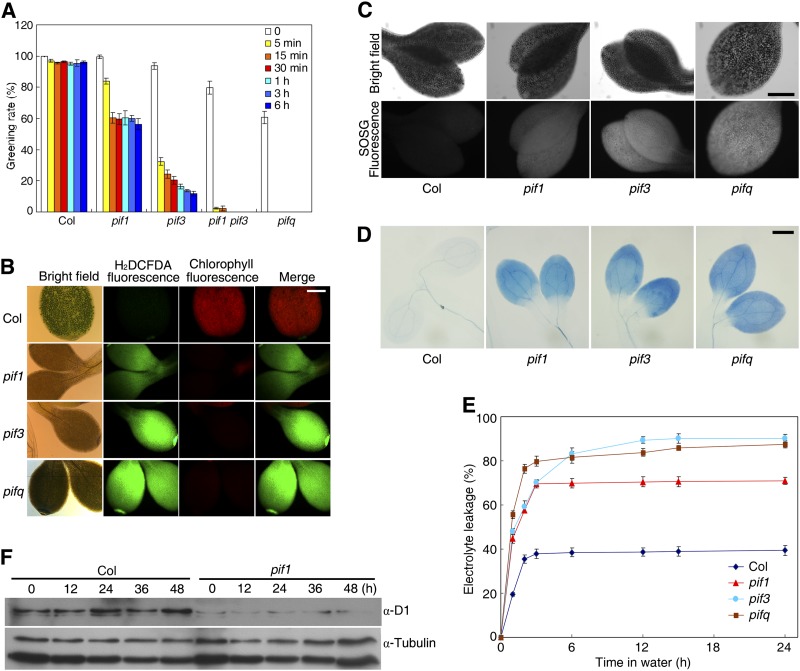
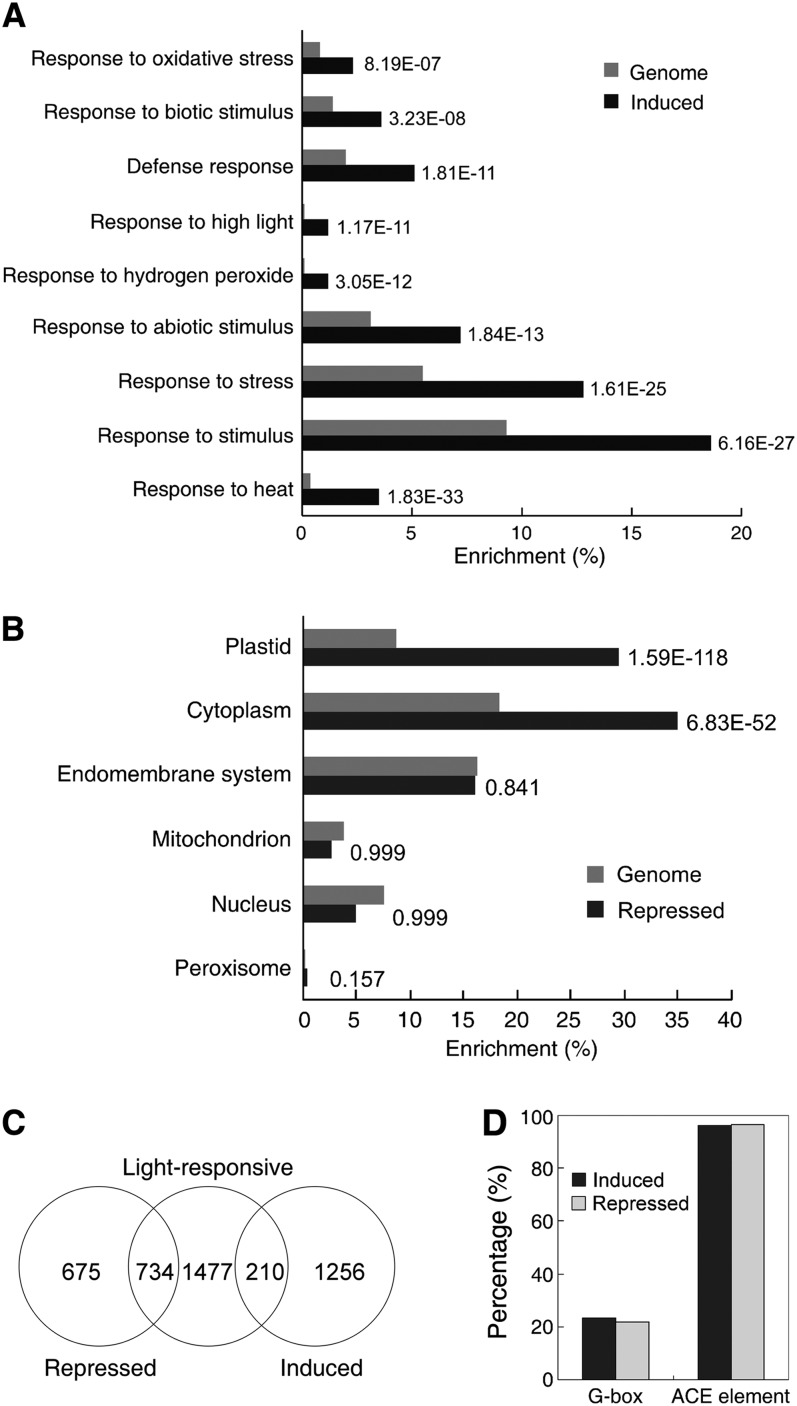
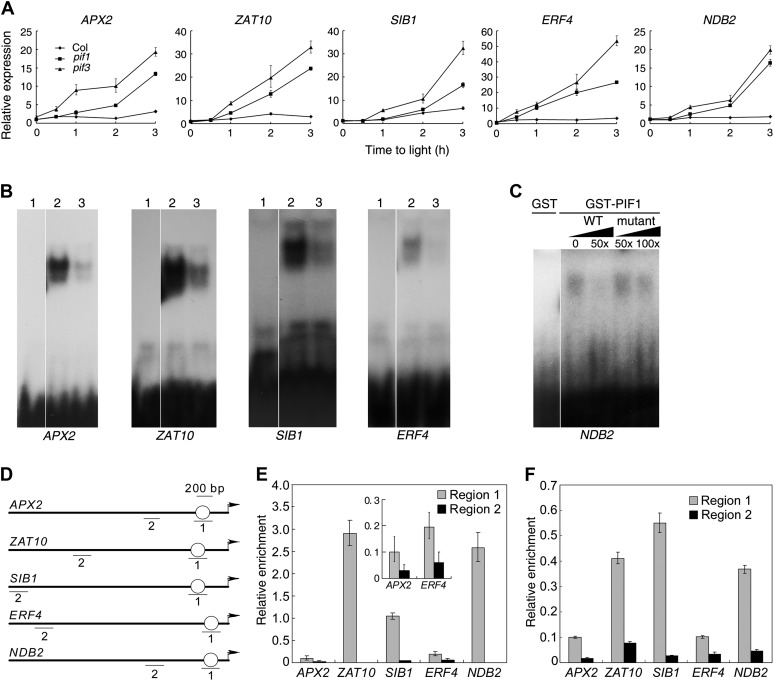
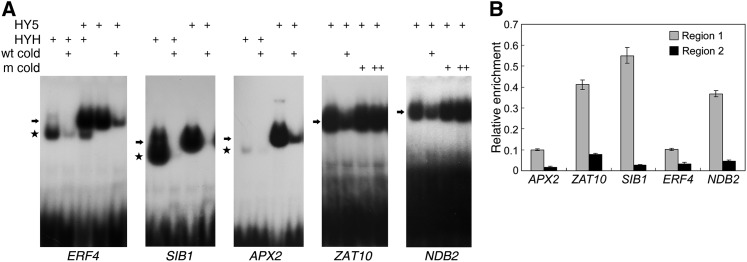
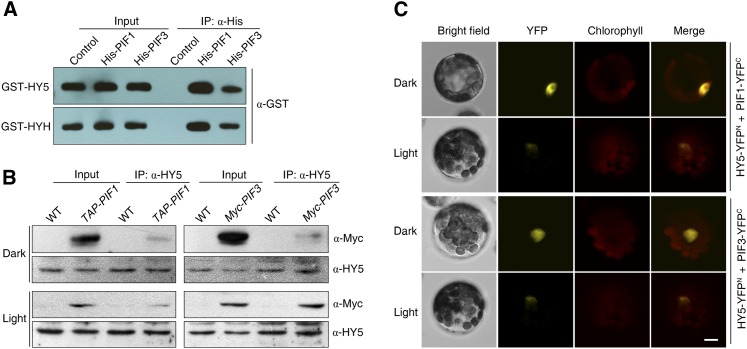
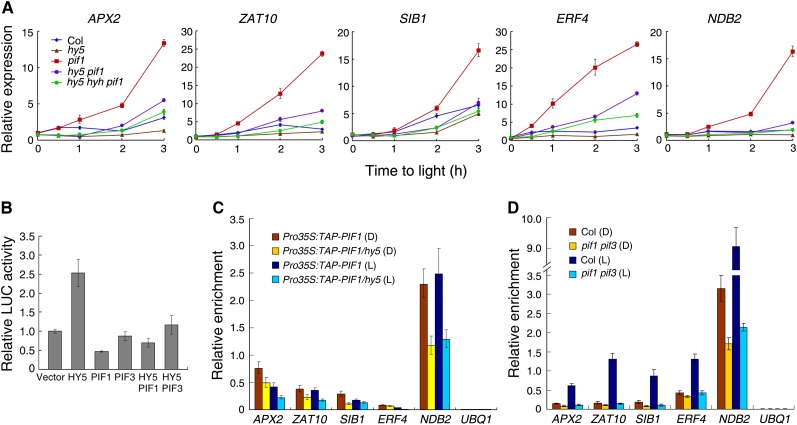
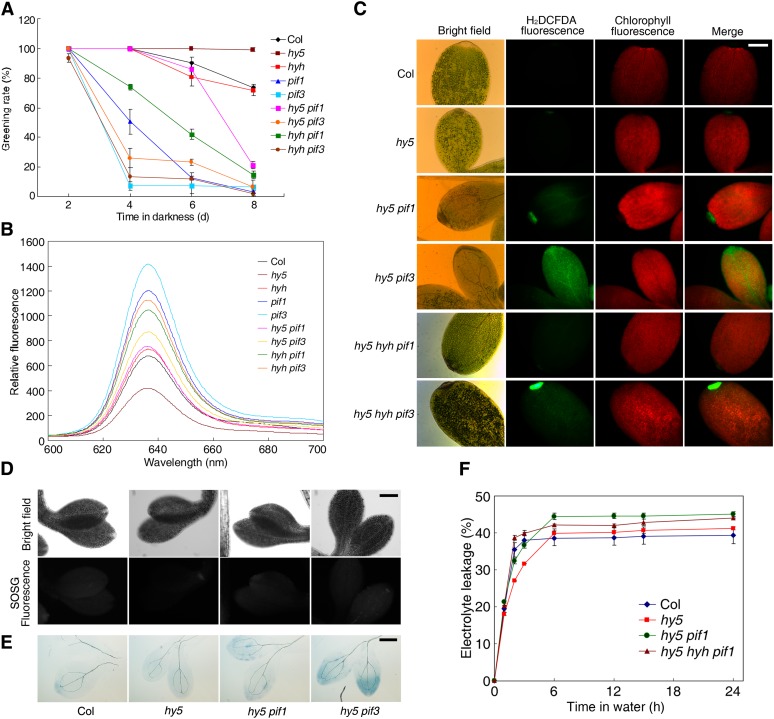
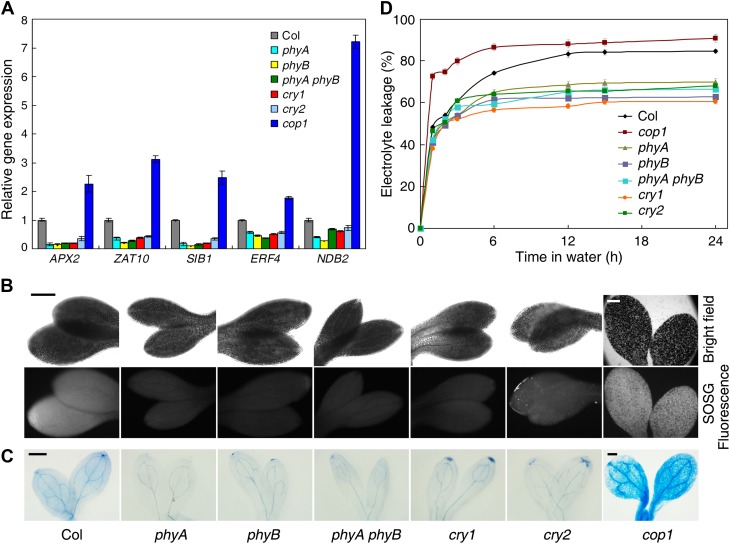
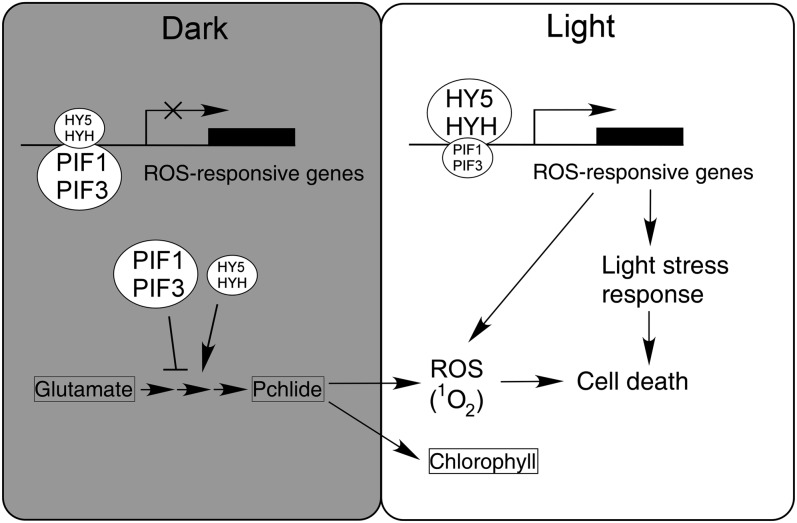
The critical developmental switch from heterotrophic to autotrophic growth of plants involves light signaling transduction and the production of reactive oxygen species (ROS). ROS function as signaling molecules that regulate multiple developmental processes, including cell death. However, the relationship between light and ROS signaling remains unclear. Here, we identify transcriptional modules composed of the basic helix-loop-helix and bZIP transcription factors PHYTOCHROME-INTERACTING FACTOR1 (PIF1), PIF3, ELONGATED HYPOCOTYL5 (HY5), and HY5 HOMOLOGY (HYH) that bridge light and ROS signaling to regulate cell death and photooxidative response. We show that pif mutants release more singlet oxygen and exhibit more extensive cell death than the wild type during Arabidopsis thaliana deetiolation. Genome-wide expression profiling indicates that PIF1 represses numerous ROS and stress-related genes. Molecular and biochemical analyses reveal that PIF1/PIF3 and HY5/HYH physically interact and coordinately regulate the expression of five ROS-responsive genes by directly binding to their promoters. Furthermore, PIF1/PIF3 and HY5/HYH function antagonistically during the seedling greening process. In addition, phytochromes, cryptochromes, and CONSTITUTIVE PHOTOMORPHOGENIC1 act upstream to regulate ROS signaling. Together, this study reveals that the PIF1/PIF3-HY5/HYH transcriptional modules mediate crosstalk between light and ROS signaling and sheds light on a new mechanism by which plants adapt to the light environments.


Figures

Figure 1.
Figure 1.
PIF1 and PIF3 Redundantly Promote Seedling Greening and Prevent Singlet Oxygen Production and Cell Death. (A) Percentage of greening cotyledons in the wild type (Col) and various pif mutants under different light treatments. Four-day-old dark-grown seedlings were first exposed to growth light (60 µmol m−2 s−1) for the indicated periods of time and then transferred to weak light (10 µmol m−2 s−1) for 2 d. Data are mean ± sd, n = 3. (B) to (D) Four-day-old etiolated seedlings were exposed to light (60 µmol m−2 s−1) for 24 h (B) or 6 h ([C] and [D]). Bars = 200 μm. (B) Cellular ROS levels in the cotyledons of the wild type (Col) and various pif mutants. H2DCFDA fluorescence (green) indicates ROS, and chlorophyll autofluorescence is shown in red. (C) Singlet oxygen production in the cotyledons as determined by SOSG fluorescence. (D) Trypan blue staining of cotyledons of the wild type (Col) and pif1, pif3, and pifq. (E) Electrolyte leakage of the pif mutants and wild-type seedlings. Four-day-old etiolated seedlings were exposed to light (60 µmol m−2 s−1) for 12 h and immersed in water, and electrolyte leakage was measured periodically. Data are mean ± sd, n = 3. (F) Turnover of D1 protein in the pif1 mutant compared with the wild type. Immunoblot of a tubulin protein serves as a control. Seedlings were grown in darkness for 4 d before exposure to light (60 µmol m−2 s−1) for the indicated periods of time.
Figure 2.
Figure 2.
Microarray Analysis of PIF1-Regulated Genes. (A) Enrichment of selected categories of GO biological process in genes induced in pif1. The numbers on the right are P values calculated based on their relative abundance in the wild-type genome. For a complete list of significant GO terms, see Supplemental Data Set 2 online. (B) Enrichment of selected categories of GO cellular component in genes repressed in pif1. The numbers on the right are P values calculated based on their relative abundance in the wild-type genome. For a complete list of significant GO terms, see Supplemental Data Set 3 online. (C) Venn diagram showing the overlap of differentially regulated genes in pif1 identified in this study with previously reported light-responsive genes (Charron et al., 2009). (D) Distribution of the putative G-box motif (CACGTG) and ACE element (ACGT) in the 2-kb promoter regions of PIF1-regulated genes.
Figure 3.
Figure 3.
PIF1 and PIF3 Directly Inhibit ROS-Responsive Gene Expression in the Light. (A) Relative expression of various genes by qRT-PCR. Four-day-old etiolated seedlings were kept in darkness or transferred to light (60 µmol m−2 s−1) for up to 3 h. Data are mean ± sd, n = 3. (B) EMSA of the binding of promoter fragments of the indicated genes to GST-PIF1 or GST-PIF3. Lane 1, GST protein only; lanes 2 and 3, GST-PIF1 fusion protein without (lane 2) or with (lane 3) cold competitor DNA. Signals at the bottom indicate free probes. (C) EMSA of the binding of the NDB2 promoter fragment to GST-PIF1. WT, wild-type cold competitor; mutant, cold competitor with a mutation in the G-box. The numbers indicate the amount of excess cold competitor added to the reaction mix. (D) Promoter diagrams of genes that function downstream of PIF1 and PIF3. Arrows indicate the translation start sites of the genes. Circles denote the position of the G-box motif. “1” and “2” indicate the approximate positions of primers used for ChIP amplification. (E) and (F) ChIP assays showing the enrichment of regions 1 and 2 of DNA isolated from Pro35S:TAP-PIF1 (E) and Pro35S:Myc-PIF3 (F) plants following precipitation with an anti-Myc antibody. Seedlings were grown in darkness for 4 d and then were irradiated (60 µmol m−2 s−1) for 30 min. Data are mean ± sd, n = 3. Inset in (E) is the enlargement for APX2 and ERF4 genes.
Figure 4.
Figure 4.
HY5 Binds to the Promoter Regions of ROS-Responsive Genes in Vitro and in Vivo. (A) EMSA of the binding of various promoter fragments to GST-HY5 or GST-HYH recombinant proteins. Arrows indicate HY5-DNA complexes; stars denote HYH-DNA complexes. wt cold, unlabeled wild-type competitor DNA; m cold, unlabeled competitor DNA with mutations (CttGTG) in the G-box motif. For cold DNA, “+” and “++” indicate a 50- and 100-fold excess, respectively. (B) ChIP assays showing enrichment of regions 1 and 2 in DNA isolated from Col wild-type plants following precipitation with an anti-HY5 antibody. Regions 1 and 2 are defined in Figure 3D. Seedlings were grown in darkness for 4 d and then exposed to light (60 µmol m−2 s−1) for 30 min. Data are mean ± sd, n = 3.
Figure 5.
Figure 5.
PIF1 and PIF3 Physically Interact with HY5 and HYH. (A) In vitro pull-down assay of His-PIF1 or His-PIF3 and GST-HY5 or GST-HYH. His-PIF1 or His-PIF3 fusion proteins were incubated with GST-HY5 or GST-HYH and pulled down by nickel-nitrilotriacetic acid agarose. The precipitated fractions were probed with an anti-GST antibody. Control, proteins extracted from E. coli expressing His empty vector. IP, immunoprecipitation. (B) In vivo coimmunoprecipitation assay between TAP-PIF1 or Myc-PIF3 with HY5. Pro35S:TAP-PIF1, Pro35S:Myc-PIF3, or Col wild-type (WT) seedlings were grown in darkness for 4 d and then either kept in the dark or transferred to light (60 µmol m−2 s−1) for an additional 30 min. After precipitation with the anti-HY5 antibody, proteins were immunoblotted with anti-HY5 or anti-Myc antibodies. (C) BiFC analysis of interactions between HY5, PIF1, and PIF3 in the nuclei of Arabidopsis protoplasts. After cotransformation, the protoplasts were incubated in darkness for 16 h and then kept in darkness or exposed to light (10 µmol m−2 s−1) for 1 h before observation. Chlorophyll autofluorescence is shown in red. YFPn and YFPc, the N-terminal or C-terminal fragment of YFP, respectively. Bar = 5 μm.
Figure 6.
Figure 6.
PIF1/PIF3 and HY5/HYH Coregulate ROS-Responsive Genes. (A) qRT-PCR showing the relative expression of various ROS-responsive genes. Four-day-old etiolated seedlings were kept in darkness or transferred to light (60 µmol m−2 s−1) for up to 3 h. Data are mean ± sd, n = 3. (B) The relative activity of the ProERF4:LUC reporter in Arabidopsis protoplasts cotransformed with the indicated effector constructs. The relative LUC activities were normalized to the Pro35S:GUS internal control. Protoplast transformation, incubation, and protein extraction were performed in darkness. Mean ± sd, n = 3. (C) and (D) Seedlings were grown in darkness (D) for 4 d or irradiated with light (L; 60 µmol m−2 s−1) for 30 min. Data are mean ± sd, n = 3. The enrichment of UBQ1 serves as a negative control. (C) Relative enrichment of region 1 fragments (shown in Figure 3D) in DNA isolated from hy5 and Col wild-type plants harboring Pro35S:TAP-PIF1 and coimmunoprecipitated with the anti-Myc antibody. (D) Relative enrichment of region 1 fragments (shown in Figure 3D) in DNA isolated from pif1 pif3 and Col wild-type plants coimmunoprecipitated with HY5 antibody.
Figure 7.
Figure 7.
Genetic Interaction between HY5/HYH and PIF1/PIF3. (A) Seedling greening rate. Two- to eight-day-old etiolated seedlings were transferred to light (60 µmol m−2 s−1) for an additional 2 d. Mean ± sd, n = 3. (B) Pchlide accumulation of 4-d-old dark-grown seedlings in the indicated mutants and the wild type. (C) H2DCFDA fluorescence showing cellular ROS production of 4-d-old dark-grown seedlings after 24 h of light exposure (60 µmol m−2 s−1). (D) and (E) SOSG fluorescence imaging (D) and trypan blue staining (E) of 4-d-old etiolated seedlings after light illumination (60 µmol m−2 s−1) for 6 h. Bars = 200 μm. (F) Relative electrolyte leakage showing the extent of cell death. Four-day-old etiolated seedlings were exposed to light (60 µmol m−2 s−1) for 12 h and immersed in water, and electrolyte leakage was measured periodically. Data are mean ± sd, n = 3.
Figure 8.
Figure 8.
The Opposite Role of Photoreceptors and COP1 in Regulating ROS Production and Signaling. (A) qRT-PCR showing the expression of the indicated ROS-responsive genes. Seedlings were grown in darkness for 4 d and transferred to light (60 µmol m−2 s−1) for 3 h. Data are from three biological replicates; bars indicate sd. (B) and (C) SOSG fluorescence imaging (B) and trypan blue staining (C) of 6-d-old wild-type and mutant etiolated seedlings after light illumination (60 µmol m−2 s−1) for 6 h. Bars = 200 μm. (D) Electrolyte leakage levels in the indicated photoreceptor and cop1 mutants. Data are mean ± sd, n = 4.
Figure 9.
Figure 9.
A Model for the Function of PIF1/PIF3 and HY5/HYH in Integrating Light and ROS Signaling. In the dark, PIF1 and PIF3 accumulate while HY5 and HYH are largely degraded, leading to less Pchlide accumulation. Meanwhile, HY5/HYH and PIF1/PIF3 interact and bind to the promoter regions of ROS-responsive genes, resulting in the inhibition of their gene expression. Upon light irradiation, photosensitized Pchlide generates singlet oxygen (1O2), which causes photooxidative damage and cell death in plants; on the other hand, light promotes the stabilization of HY5/HYH and the rapid turnover of PIF1/PIF3, which in turn activates the expression of ROS-responsive genes and the ROS signaling, thus allowing plants to adjust ROS level and to cope with cell death under unfavorable light stress conditions. Light also promotes the formation of chlorophyll from Pchlide. Arrows, positive effect; bar, negative regulation.

Comment in

Similar articles

Cited by

References

    1. Achard P., Renou J.-P., Berthomé R., Harberd N.P., Genschik P. (2008). Plant DELLAs restrain growth and promote survival of adversity by reducing the levels of reactive oxygen species. Curr. Biol. 18: 656–660 - PubMed
    1. Alabadí D., Blázquez M.A. (2009). Molecular interactions between light and hormone signaling to control plant growth. Plant Mol. Biol. 69: 409–417 - PubMed
    1. Al-Sady B., Ni W., Kircher S., Schäfer E., Quail P.H. (2006). Photoactivated phytochrome induces rapid PIF3 phosphorylation prior to proteasome-mediated degradation. Mol. Cell 23: 439–446 - PubMed
    1. Apel K., Hirt H.R. (2004). Reactive oxygen species: Metabolism, oxidative stress, and signal transduction. Annu. Rev. Plant Biol. 55: 373–399 - PubMed
    1. Bauer D., Viczián A., Kircher S., Nobis T., Nitschke R., Kunkel T., Panigrahi K.C., Adám E., Fejes E., Schäfer E., Nagy F. (2004). Constitutive photomorphogenesis 1 and multiple photoreceptors control degradation of phytochrome interacting factor 3, a transcription factor required for light signaling in Arabidopsis. Plant Cell 16: 1433–1445 - PMC - PubMed

Publication types

MeSH terms