. 2013 Jun 14;288(24):17238-52.
doi: 10.1074/jbc.M112.446351. Epub 2013 May 3.

Selective enhancing effect of early mitotic inhibitor 1 (Emi1) depletion on the sensitivity of doxorubicin or X-ray treatment in human cancer cells

Affiliations

Selective enhancing effect of early mitotic inhibitor 1 (Emi1) depletion on the sensitivity of doxorubicin or X-ray treatment in human cancer cells

Natsumi Shimizu et al. J Biol Chem. .

Abstract

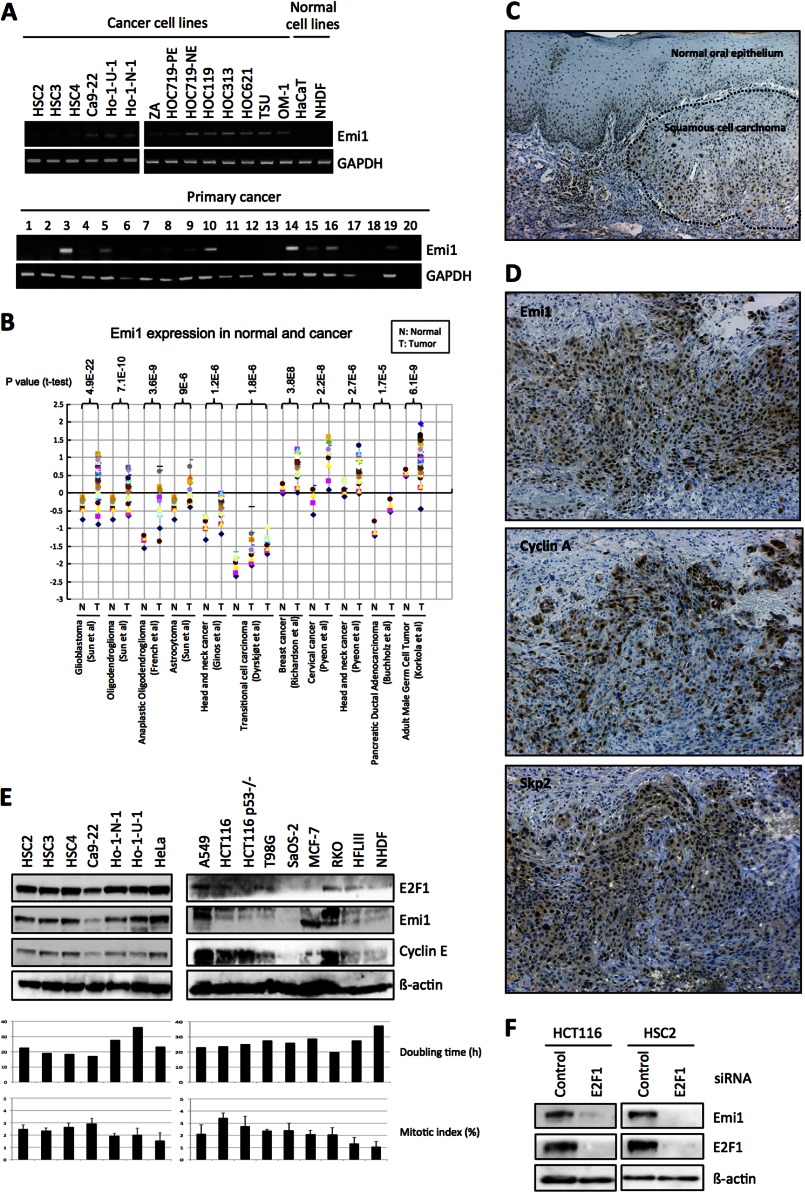
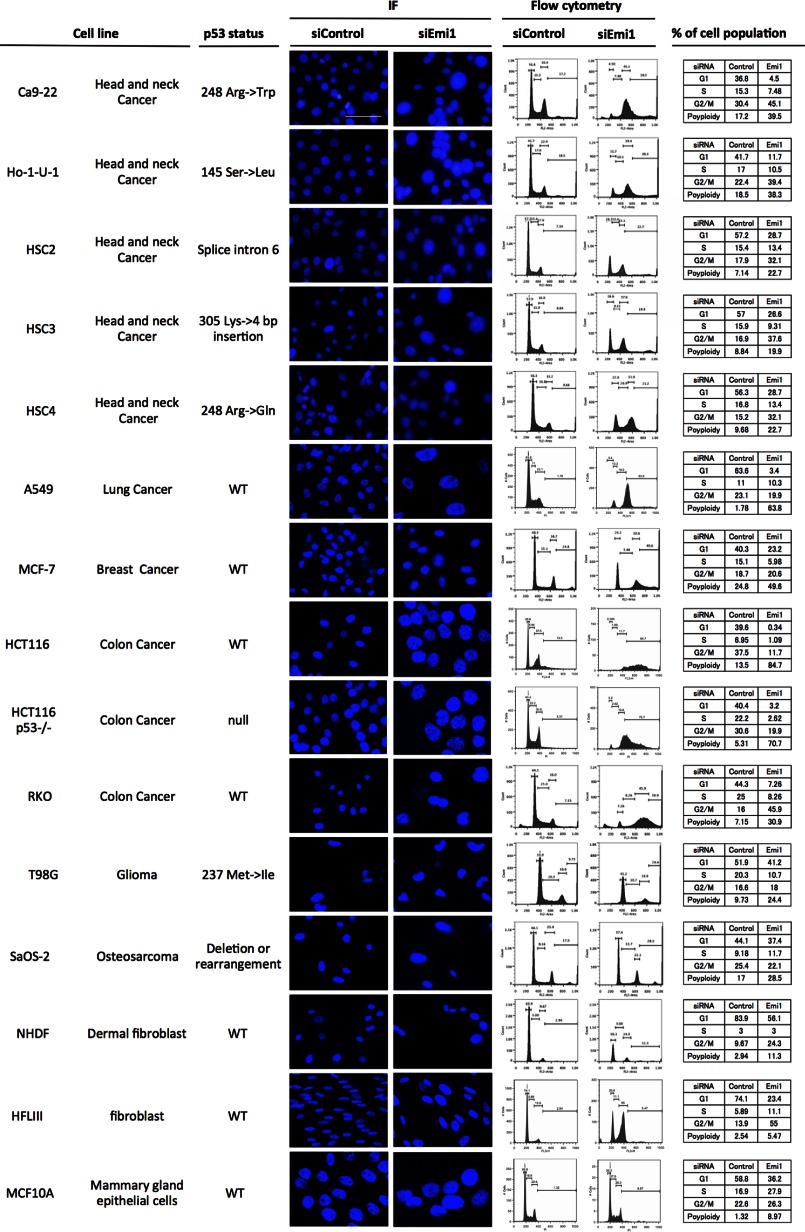
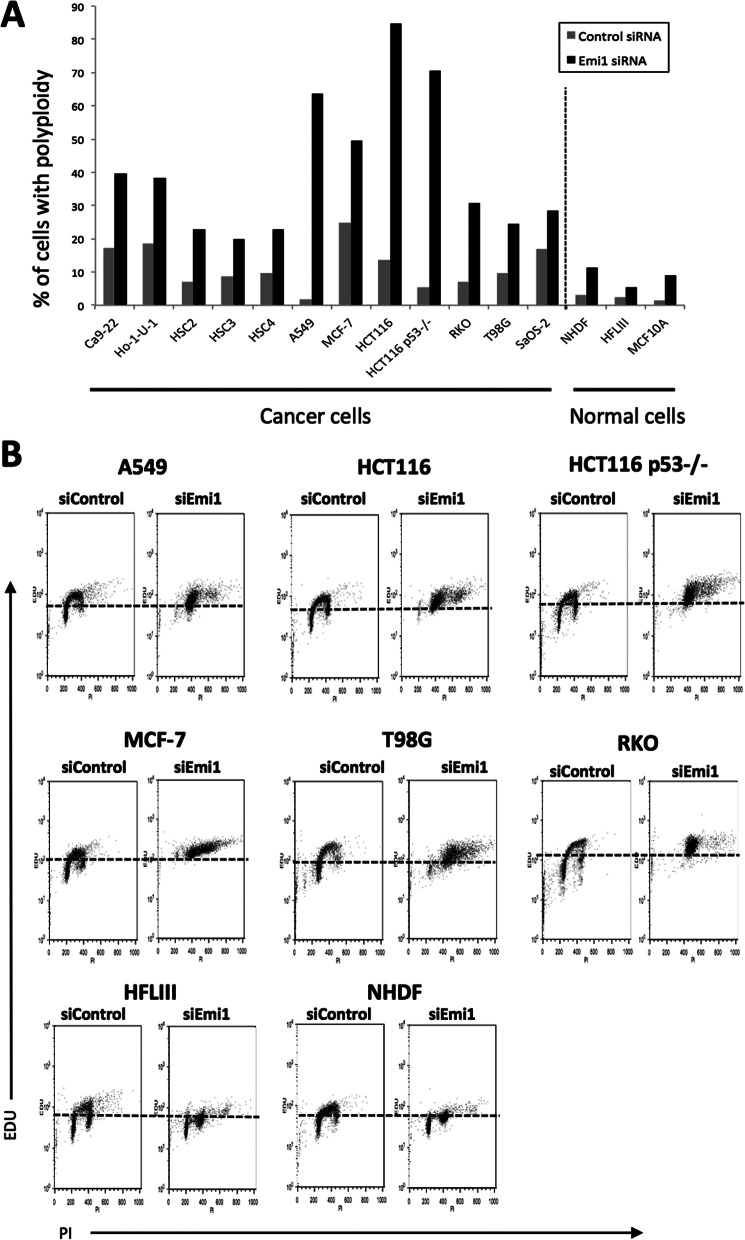
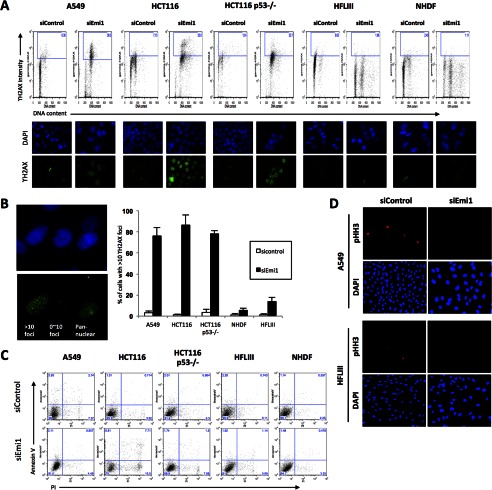
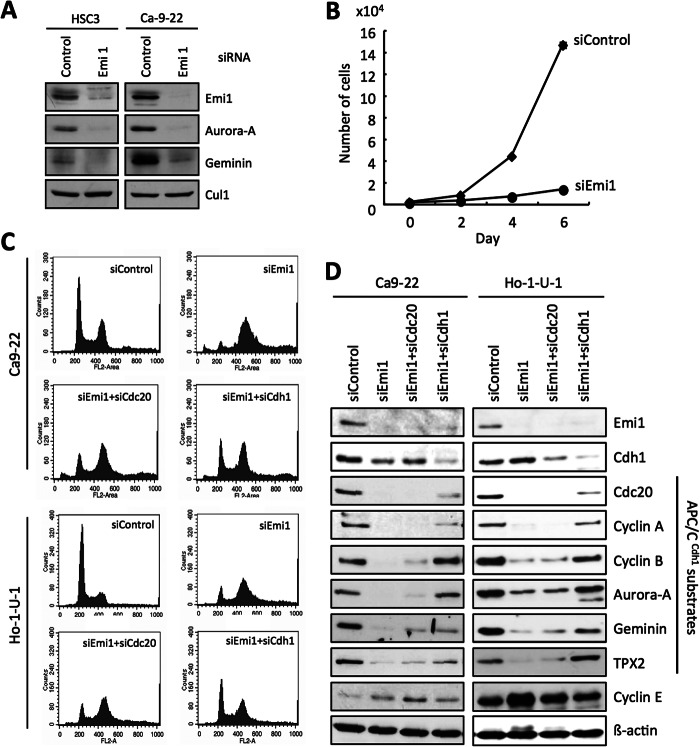
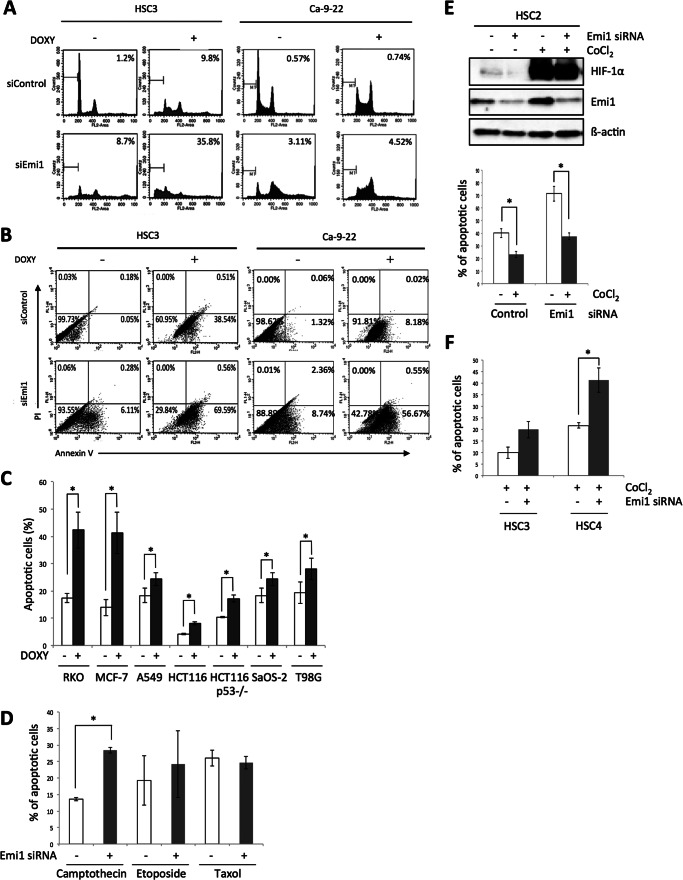
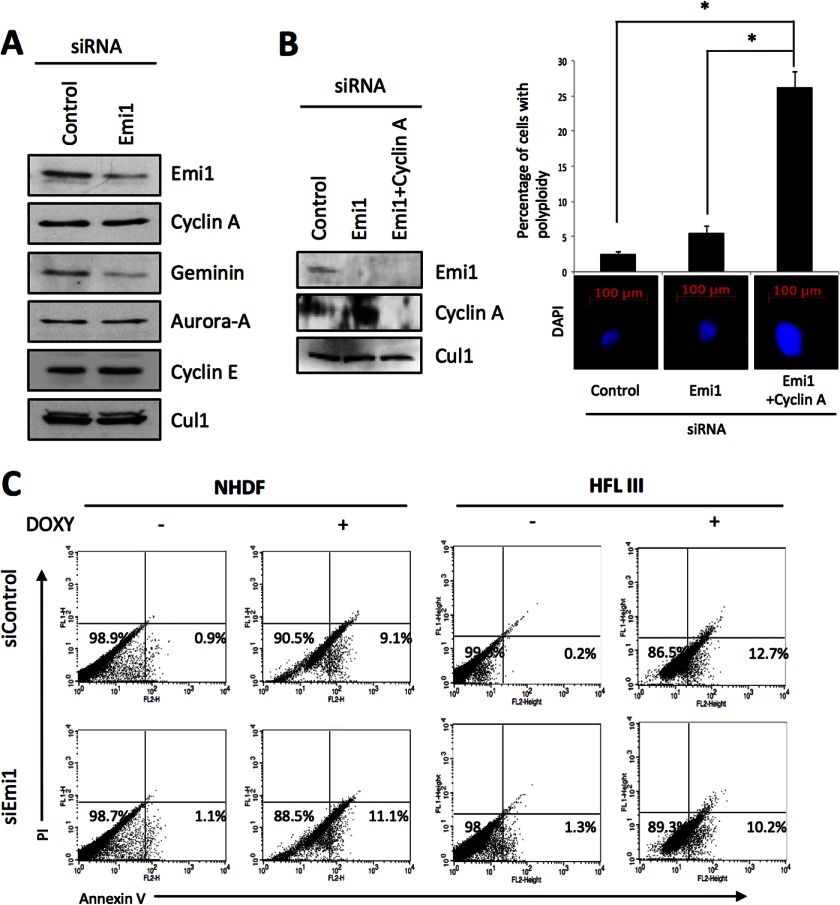
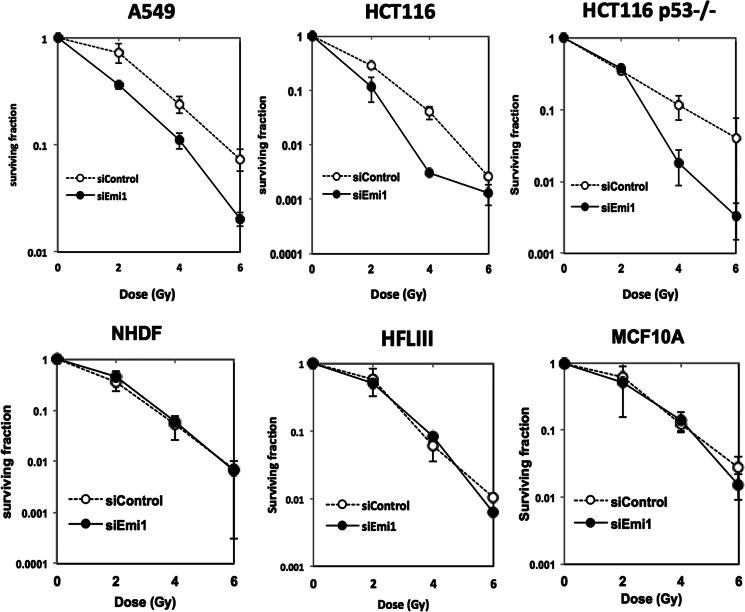
Chemotherapy and radiation in addition to surgery has proven useful in a number of different cancer types, but the effectiveness in normal tissue cannot be avoided in these therapies. To improve the effectiveness of these therapies selectively in cancer tissue is important for avoiding side effects. Early mitotic inhibitor 1 (Emi1) is known to have the function to inhibit anaphase-promoting complex/cyclosome ubiquitin ligase complex, which ubiquitylates the cell cycle-related proteins. It recently has been shown that Emi1 knockdown prevents transition from S to G2 phase by down-regulating geminin via anaphase-promoting complex/cyclosome activation. At present, anticancer drugs for targeting DNA synthesis to interfere with rapidly dividing cells commonly are used. As Emi1 depletion interferes with completion of DNA synthesis in cancer cells, we thought that Emi1 knockdown might enhance the sensitivity for anticancer agents. Here, we confirmed that Emi1 siRNA induced polyploidy for preventing transition from S to G2 phase in several cancer cell lines. Then, we treated Emi1 depleted cells with doxorubicin. Interestingly, increased apoptotic cells were observed after doxorubicin treatment in Emi1 siRNA-treated cancer cells. In addition, Emi1 depletion enhanced the sensitivity of x-ray irradiation in cancer cells. Importantly, synergistic effect of Emi1 knockdown in these combination therapies was not observed in normal cells. These results suggest that Emi1 siRNA can be a useful tool for enhancing of sensitivity of cancer cells to anticancer reagents and radiation.

Keywords: Anticancer Drug; Cancer; Cancer Therapy; Cell Cycle; DNA Damage; DNA Synthesis; Radiation Biology.


Figures

FIGURE 1.
FIGURE 1.
Emi1 overexpression in head and neck cancer. A, Emi1 mRNA expression was examined in 14 head and neck cancer cell lines, 2 normal cells, and 20 head and neck cancer tissues by RT-PCR. GAPDH was used as a control. B, mRNA level of Emi1 in different human tumors. All data were provided by the Oncomine database. Data from Refs. – were reanalyzed to show expression level of Emi1 in normal brain, glioblastoma, oligodendroglioma, anaplastic oligodendroglioma, astrocytoma, head and neck cancer, breast cancer, pancreatic ductal adenocarcinoma, cervical cancer, transitional cell carcinoma, and adult male germ cell tumor (–50). N, normal tissues; T, tumor tissues. C, immunohistochemical expression of Emi1 in head and neck cancer. D, correlation between Emi1 expression and APC substrates, cyclin A, and Skp2 expression. We examined the expression of Emi1, cyclin A, and Skp2 in head and neck cancer cases. A representative head and neck cancer case is shown. E, high expression of Emi1 is regulated by E2F1 in cancer cells. Expression of Emi1, E2F1, and cyclin E was examined by Western blot analysis in cancer cell lines (HSC2, HSC3, HSC4, Ca9–22, Ho-1-N-1, Ho-1-U-1, HeLa, A549, HCT116, HCT116 p53−/−, T98G, SaOS-2, MCF-7, and RKO) and normal cells (HFL III and NHDF). β-Actin expression was used as a loading control. The graph shows the mitotic index (%) and doubling time (h) in each cell. F, E2F1 siRNA was transfected into HCT116 and HSC2 cells. After 48 h of E2F1 siRNA treatment, cells were collected. Emi1 and E2F1 expression was examined by Western blot analysis. β-Actin expression was used as a loading control.
FIGURE 2.
FIGURE 2.
Emi1 knockdown in various cancer cell lines. Emi1 siRNA was transfected into various cancer cell lines, including head and neck cancer (Ca9–22, Ho-1-U-1, HSC2, HSC3, and HSC4), lung cancer (A549), breast cancer (MCF-7), colon cancer (RKO, HCT116, and HCT116 p53−/−), glioma (T98G), and osteosarcoma (SaOS-2). Em1i siRNA was also transfected into normal cells, including NHDF (dermal fibroblast), HFL III (fibroblasts), and MCF10A (mammary gland epithelial cells). The status of p53 was shown in each cell line. Cells were stained with DAPI to visualize the nuclei. Cell cycle distribution was determined by DNA content analysis after PI staining using a flow cytometer. Scale bar, 100 μm. IF, immunofluorescence.
FIGURE 3.
FIGURE 3.
Emi1 knockdown induced polyploidy in various cancer cell lines. A, the graph shows the percentage of cells with polyploidy in various cells. Percentage of cells with polyploidy was analyzed by a flow cytometer as shown in the figure. B, EdU staining was examined in various cells (A549, HCT116, HCT116 p53−/−, MCF-7, T98Gm RKO, HFLIII, and NHDF) by a flow cytometer after control siRNA or Emi1 siRNA treatment.
FIGURE 4.
FIGURE 4.
DNA damage in Emi1 depleted cancer cells. A, Emi1 knockdown induce γH2AX foci in tumor cells. Tumor cells (A549, HCT116, and HCT116 p53−/−) and normal cells (HFLIII and NHDF) were transfected with the indicated siRNA. After 48 h the transfection, cells were fixed and stained with anti-γH2AX antibodies. The levels of H2AX phosphorylation were detected using by the flow cytometer. Bivariate distributions representing expression of γH2AX versus DNA content of tumor and normal cells are shown. The levels of H2AX phosphorylation were also detected using by the fluorescence microscope. Representative images of γH2AX immunostaining (green) and nuclear staining (blue) in tumor or normal cells are shown. B, images on the left show typical images of cells presenting low (0∼10 foci/cell) or high levels of γH2AX foci or showing pan-nuclear staining γH2AX. The right graph indicates percentages of cells with high level (>10 foci/cell) of γH2AX foci. Results presented are the means of two independent experiments ± S.D. C, apoptosis was examined by annexin V staining using a flow cytometer in various cells (A549, HCT116, HCT116 p53−/−, HFLIII, and NHDF) after control siRNA or Emi1 siRNA treatment. D, expression of phosphohistone H3 (pHH3) was examined by the fluorescence microscope in A549 and HFLIII cells after control siRNA or Emi1 siRNA treatment. Cells were also stained with DAPI to visualize the nuclei.
FIGURE 5.
FIGURE 5.
DNA damage and polyploidy by Emi1 knockdown via activation of APC/CCdh1. A, Emi1 siRNA was transfected into HSC3 or Ca9–22 cells. After 48 h of Emi1 siRNA transfection, cells were collected. The indicated proteins were examined by Western blotting. B, Emi1 siRNA inhibits cell growth in head and neck cancer cells. Cell growth of Ho-1-U-1 cells after Emi1 siRNA transfection. After 48 h of transfection, cells were plated in 24-well plates. Cells were counted by Cell Counter at 0, 2, 4, and 6 days. We assayed three times. C, Emi1 siRNA induces polyploidy through activation of APC/C. Co-depletion of Cdh1 or Cdc20 with Emi1 by siRNA in Ca9–22 and Ho-1-U-1 cells. These cells were transfected with the indicated siRNAs. Cell cycle distribution was determined by DNA content analysis after PI staining using a flow cytometer. D, co-depletion of Cdh1 or Cdc20 with Emi1 by siRNA in Ca9–22 and Ho-1-U-1 cells. The indicated proteins including APC/CCdh1 substrates in siRNA-treated cells were examined by Western blotting.
FIGURE 6.
FIGURE 6.
Synergistic anticancer effect of Emi1 knockdown in combination with doxorubucin in cancer cells. A, after 48 h of Emi1 siRNA transfection, cells were treated with doxorubicin (0.5 μg/ml) for 12 h. Cells were fixed in 70% ethanol. Cell cycle distribution was determined by DNA content analysis after PI staining using a flow cytometer. For each sample, 20,000 events were stored. Percentage of the sub-G1 population is indicated. Representative data are shown. We performed three independent experiments. B, flow cytometric analysis of annexin V and PI staining in control and Emi1 siRNA-treated HSC3 or Ca9–22 cells after treatment with doxorubicin (0.5 μg/ml) for 12 h. We performed three independent experiments. C, synergistic anticancer effect of Emi1 knockdown in combination with doxorubucin (DOXY) in various cancer cells. Graph shows the average percentage of apoptotic cells in various cancer cells after treatment with doxorubicin (0.5 μg/ml) for 12 h. In this study, various cancer cell lines including lung cancer (A549), breast cancer (MCF-7), colon cancer (RKO, HCT116, and HCT116 p53−/−), glioma (T98G), and osteosarcoma (SaOS-2) were used. We performed three independent experiments. *, p < 0.05. D, synergistic anticancer effect of Emi1 knockdown in combination with camptothecin and etoposide but not with Taxol in HSC3 cells. The graph shows the average percentage of apoptotic cells in HSC3 cells after treatment with camtothecin (2 μm), etoposide (1 μm), or Taxol (1 nm) for 12–24 h. We performed two independent experiments. *, p < 0.05. E, hypoxic condition induced drug resistance. CoCl2 (100 μm) was treated for 6 h in HSC2 cells after 24 h of control or Emi1 siRNA transfection. Cells were collected and expression of HIF-1α and Emi1 was examined by Western blot analysis. β-Actin expression was used as a loading control. After 6 h of CoCl2 treatment, doxorubicin (DOXY; 0.5 μg/ml) was treated for 12 h in control or Emi1-depleted cells. Graph shows the average percentage of apoptotic cells (annexin V-positive cells) in HSC2 cells after treatment with doxorubicin for 12 h under normal or hypoxia condition (CoCl2 treatment). We performed two independent experiments. *, p < 0.05. F, synergistic anticancer effect of Emi1 knockdown in combination with doxorubicin in HSC3 and HSC4 cells under hypoxia conditions. The graph shows the average percentage of apoptotic cells (annexin V-positive cells) in HSC3 and HSC4 cells after treatment with doxorubicin for 12 h under normal or hypoxia conditions (CoCl2 treatment). We performed two independent experiments. *, p < 0.05.
FIGURE 7.
FIGURE 7.
Synergistic anticancer effect of Emi1 knockdown in combination with doxorubucin in normal cells. A, Emi1 or control siRNA was transfected into NHDF cells, and cells were collected after 48 h. The indicated proteins in siRNA-treated NHDF cells were examined by Western blotting. B, Emi1 siRNA and/or cyclin A siRNA were transfected into NHDF cells. The left panel shows the expression of Emi1 and cyclin A examined by Western blot analysis after 48 h of siRNA transfection. β-Actin expression was used as a loading control. The right panel shows DAPI staining and percentage of cells with polyploidy after Emi1 siRNA and/or cyclin A siRNA transfection. Cells were stained with DAPI to visualize the nuclei, and percentage of cells with polyploidy was determined by DNA content analysis after PI staining using a flow cytometer. *, p < 0.05. C, flow cytometric analysis of annexin V and PI staining in control and Emi1 siRNA treated NHDF or HFL III cells after treatment with doxorubucin (DOXY; 0.5 μg/ml) for 12 h. We performed three independent experiments.
FIGURE 8.
FIGURE 8.
Synergistic anticancer effect of Emi1 knockdown in combination with radiation. The effects of Emi1 knockdown on cell survival of A549, HCT116 wild type, and HCT116 p53−/−, HFLIII, NHDF, and MCF10A cells. Cells were transfected with Emi1 siRNA or negative control siRNA. After 48 h, cells were exposed to 0–6 gray x-rays. Cell survival was determined by a colony formation assay. Data shown are mean and S.E. of three independent experiments.

Similar articles

Cited by

References

    1. Jemal A., Bray F., Center M. M., Ferlay J., Ward E., Forman D. (2011) Global cancer statistics. CA-Cancer J. Clin. 61, 69–90 - PubMed
    1. Takimoto C. H., Calvo E. (2008) Principles of Oncologic Pharmacotherapy in Cancer Management: A Multidisciplinary Approach (Pazdur R., Wagman L. D., Camphausen K. A., Hoskins W. J., eds) 11th Ed pp. 1–9, Cmp United Business Media, Manhasset, NY
    1. Pommier Y., Leteurtre F., Fesen M. R., Fujimori A., Bertrand R., Solary E., Kohlhagen G., Kohn K. W. (1994) Cellular determinants of sensitivity and resistance to DNA topoisomerase inhibitors. Cancer Invest. 12, 530–542 - PubMed
    1. Dancey J. E., Bedard P. L., Onetto N., Hudson T. J. (2012) The genetic basis for cancer treatment decisions. Cell 148, 409–420 - PubMed
    1. Reed S. (2003) Ratchets and clocks: the cell cycle, ubiquitylation and protein turnover. Nat. Rev. Mol. Cell Biol. 4, 855–864 - PubMed

Publication types

MeSH terms