. 2013 Jun 14;288(24):17432-40.
doi: 10.1074/jbc.M112.444190. Epub 2013 May 3.

Suppression of autophagy in osteocytes mimics skeletal aging

Affiliations

Suppression of autophagy in osteocytes mimics skeletal aging

Melda Onal et al. J Biol Chem. .

Abstract

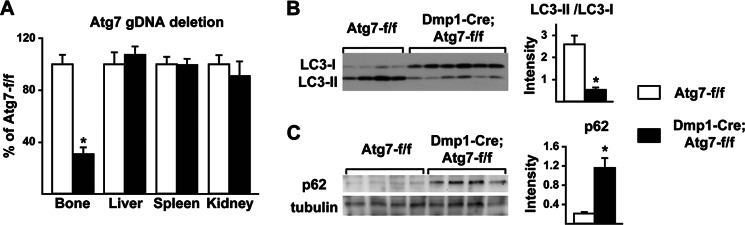
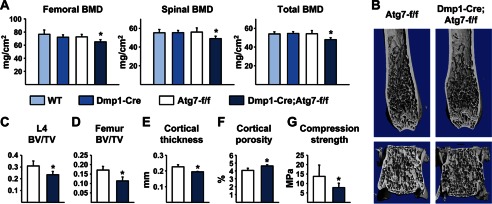
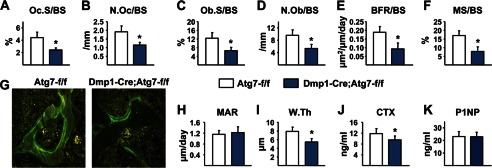
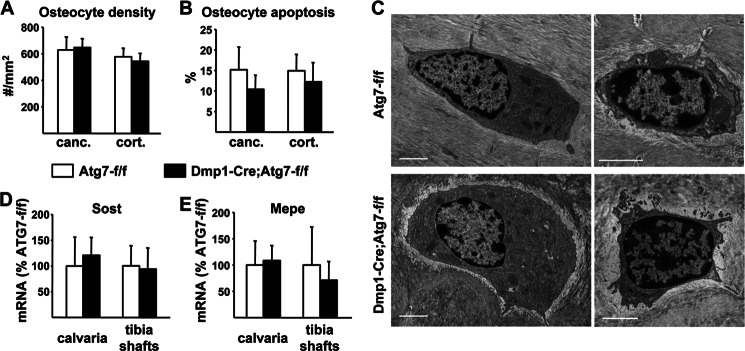
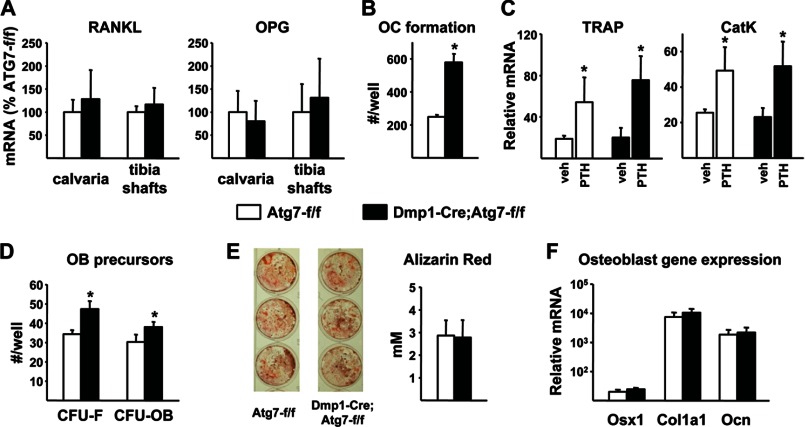
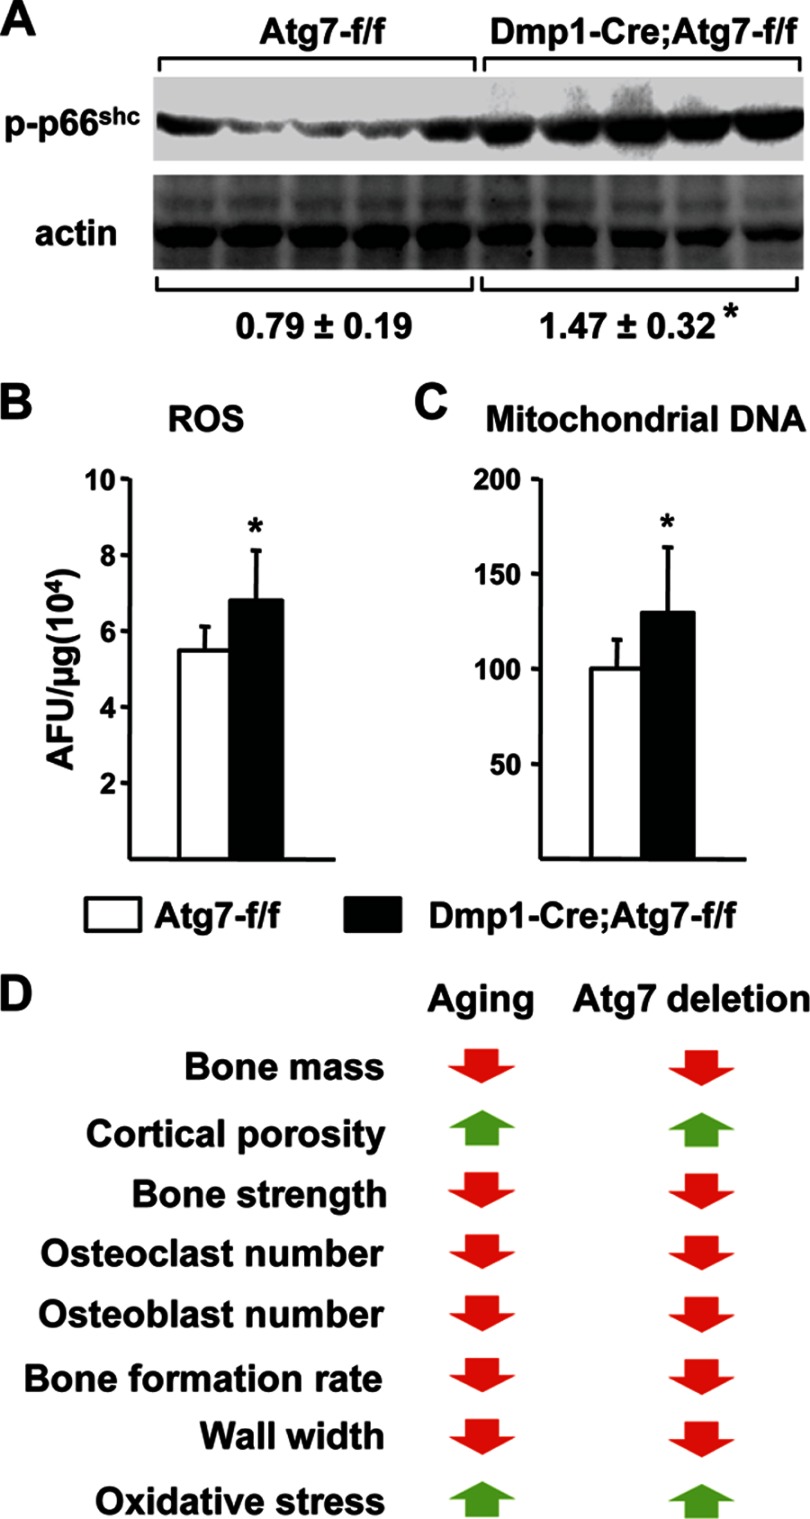
Bone mass declines with age but the mechanisms responsible remain unclear. Here we demonstrate that deletion of a conditional allele for Atg7, a gene essential for autophagy, from osteocytes caused low bone mass in 6-month-old male and female mice. Cancellous bone volume and cortical thickness were decreased, and cortical porosity increased, in conditional knock-out mice compared with control littermates. These changes were associated with low osteoclast number, osteoblast number, bone formation rate, and wall width in the cancellous bone of conditional knock-out mice. In addition, oxidative stress was higher in the bones of conditional knock-out mice as measured by reactive oxygen species levels in the bone marrow and by p66(shc) phosphorylation in L6 vertebra. Each of these changes has been previously demonstrated in the bones of old versus young adult mice. Thus, these results demonstrate that suppression of autophagy in osteocytes mimics, in many aspects, the impact of aging on the skeleton and suggest that a decline in autophagy with age may contribute to the low bone mass associated with aging.

Keywords: Aging; Autophagy; Bone; Mouse; Osteocyte; Remodeling.


Figures

FIGURE 1.
FIGURE 1.
Atg7 deletion suppresses autophagy in osteocytes. A, quantitative PCR of loxP-flanked genomic DNA, normalized to a control locus, using genomic DNA isolated from osteocyte-enriched femoral cortical bone or the indicated soft tissues (n = 7–9 male 6-month-old mice per group). B, immunoblot of LC3 in protein extracted from osteocyte-enriched femoral cortical bone. The ratio LC3-II to LC3-I based on quantification of the bands in the immunoblot is shown on the right (n = 4–6 male 2-month-old mice per group). C, immunoblot of p62 in protein extracted from osteocyte-enriched femoral cortical bone. The intensity of the p62 band normalized to tubulin is shown on the right (n = 4 male 2-month-old mice per group). *, p < 0.05 using Student's t test.
FIGURE 2.
FIGURE 2.
Low bone mass in Dmp1-Cre;Atg7-f/f mice. A, BMD measured by DEXA in the femur, spine, and whole body of wild type (WT), Dmp1-Cre, Atg7-f/f, and Dmp1-Cre;Atg7-f/f littermates. B, high resolution μCT images of the distal femur and L4 vertebra. C, bone volume per tissue volume (BV/TV) of cancellous bone in L4 vertebra. D–F, cancellous BV/TV in the distal femur, cortical thickness at the femoral diaphysis, and cortical porosity at the femoral diaphysis. G, compression strength (stress) of L4 vertebra. All values in Fig. 2 were determined in 6-month-old male mice (n = 6–9 mice per group). *, p < 0.05 using two-way ANOVA (A) or Student's t test (C–G).
FIGURE 3.
FIGURE 3.
Dmp1-Cre;Atg7-f/f mice have low bone turnover. A–I, histomorphometric analysis of cancellous bone in lumbar vertebra 1–3. A and B, osteoclast surface per bone surface (Oc.S/BS) and osteoclast number per bone surface (N.Oc/BS). C and D, osteoblast surface per bone surface (Ob.S/BS) and osteoblast number per bone surface (N.Ob/BS). E and F, bone formation rate per bone surface (BFR/BS) and mineralizing surface per bone surface (MS/BS). G, photomicrographs of calcein-labeled surfaces in vertebral cancellous bone. H and I, mineral apposition rate (MAR) and wall thickness (W.Th). J and K, CTX and P1NP measured in blood plasma. All values in Fig. 3 were determined in 6-month-old male mice (n = 6–9 mice per group). *, p < 0.05 using Student's t test.
FIGURE 4.
FIGURE 4.
Osteocyte formation in Dmp1-Cre;Atg7-f/f mice. A, osteocyte density measured in cancellous (canc.) and cortical (cort.) bone of lumbar vertebra 1–3 of 6-month-old male mice (n = 6 per group). B, osteocyte apoptosis measured in cancellous (canc.) and cortical (cort.) bone of the femur of 6-month-old female mice (6 per group). C, TEM images of newly-embedded osteocytes (left) or mature osteoctyes (right) in femoral cortical bone from 2-month-old male mice; bar, 2 μm. D and E, quantitative RT-PCR of Sost and Mepe mRNA in calvaria and tibia shafts from 3-month-old male mice (n = 6–11 per group).
FIGURE 5.
FIGURE 5.
Osteoclast and osteoblast differentiation. A, quantitative RT-PCR of RANKL and OPG mRNA in calvaria and tibia shafts from 3-month-old male mice (n = 6–11 per group). B, osteoclast (oc) formation quantified in bone marrow from 12-month-old female mice (n = 3 wells per group). C, quantitative RT-PCR of TRAP and cathepsin K (CatK) in bone marrow cultures treated with vehicle or PTH for 11 days to induce osteoclast formation (n = 4 wells per group). D, CFU-F and CFU-OB in bone marrow cells from 12-month-old female mice (n = 3 wells/group). E, Alzarin Red staining and quantification of primary bone marrow cells cultured for 21 days in osteoblast differentiation medium (n = 3 wells/group). F, quantitative RT-PCR of osterix-1 (Osx1), collagen1a1 (Col1a1), and osteocalcin (Ocn) in 12-day primary bone marrow cultures (n = 3 wells/group). *, p < 0.05 using Student's t test.
FIGURE 6.
FIGURE 6.
Oxidative stress in bone from Dmp1-Cre;Atg7-f/f mice. A, immunoblot of phospho-p66shc in lumbar vertebra 6 from 3-month-old male mice (n = 5 per group). B, ROS in bone marrow isolated from tibiae of 3-month-old male mice (n = 5 per group). C, ratio of mitochondrial:nuclear DNA determined by Taqman PCR of DNA isolated from osteocyte-enriched femoral cortical bone of 6-month-old male mice (n = 7–9 per group). D, comparison of changes in old mice and mice lacking Atg7 in osteocytes. *, p < 0.05 using Student's t test (A and B) or Mann-Whitney Rank Sum test (C).

Similar articles

Cited by

  • Regulatory mechanisms of autophagy-related ncRNAs in bone metabolic diseases.
    Yan B, Li Z, Su H, Xue H, Qiu D, Xu Z, Tan G. Yan B, et al. Front Pharmacol. 2023 Dec 7;14:1178310. doi: 10.3389/fphar.2023.1178310. eCollection 2023. Front Pharmacol. 2023. PMID: 38146458 Free PMC article. Review.
  • Skeletal Aging.
    Sfeir JG, Drake MT, Khosla S, Farr JN. Sfeir JG, et al. Mayo Clin Proc. 2022 Jun;97(6):1194-1208. doi: 10.1016/j.mayocp.2022.03.011. Mayo Clin Proc. 2022. PMID: 35662432 Free PMC article. Review.
  • Cold exposure-induced plasma exosomes impair bone mass by inhibiting autophagy.
    Lei LM, Li FX, Lin X, Xu F, Shan SK, Guo B, Zheng MH, Tang KX, Wang Y, Xu QS, Ouyang WL, Duan JY, Wu YY, Cao YC, Zhou ZA, He SY, Wu YL, Chen X, Lin ZJ, Pan Y, Yuan LQ, Li ZH. Lei LM, et al. J Nanobiotechnology. 2024 Jun 23;22(1):361. doi: 10.1186/s12951-024-02640-z. J Nanobiotechnology. 2024. PMID: 38910236 Free PMC article.
  • Autophagy in major human diseases.
    Klionsky DJ, Petroni G, Amaravadi RK, Baehrecke EH, Ballabio A, Boya P, Bravo-San Pedro JM, Cadwell K, Cecconi F, Choi AMK, Choi ME, Chu CT, Codogno P, Colombo MI, Cuervo AM, Deretic V, Dikic I, Elazar Z, Eskelinen EL, Fimia GM, Gewirtz DA, Green DR, Hansen M, Jäättelä M, Johansen T, Juhász G, Karantza V, Kraft C, Kroemer G, Ktistakis NT, Kumar S, Lopez-Otin C, Macleod KF, Madeo F, Martinez J, Meléndez A, Mizushima N, Münz C, Penninger JM, Perera RM, Piacentini M, Reggiori F, Rubinsztein DC, Ryan KM, Sadoshima J, Santambrogio L, Scorrano L, Simon HU, Simon AK, Simonsen A, Stolz A, Tavernarakis N, Tooze SA, Yoshimori T, Yuan J, Yue Z, Zhong Q, Galluzzi L, Pietrocola F. Klionsky DJ, et al. EMBO J. 2021 Oct 1;40(19):e108863. doi: 10.15252/embj.2021108863. Epub 2021 Aug 30. EMBO J. 2021. PMID: 34459017 Free PMC article. Review.
  • Consequences of Aging on Bone.
    Zhang L, Guan Q, Wang Z, Feng J, Zou J, Gao B. Zhang L, et al. Aging Dis. 2023 Nov 20;15(6):2417-2452. doi: 10.14336/AD.2023.1115. Aging Dis. 2023. PMID: 38029404 Free PMC article.

References

    1. Manolagas S. C. (2000) Birth and death of bone cells: Basic regulatory mechanisms and implications for the pathogenesis and treatment of osteoporosis. Endocr. Rev. 21, 115–137 - PubMed
    1. Riggs B. L., Melton L. J., Robb R. A., Camp J. J., Atkinson E. J., McDaniel L., Amin S., Rouleau P. A., Khosla S. (2008) A population-based assessment of rates of bone loss at multiple skeletal sites: evidence for substantial trabecular bone loss in young adult women and men. J. Bone Miner. Res. 23, 205–214 - PMC - PubMed
    1. Almeida M., Han L., Martin-Millan M., Plotkin L. I., Stewart S. A., Roberson P. K., Kousteni S., O'Brien C. A., Bellido T., Parfitt A. M., Weinstein R. S., Jilka R. L., Manolagas S. C. (2007) Skeletal involution by age-associated oxidative stress and its acceleration by loss of sex steroids. J. Biol. Chem. 282, 27285–27297 - PMC - PubMed
    1. Yang Z., Klionsky D. J. (2010) Eaten alive: a history of macroautophagy. Nat Cell Biol. 12, 814–822 - PMC - PubMed
    1. Levine B., Kroemer G. (2008) Autophagy in the pathogenesis of disease. Cell 132, 27–42 - PMC - PubMed

Publication types

MeSH terms

Substances

LinkOut - more resources