. 2013 Jun 21;288(25):18047-57.
doi: 10.1074/jbc.M113.453688. Epub 2013 May 3.

p39, the primary activator for cyclin-dependent kinase 5 (Cdk5) in oligodendroglia, is essential for oligodendroglia differentiation and myelin repair

Affiliations

p39, the primary activator for cyclin-dependent kinase 5 (Cdk5) in oligodendroglia, is essential for oligodendroglia differentiation and myelin repair

Andrew N Bankston et al. J Biol Chem. .

Abstract

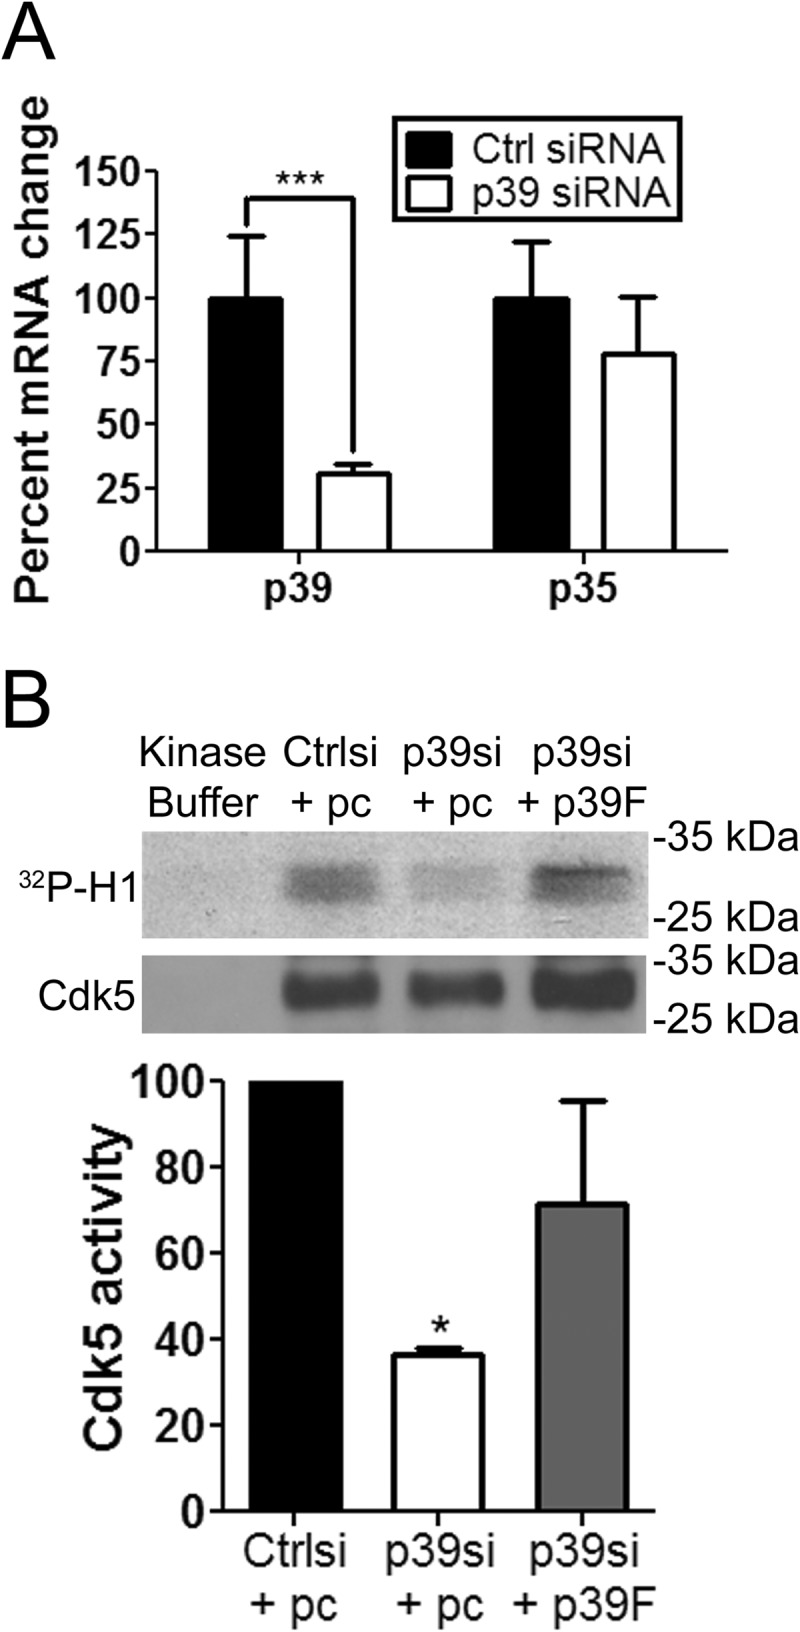
Cyclin-dependent kinase 5 (Cdk5) plays key roles in normal brain development and function. Dysregulation of Cdk5 may cause neurodegeneration and cognitive impairment. Besides the well demonstrated role of Cdk5 in neurons, emerging evidence suggests the functional requirement of Cdk5 in oligodendroglia (OL) and CNS myelin development. However, whether neurons and OLs employ similar or distinct mechanisms to regulate Cdk5 activity remains elusive. We report here that in contrast to neurons that harbor high levels of two Cdk5 activators, p35 and p39, OLs express abundant p39 but negligible p35. In addition, p39 is selectively up-regulated in OLs during differentiation along with elevated Cdk5 activity, whereas p35 expression remains unaltered. Specific knockdown of p39 by siRNA significantly attenuates Cdk5 activity and OL differentiation without affecting p35. Finally, expression of p39, but not p35, is increased during myelin repair, and remyelination is impaired in p39(-/-) mice. Together, these results reveal that neurons and OLs harbor distinct preference of Cdk5 activators and demonstrate important functions of p39-dependent Cdk5 activation in OL differentiation during de novo myelin development and myelin repair.

Keywords: Cyclin-dependent Kinase 5 (Cdk5); Differentiation; Gene Regulation; Glia; Myelin; Neurons; Oligodendroglia; p39.


Figures

FIGURE 1.
FIGURE 1.
Differential Cdk5 activator expression in neurons and OLs. A, lysates from WT and p39−/− brain, primary cultured rat neurons (N), astrocytes (A), OLs, and CG4 cells were subjected to immunoblot analysis of p39, p35, Cdk5, and eIF5α. All cells underwent 5 days of differentiation in culture. p39 antibody specificity was confirmed by the absence of signal in p39−/− lysates. B, densitometer readings of p35 (left) and p39 (right) proteins are normalized to the housekeeping protein eIF5α as a loading reference. The normalized level of p35 and p39 protein in neurons on the same immunoblot was set as 100%, respectively, for estimation of relative abundance of these proteins in neurons and glia. C, total RNA was extracted from cultured neurons (N), OLs, and CG4 cells at DIV5, and qRT-PCR was performed for p35, p39, and GAPDH. The levels of p35 (left) and p39 (right) mRNAs relative to the GAPDH mRNA are graphically displayed. The relative mRNA level in neurons was set as 100% in each replicate experiment for normalization. For B and C, three independent batches of cultures were used for immunoblots (n = 3). The data are reported as the mean ± S.E. p < 0.0005, one-way ANOVA; **, p < 0.01; ***, p < 0.001, Tukey's post test.
FIGURE 2.
FIGURE 2.
Active translation of p39 mRNA and translation suppression of p35 mRNA in CG4 cells. A and B, cytoplasmic RNA was isolated from CG4 cells and fractionated on a linear sucrose gradient in the presence of MgCl2 (A) or EDTA (B). Top, shown are plots of absorption at 254 nm (OD254) of linear sucrose gradients fractions. The direction of sedimentation as well as absorption peaks for messenger ribonucleoprotein complexes, 40 S and 60 S ribosomal subunits, 80 S monoribosome, and translating polyribosomes are indicated. Bottom, shown are representative images of semi-quantitative RT-PCR products of p39 and p35 mRNA in each gradient fraction on agarose gel after electrophoresis. mRNP, messenger ribonucleoprotein.
FIGURE 3.
FIGURE 3.
Selective up-regulation of p39 during OL differentiation and myelin development. A, lysates from primary cultured rat oligodendrocytes at the indicated days of differentiation were subjected to immunoblot analysis of p39, p35, Cdk5, and eIF5α. A representative blot is shown (left). Band intensities were quantified by densitometry, and the levels of p39 relative to eIF5α from immunoblots in three batches of cultured oligodendrocytes at DIV1 and DIV5 (n = 3) are shown (right). The densitometer reading in DIV1 cells are set as 100% to assess percent changes from independent experiments. The data are reported as the mean ± S.E. **, p < 0.01 by two-tailed t test. B, lysates from optic nerves, highly enriched of myelinating oligodendrocytes, were isolated at the indicated postnatal days during myelin development and subjected to immunoblot analysis of p39, p35, Cdk5, and eIF5α. C and D, total RNA was extracted from primary cultured rat oligodendrocytes harvested at the indicated days of differentiation (C) and FACS-isolated oligodendrocytes from mouse brains during myelin development at the indicated postnatal days (D). Three independent samples were collected (n = 3). qRT-PCR was performed for p35, p39, and GAPDH. The levels of p35 and p39 relative to GAPDH are shown. qRT-PCR reading in day 1 samples are set as 100%. The data are reported as the mean ± S.E. p < 0.01, two-way ANOVA; ***, p < 0.001, Bonferroni's post test.
FIGURE 4.
FIGURE 4.
p39 activates Cdk5 in OLs. A, total RNA was extracted from three independent experiments in which CG4 cells were transfected with p39 siRNA or a negative control-siRNA (n = 3). qRT-PCR was performed for p35, p39, and GAPDH mRNA. The levels of p35 and p39 mRNA relative to GAPDH mRNA are shown. qRT-PCR reading in control-siRNA-treated cells were set as 100%. The data are reported as the mean ± S.E. p < 0.001, two-way ANOVA; ***, p < 0.001, Bonferroni's post test. B, Cdk5 was immunoprecipitated from lysates of CG4 cells cotransfected with negative control-siRNA and empty vector (pc), p39-siRNA and empty vector, or p39-siRNA and p39-FLAG (p39F). The immunoprecipitated Cdk5 or kinase reaction buffer alone was incubated with histone H1 and [γ-32P] ATP in a kinase reaction. Reactions were resolved on SDS-PAGE and transferred to PVDF membranes. Top, the same membrane was used to detect H1 phosphorylation by autoradiography and immunoprecipitated Cdk5 by immunoblot analysis. Bottom, band intensities were quantified by densitometry, and the levels of H1 phosphorylation relative to Cdk5 protein are shown. The normalized Cdk5 activity in control-siRNA-treated cells was set as 100% for each experiment. The data are reported as the mean ± S.E. n = 3; p < 0.05, one-way ANOVA; *, p < 0.05, Tukey's post test.
FIGURE 5.
FIGURE 5.
p39-dependent Cdk5 activation is essential for OL differentiation. A, p39-siRNA or control-siRNA were cotransfected with a GFP construct into CG4 cells in three independent experiments (n = 3). At 0, 1, and 2 days of differentiation, images of GFP+ cells (left) were captured from more than 50 randomly selected cells in each transfected culture, and the percentage of total cells harboring process complexity up to primary, secondary, or tertiary processes were determined and plotted for each day of differentiation (right). B, Cdk5-siRNA or control-siRNA were cotransfected with a GFP construct into CG4 cells. Analysis was performed as described for (A). For A and B, the data are reported as the mean ± S.E. n = 3; p < 0.01, two-way ANOVA; *, p < 0.05; **, p < 0.01; ***, p < 0.001, Bonferroni's post test. Scale bar, 50 μm.
FIGURE 6.
FIGURE 6.
Loss of p39 delays oligodendroglia development in vivo. A, lysates from WT and p39−/− mouse brains at postnatal day 14 were subjected to immunoblot analysis of MBP and eIF5α. B, brain slices from WT and p39−/− corpus callosum at postnatal day 6 were stained for MBP. Representative images of MBP+ cells are shown. Scale bar, 10 μm. C, brain slices from WT and p39−/− mice at postnatal day 6 were stained for MBP. The total number of MBP+ cells in the corpus callosum from three adjacent slices at comparable anatomic position from each brain was quantified. Four pairs of WT and p39−/− mice were examined. The data are reported as the mean ± S.E. (n = 4; *, p < 0.05 by two-tailed t test).
FIGURE 7.
FIGURE 7.
p35 is up-regulated in p39−/− optic nerves at the peak of myelination, and p39−/− young adults display normal MBP expression and myelin formation. A, optic nerves were isolated from multiple WT and p39−/− mice at postnatal day 20 and combined for each genotype to prepare protein lysates to detect the low levels of p35 in WT. Immunoblot analysis of p35 and eIF5α were carried out. Densitometer reading of p35 band intensity was normalized to that of eIF5α. B, lysates from the same preparations used in A were subjected to a parallel immunoblot analysis for MBP and eIF5α. C, top, shown are representative images of electron micrographs of cross-sections of corpus callosum from 1-month-old WT and p39−/− mice. Bottom, shown is the average g-ratio of axons in the corpus callosum of 1-month-old WT and p39−/− mice. The data are reported as the mean ± S.E.
FIGURE 8.
FIGURE 8.
p39 is selectively up-regulated during remyelination and required for myelin repair. A–C, mice expressing EGFP under the oligodendroglia-specific PLP promoter were subjected to the following diet paradigms: a normal diet for 6 weeks (Normal), a cuprizone diet for 3 weeks (3 wk DM), or a cuprizone diet for 3 weeks followed by a normal diet for 3 additional weeks (3 + 3 wk RM). A, top, brain slices containing the corpus callosum were stained for MBP. Middle, shown are EGFP signals in OLs and on axonal tracts. Bottom, brain slices containing the corpus callosum were stained for the OL precursor marker Olig2. Scale bar, 100 μm for MBP and EFGP images, 20 μm for Olig2 images. B, a–d, immunofluorescence of p39 (red) in the corpus callosum of normal (a), 3 weeks DM (b), and 3 + 3 weeks RM (c and d) mice. DAPI staining (blue) marks nuclei. a–c, OLs are EGFP+, and increased p39 expression (red) is indicated by arrows. d, shown is immunofluorescence of p39 (red) and the mature OL marker CC1 (green). Scale bar, 20 μm. C, top, corpus callosum of normal, 3 weeks DM, and 3 + 3 weeks RM mice were dissected, and lysates were subjected to immunoblot analysis of p39 and eIF5α. Bottom left, protein band intensities were quantified by densitometry, and the levels of p39 were normalized to that of eIF5α. The level of p39 protein in normal was set as 100% and graphically displayed. Bottom right, total RNA was extracted from dissected corpus callosum of normal, 3 weeks DM, and 3 + 3 weeks RM mice, and qRT-PCR was performed for p39 and GAPDH. The levels of p39 mRNA relative to GAPDH mRNA were calculated, and the level of p39 mRNA in normal was set as 100%. The data are reported as the mean ± S.E. (n = 3). D, top, shown is an immunoblot analysis of p35 and eIF5α in dissected corpus callosum. Bottom, protein band intensities were quantified by densitometry, and the levels of p35 relative to eIF5α are shown. Normal was set as 100%. The data are reported as the mean ± S.E. (n = 3). E, WT and p39−/− mice expressing EGFP under the oligodendroglia-specific PLP promoter were unilaterally injected with lysolecithin to induce demyelination. Top, the demyelinated lesion was visualized by the lack of PLP-EGFP signals 5 days post lysolecithin injection (DPL5). Arrows indicate the site of injection. Bottom, myelin repair was assessed 21 days post lysolecithin injection (DPL21). Arrowheads indicate the injection tracks, which are still visible. Scale bar, 500 μm. F, brain slices containing corpus callosum from WT and p39−/− mice at 21 days post lysolecithin injection were stained for MBP. High magnification images of MBP staining and EGFP+ cells are shown. Scale bar, 50 μm.

Similar articles

Cited by

References

    1. Fields R. D. (2008) White matter in learning, cognition, and psychiatric disorders. Trends Neurosci. 31, 361–370 - PMC - PubMed
    1. Ren Y., Wang H., Xiao L. (2013) Improving myelin/oligodendrocyte-related dysfunction. A new mechanism of antipsychotics in the treatment of schizophrenia? Int. J. Neuropsychopharmacol. 16, 691–700 - PubMed
    1. Gold B. T., Johnson N. F., Powell D. K., Smith C. D. (2012) White matter integrity and vulnerability to Alzheimer's disease. Preliminary findings and future directions. Biochim. Biophys. Acta 1822, 416–422 - PMC - PubMed
    1. Bankston A. N., Mandler M. D., Feng Y. (2013) Oligodendroglia and neurotrophic factors in neurodegeneration. Neurosci. Bull. 29, 216–228 - PMC - PubMed
    1. Su S. C., Tsai L.-H. (2011) Cyclin-dependent kinases in brain development and disease. Annu. Rev. Cell Dev. Biol. 27, 465–491 - PubMed

Publication types

MeSH terms