

doi: 10.1080/15583724.2012.751399.
Porous Shape Memory Polymers
Affiliations
- PMID: 23646038
- PMCID: PMC3639501
- DOI: 10.1080/15583724.2012.751399
Item in Clipboard
Porous Shape Memory Polymers
Polym Rev (Phila Pa).
.
Abstract
Porous shape memory polymers (SMPs) include foams, scaffolds, meshes, and other polymeric substrates that possess porous three-dimensional macrostructures. Porous SMPs exhibit active structural and volumetric transformations and have driven investigations in fields ranging from biomedical engineering to aerospace engineering to the clothing industry. The present review article examines recent developments in porous SMPs, with focus given to structural and chemical classification, methods of characterization, and applications. We conclude that the current body of literature presents porous SMPs as highly interesting smart materials with potential for industrial use.
Figures
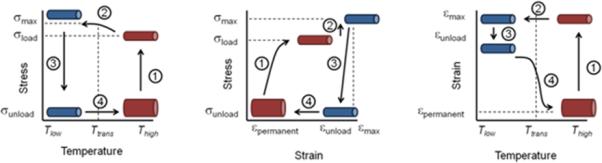
Illustration of the shape memory cycle in stress/temperature, stress/strain, and strain/temperature planes. Step 1 is isothermal loading, Step 2 is cooling at constant load, Step 3 is isothermal unloading, and Step 4 is shape recovery upon heating under load-free conditions.
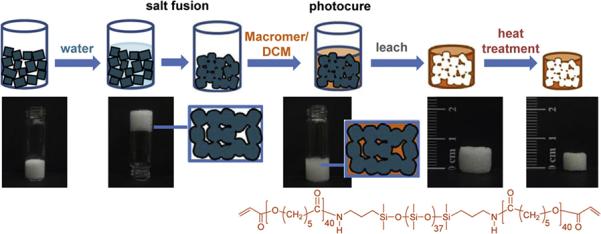
Schematic of salt fusion and leaching method of three-dimensional foam fabrication. The figure is reproduced with permission from [26].
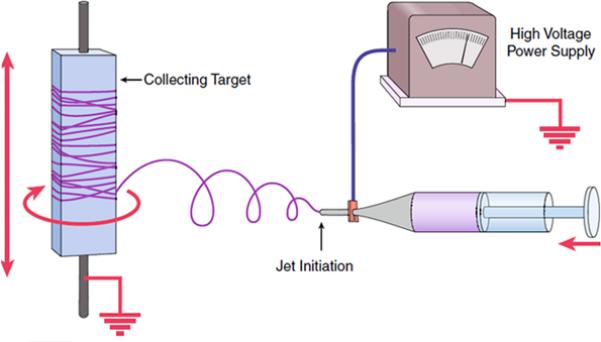
Illustration of an electrospinning setup. The figure is reproduced with permission from [9].
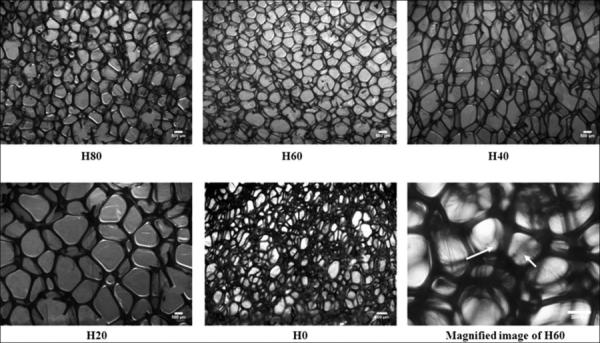
Cell structure of thermoset polyurethane gas blown foams as obtained from optical microscopy of thin slices of the material. Scale bar is 500 um. The images are reproduced with permission from [35].
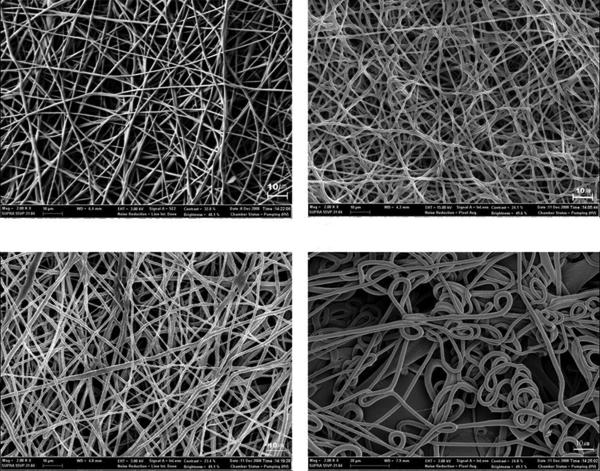
(a) Electrospun web mesh structural comparison for polyurethane SMP electrospun in varying percent solution obtained by field emission scanning electron microscopy. Scale bar is 10 μm. The images are reproduced with permission from [61]. (b) Porous PCL-polyurethane SMP foam scaffold obtained by salt leaching and image of salt particles obtained by field emission scanning electron microscopy. Scale bar is 100 μm. The images are reproduced with permission from [27].
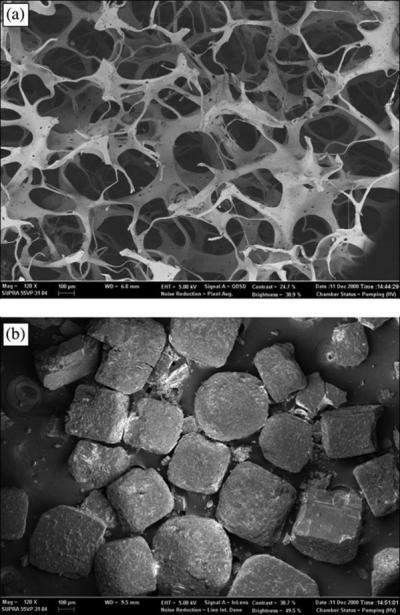
(a) Electrospun web mesh structural comparison for polyurethane SMP electrospun in varying percent solution obtained by field emission scanning electron microscopy. Scale bar is 10 μm. The images are reproduced with permission from [61]. (b) Porous PCL-polyurethane SMP foam scaffold obtained by salt leaching and image of salt particles obtained by field emission scanning electron microscopy. Scale bar is 100 μm. The images are reproduced with permission from [27].
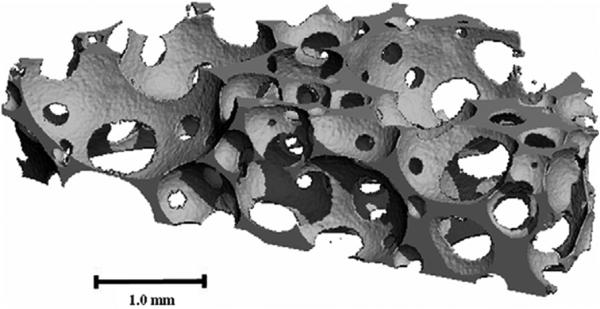
A 3D X-ray micro CT image of an epoxy based SMP foam. The image is reproduced with permission from [49].
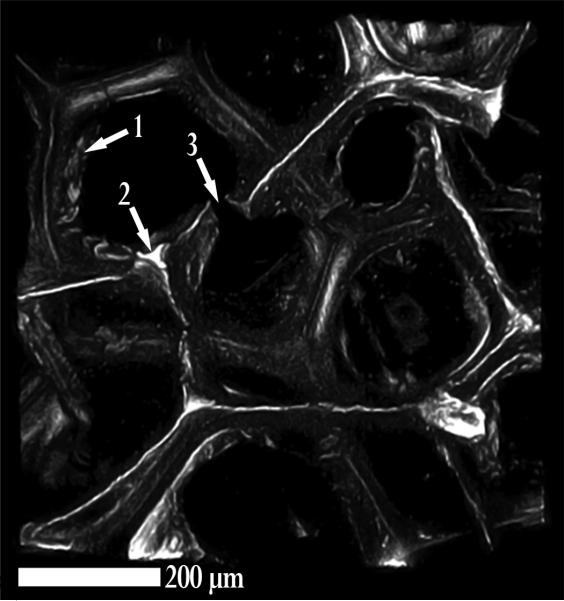
A 3D confocal image of a polyurethane low density foam based on the H60 composition of [35] llustrates the pore network, a reticulated membrane (arrow 1), strut crossection (arrow 2), and a damaged strut (arrow 3) of the polymer foam. The resolution of the technique is approximately 1,1,5 micrometers (x,y,z: z depth). The scale bar is 200 μm.
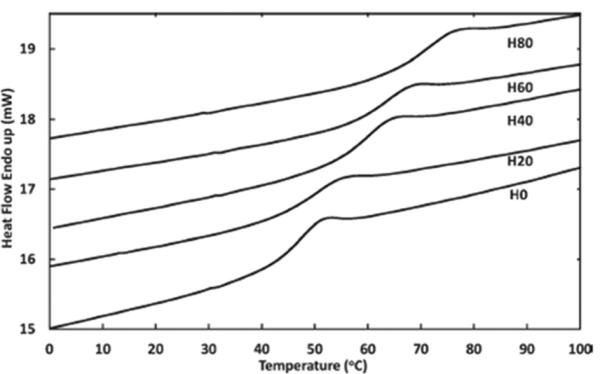
(a) DSC curves illustrating Tg tunability of thermoset polyurethane SMP foams. This image is reproduced with permission from [35]. (b) Shape recovery vs. time isotherms illustrating tunability of Ttrans. This image is reproduced with permission from [73].
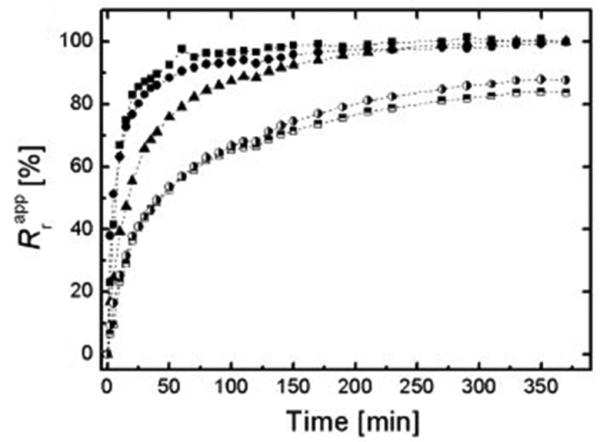
(a) DSC curves illustrating Tg tunability of thermoset polyurethane SMP foams. This image is reproduced with permission from [35]. (b) Shape recovery vs. time isotherms illustrating tunability of Ttrans. This image is reproduced with permission from [73].
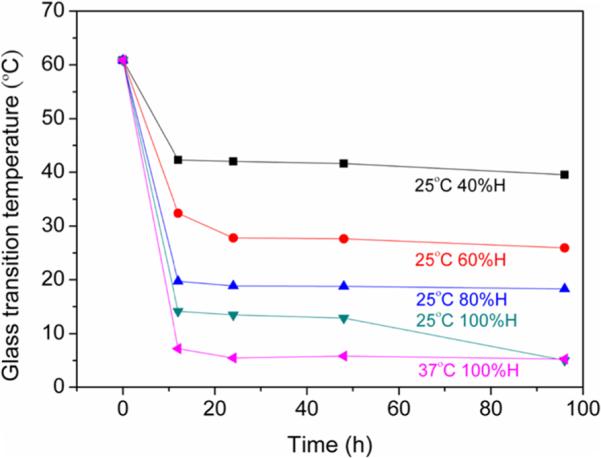
Effect of moisture absorption on Tg of thermoset polyurethane SMP foam. The image is reproduced with permission from [60].
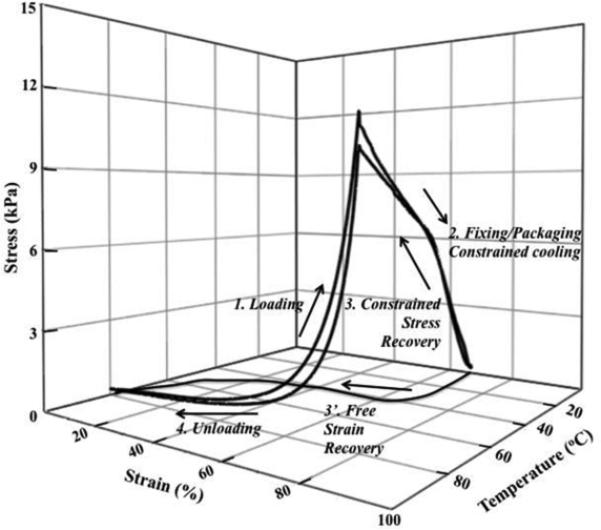
Steps representing the shape memory thermo-mechanical cycle. The figure is reproduced with permission from [35].
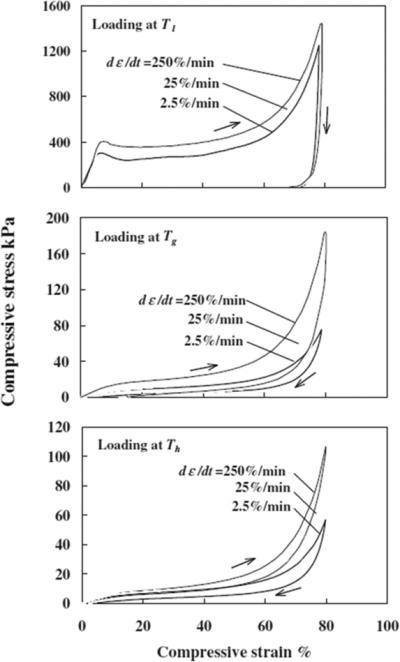
(a) The evolution of stress with respect to compressive strain at different temperatures and strain rates on Mitsubishi MFNo21 foams. The figures are reproduced with permission from [12]. (b) (Top) Change in cell size and stress as a function of compressive strain in epoxy based SMP foams, (Bottom) CT scan images of an epoxy based foam at progressively higher compressive strains. The figure is reproduced with permission from [49].
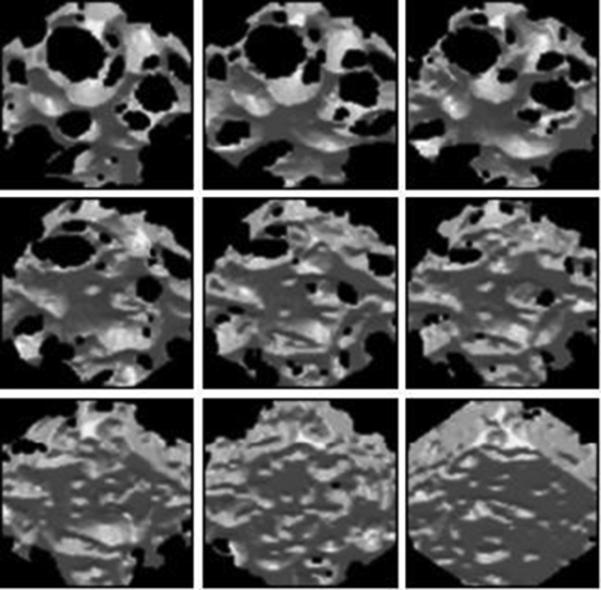
(a) The evolution of stress with respect to compressive strain at different temperatures and strain rates on Mitsubishi MFNo21 foams. The figures are reproduced with permission from [12]. (b) (Top) Change in cell size and stress as a function of compressive strain in epoxy based SMP foams, (Bottom) CT scan images of an epoxy based foam at progressively higher compressive strains. The figure is reproduced with permission from [49].
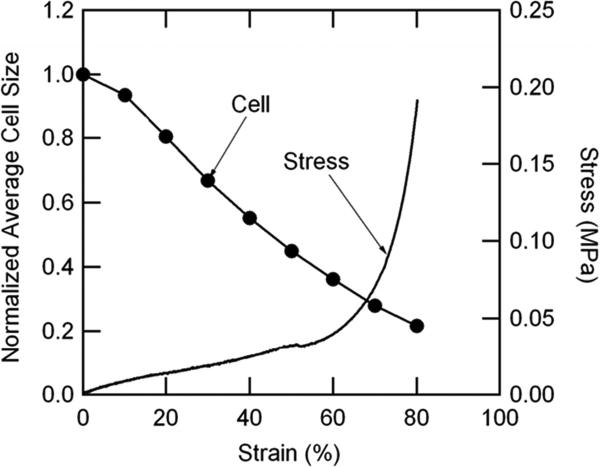
(a) The evolution of stress with respect to compressive strain at different temperatures and strain rates on Mitsubishi MFNo21 foams. The figures are reproduced with permission from [12]. (b) (Top) Change in cell size and stress as a function of compressive strain in epoxy based SMP foams, (Bottom) CT scan images of an epoxy based foam at progressively higher compressive strains. The figure is reproduced with permission from [49].
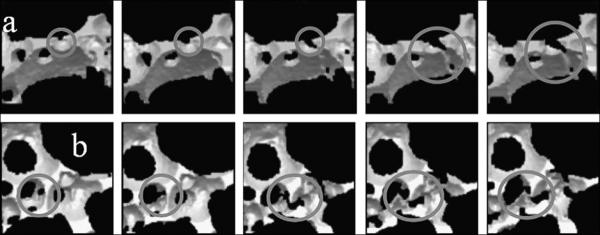
Examples of microfracturing of struts prior to macroscopic sample failure. (a) and (b) track two different struts at 0, 25, 50, 75 and 100 cycles respectively going from left to right. The figures are reproduced with permission from [68].
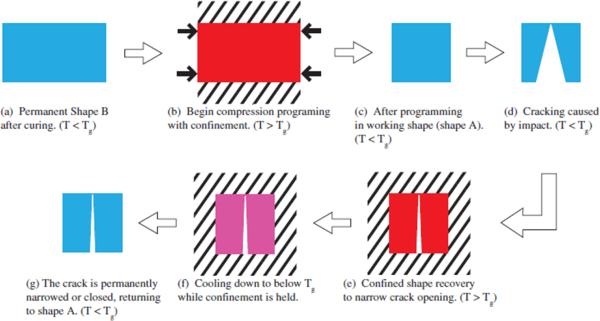
Schematic of the self-closing scheme of the proposed smart foams (Tg is the transition temperature of the foams). The figure is reproduced with permission from [91].
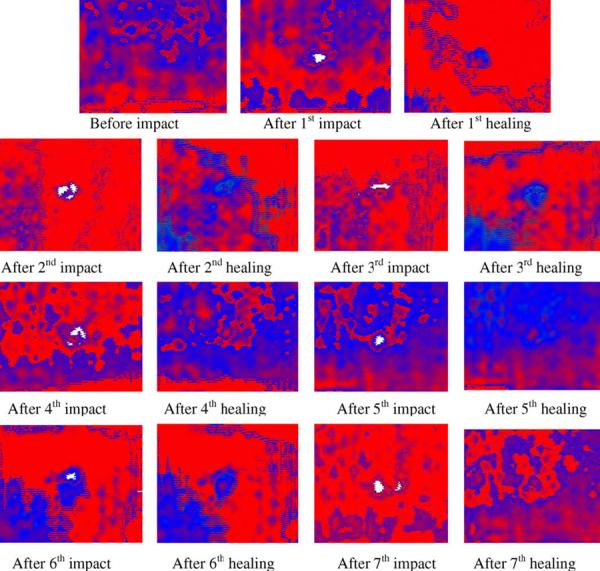
C-scan images of the sandwich panels after each impact and healing cycle. The figure is reproduced with permission from [90].
References
-
- Lendlein A, Kelch S. Shape-memory polymers. Angewandte Chemie - International Edition. 2002;41:2034–2057. - PubMed
-
- Liu C, Qin H, Mather PT. Review of progress in shape-memory polymers. Journal of Materials Chemistry. 2007;17:1543–1558.
-
- Yakacki CM, Gall K. Shape-memory polymers for biomedical applications. Advances in Polymer Science. 2010;226:147–175.
Grants and funding
LinkOut - more resources
Full Text Sources
Other Literature Sources