

doi: 10.1007/s12551-013-0107-1.
Epub 2013 Mar 6.
Light-scattering-based analysis of biomolecular interactions
Affiliations
- PMID: 23646069
- PMCID: PMC3641300
- DOI: 10.1007/s12551-013-0107-1
Item in Clipboard
Light-scattering-based analysis of biomolecular interactions
Biophys Rev.
2013 Jun.
Abstract
While light scattering has long been applied to the analysis of biomolecular interactions, recent advances have extended the practical use of light scattering techniques to cover a rather broad range of phenomena. In this paper I review essential light scattering theory as applied to specific interactions under thermodynamically ideal conditions and present examples showing how light scattering elucidates the dynamic equilibrium and kinetic behavior of proteins and other biomacromolecules.
Keywords: Affinity; CG-DLS; CG-MALS; Interactions; Light scattering; Stoichiometry.
Figures
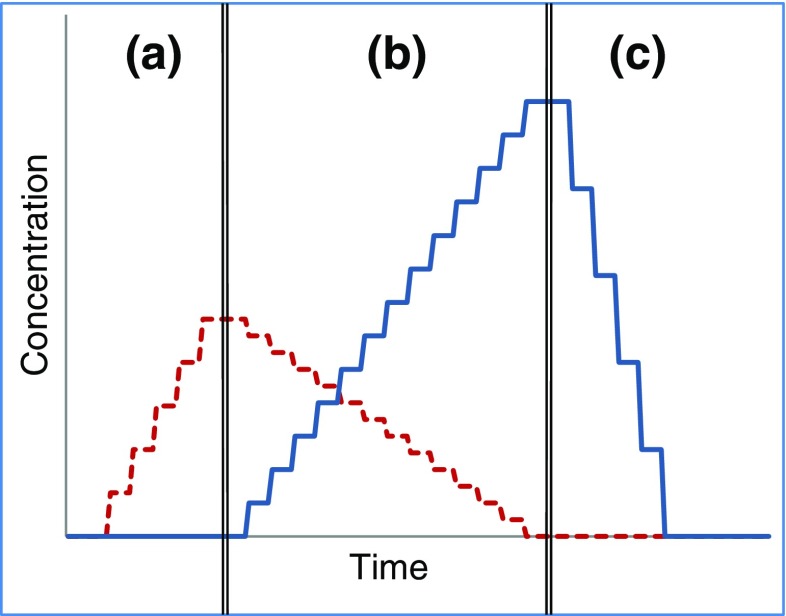
Method for analyzing simultaneous self- and hetero-interactions. Solid blue line Protein X, broken red line Protein Y. a self-interaction of Y, b hetero-interaction X + Y, c self-interaction of X. After Attri and Minton
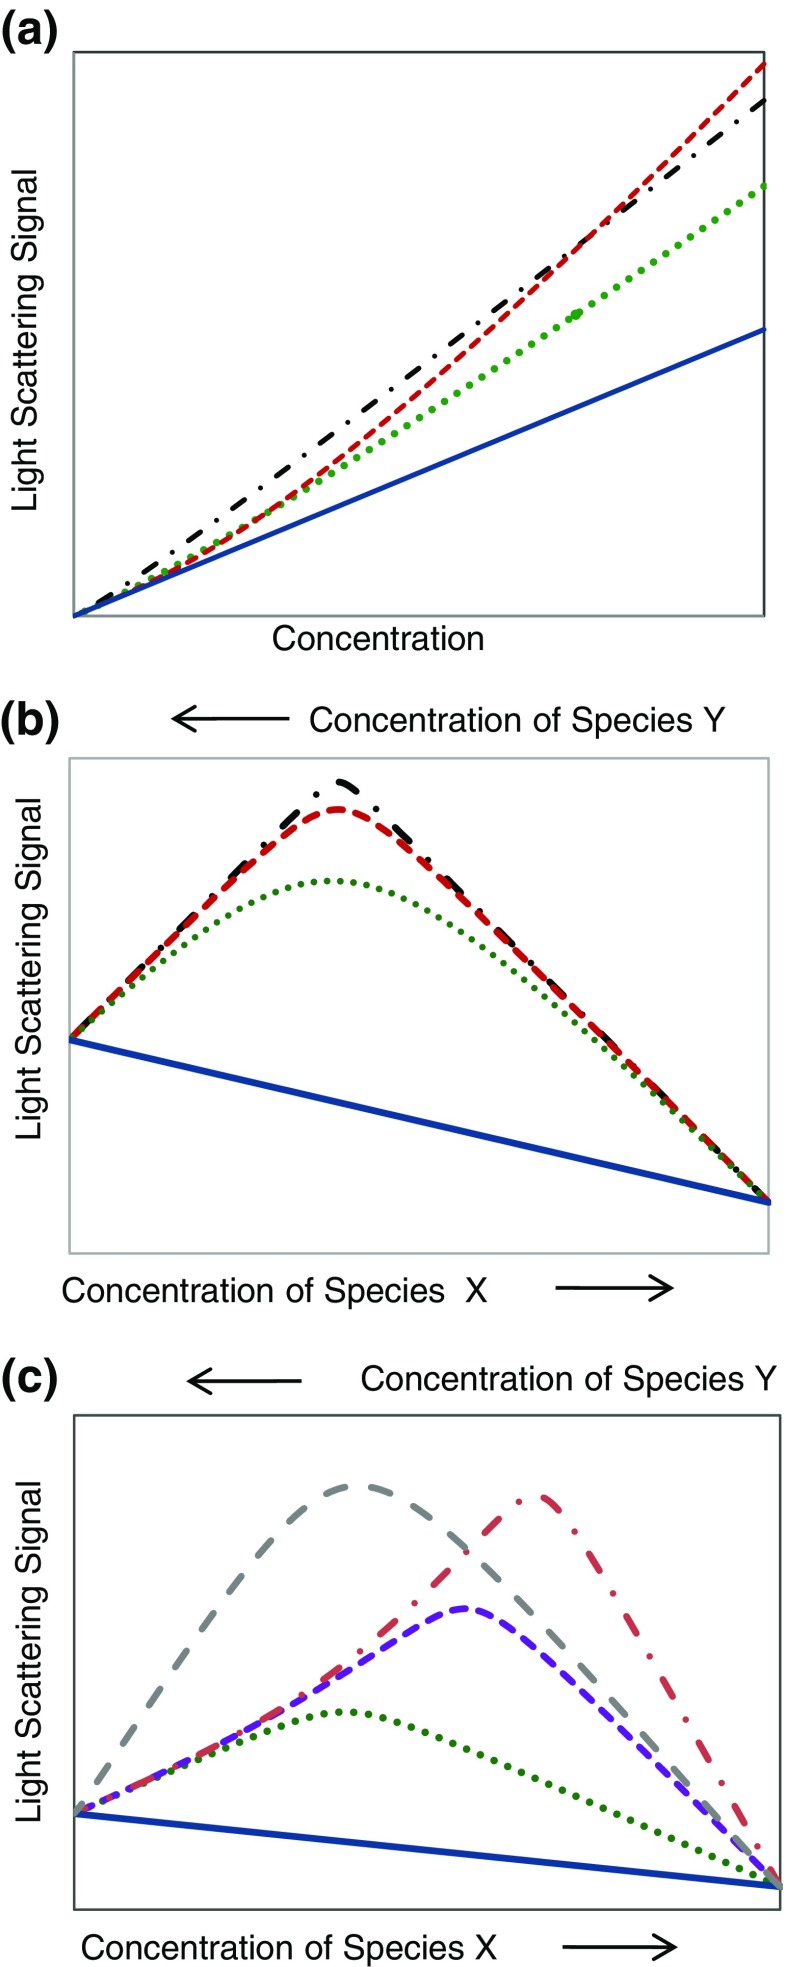
Simulated light scattering (LS) signals for: a single-species concentration gradients (solid blue line no interaction, dotted green line monomer–dimer KD = 10 μM, dashed red line monomer–trimer KD = 10 μM, dash–dot black line monomer–dimer KD = 1 μM), b crossover gradient of Fig. 1b assuming 1:1 binding at three different affinities (solid blue line no interaction, dotted green line KD = 100 nM, dashed red line KD = 10 nM, dash–dot black line KD = 1 nM), c crossover gradient of Fig. 1b assuming different stoichiometries (protein X:protein Y) at constant per-site binding affinity [solid blue line no interaction, dotted green line 1:1, dashed purple line 2:1, dash–dot red line 3:1, long-dash-gray line 2:2 (KD for 2:2 is 10× that of the other stoichiometries)]
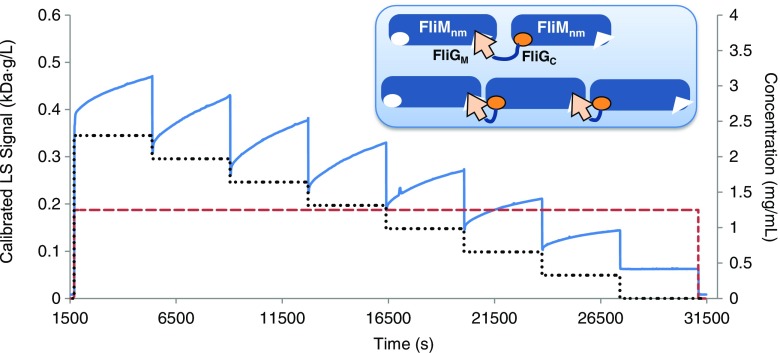
Multi-angle static light scattering (MALS) signal showing slow, multi-domain assembly kinetics. FliM, FliG Multi-domain flagellar motor proteins. Dotted black line FliGmc concentration, dashed red line FliMnm concentration, solid blue line LS signal. Inset Intermediate assembly state derived from quasi-equilibrium analysis of MALS data, 1 h after mixing
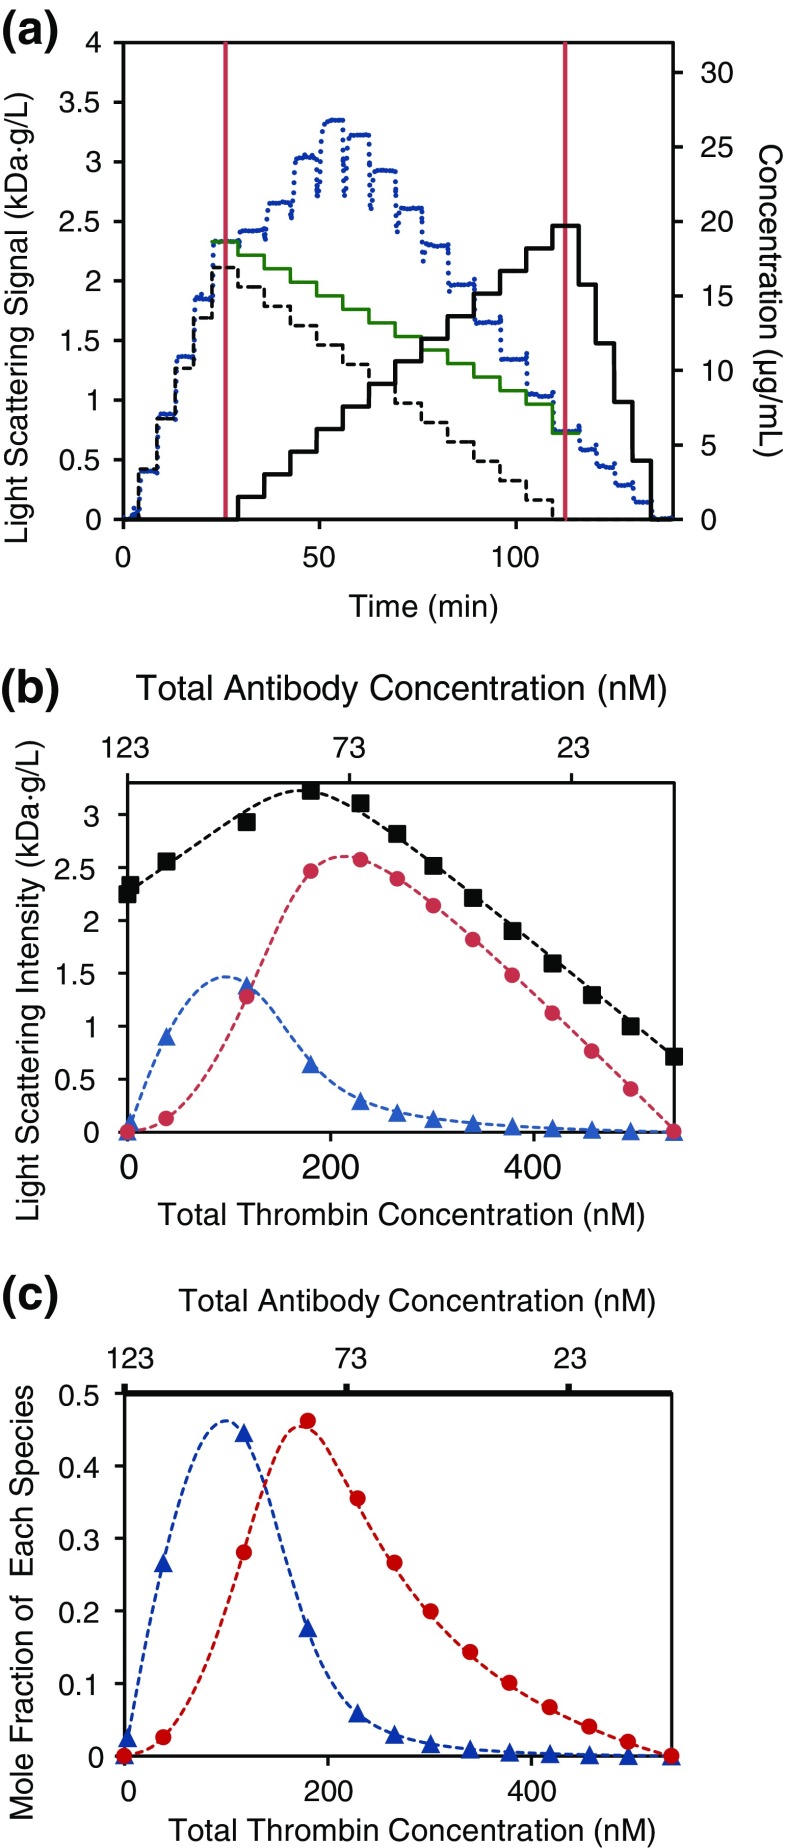
Typical antibody–antigen binding data. a Composition-gradient (CG)-MALS data based on the method of Fig. 1. Dotted blue line Measured LS data, dashed black line injected anti-thrombin immunoglobulin G (ATI) concentration, solid black line injected α-thrombin (THR) concentration, solid green line simulated no-interaction LS signal. b Hetero-association modeling. Black squares LS data points measured after equilibration, dashed black line best-fit model, 2(THR):1(ATI) with equivalent and independent binding sites, KD = 9 nM. Other plots represent LS contributions from the complexes. Blue triangles 1:1, red circles 2 (THR):1 (ATI). c Mole fraction of complexes, same symbols as for b. In b and c, plots for free monomers are not shown
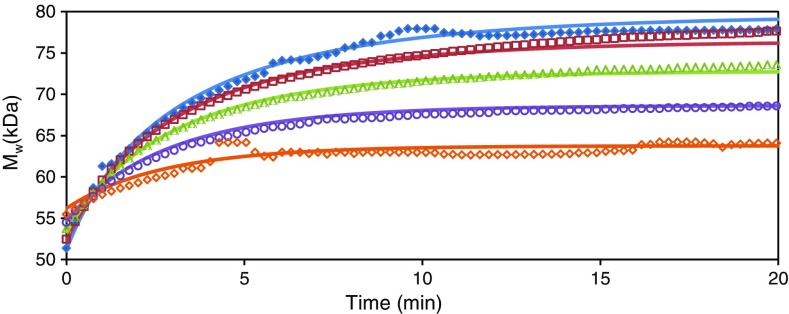
THR–anti-thrombin (AT) binding kinetics, fixed AT concentration of 60 μg/mL, and varying THR concentrations. Symbols represent measured values: solid blue diamonds 28 μg/mL THR, red squares 22 μg/mL THR, green triangles 17 μg/mL THR, purple circles 11 μg/mL THR, open orange diamonds 5.6 μg/mL THR. Lines are best-fit to second-order kinetics; 1:1 binding with Kon = 6.09 × 10⁻³ s−1 M−1
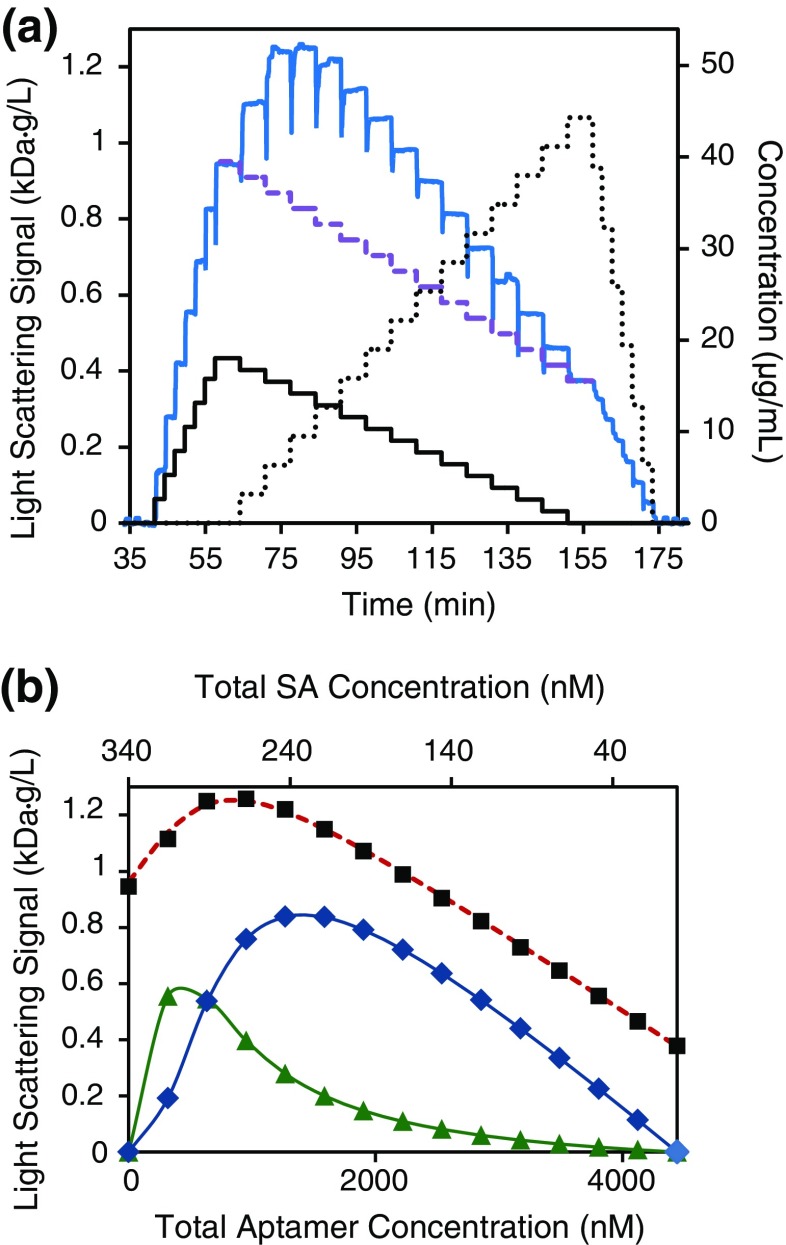
a CG-MALS aptamer–streptavidin (APT–SA data). Solid blue line Measured LS, dashed purple line simulated no-interaction data, solid black line injected SA concentration, dotted black line injected APT concentration. b Hetero-association modeling. Black squares Measured LS, dashed red line best-fit model of 2 APT:1 SA, equivalent and independent binding sites, KD = 190 nM, green triangles 1:1, blue diamonds 2:1 complex. LS from free monomers not shown. In b
lines (except best-fit model) are guides to the eye, and the self-interaction data are excluded as no self-association was evident. Conversion of LS signals to units of kiloDaltons gram per liter is approximate because APT and SA have different specific refractive index increment (dn/dc) values
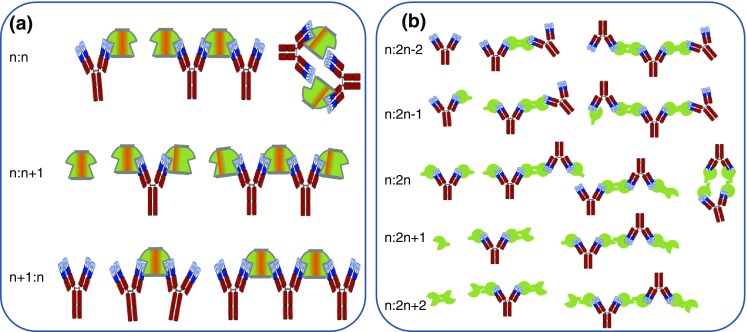
Molecular networks that may form from multivalent molecules. a Bivalent antibody (Ab) and bivalent antigen (Ag). b Bivalent antibody and monovalent, self-associating antigen. Stochiometries represent Ab:Ag
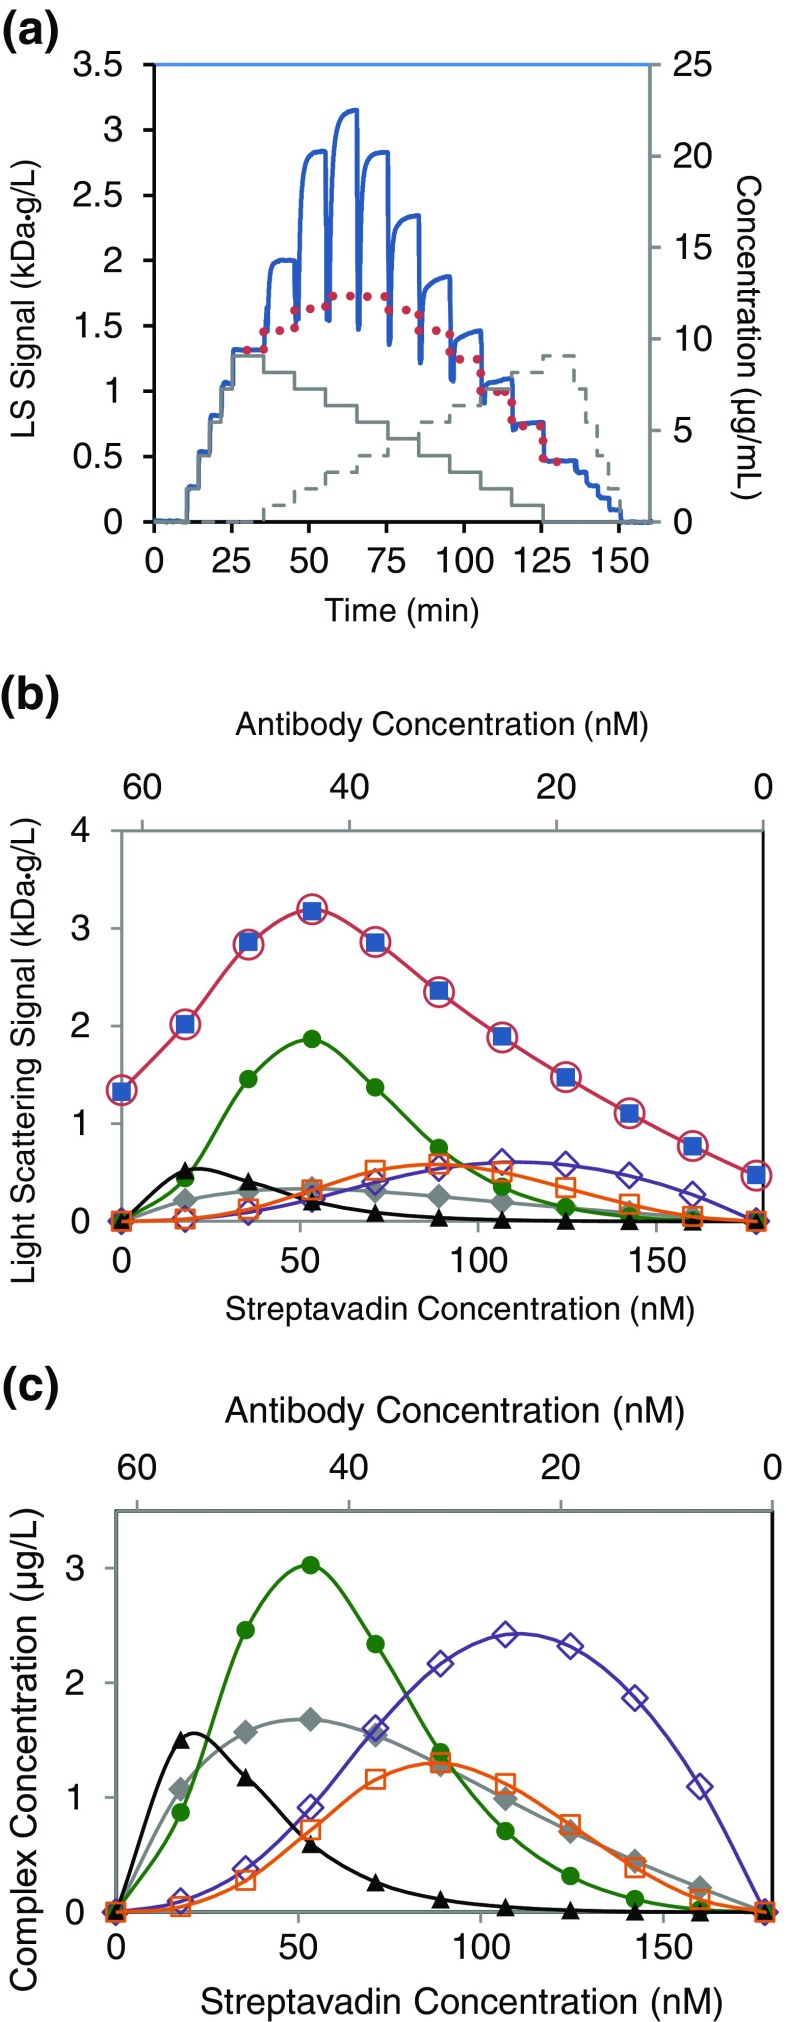
a CG-MALS gradient of multi-valent/multi-valent SA + immunoglobulin G interaction. Solid blue line MALS data, dotted red line simulated LS from 1:2 interaction, solid gray line injected SA concentration, dashed gray line injected antibody concentration. b Hetero-association fitting. Blue squares LS data from each injection measured at equilibrium, open red circles best fit to a model assuming the complexes of Fig. 7a, single-site KD = 20 nM, filled gray diamonds 1:1, filled green circles 2:2 + 3:3 + 4:4 + …, closed black triangles 1 SA:2 antibody, open purple diamonds 2 SA:1 antibody, open orange squares 3 SA:2 antibody. c Solution concentrations of the individual complexes, symbols as in b. Filled green circles represent total mass concentration of all n:n complexes excluding 1:1. In b and c free monomer plots not shown, lines are guides to the eye, and the self-interaction data are excluded as no self-association was evident
References
-
- Bajaj H, Sharma VK, Kalonia D. A high-throughput method for detection of protein self-association and second virial coefficient using size-exclusion chromatography through simultaneous measurement of concentration and scattered light intensity. Pharm Res. 2007;24:2071–2083. - PubMed
LinkOut - more resources
Full Text Sources
Other Literature Sources
