. 2013 Apr 30;8(4):e63068.
doi: 10.1371/journal.pone.0063068. Print 2013.

Genomic analysis of sequence-dependent DNA curvature in Leishmania

Affiliations

Genomic analysis of sequence-dependent DNA curvature in Leishmania

Pablo Smircich et al. PLoS One. .

Abstract

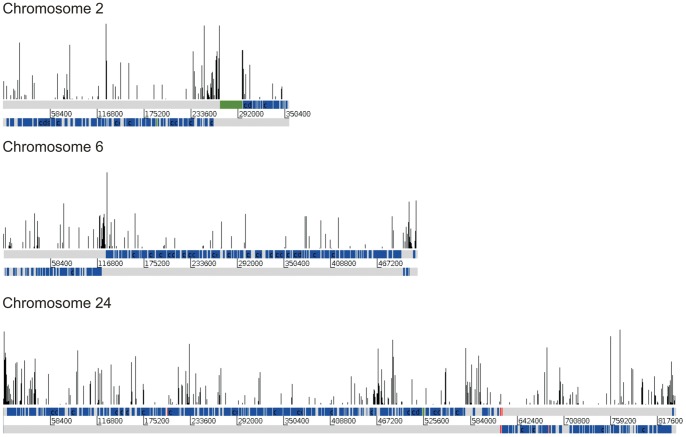
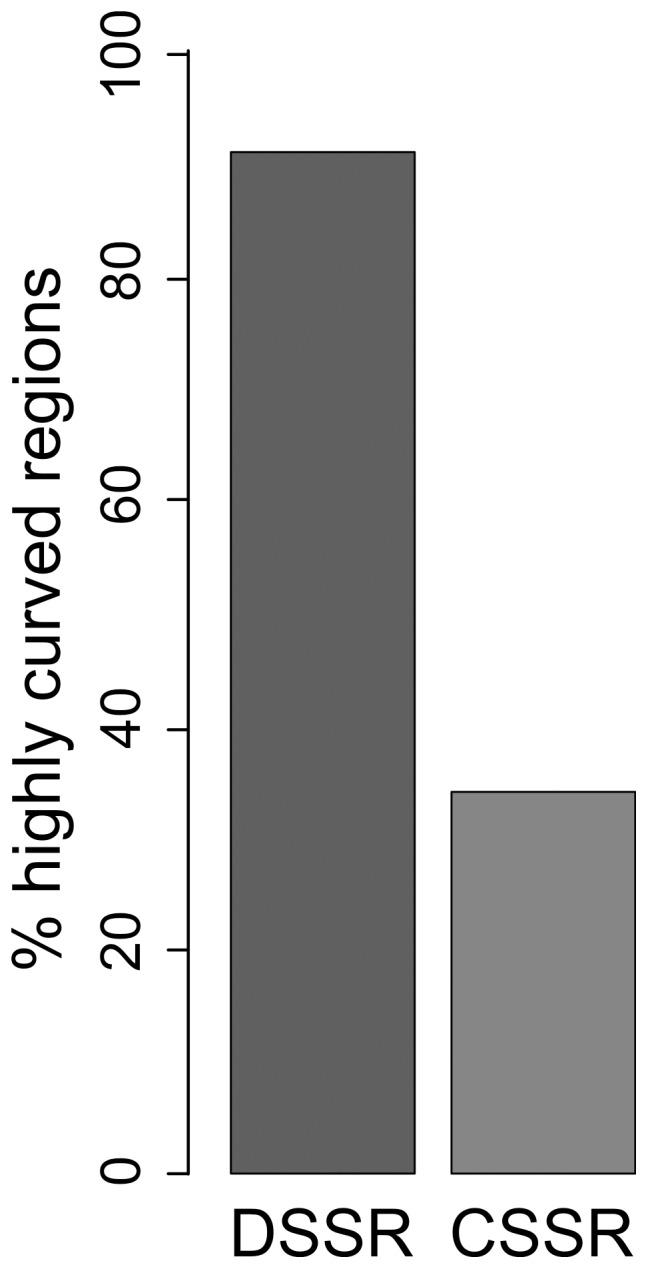
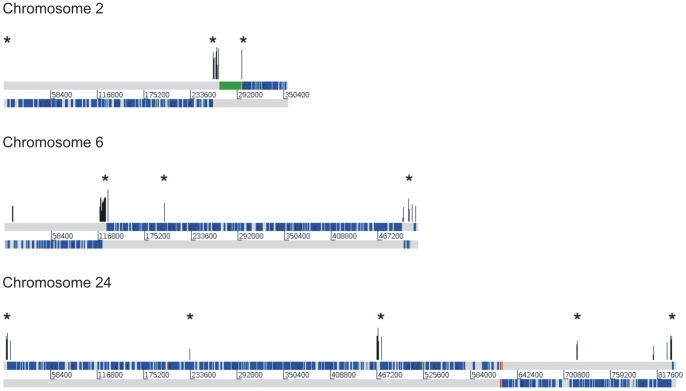
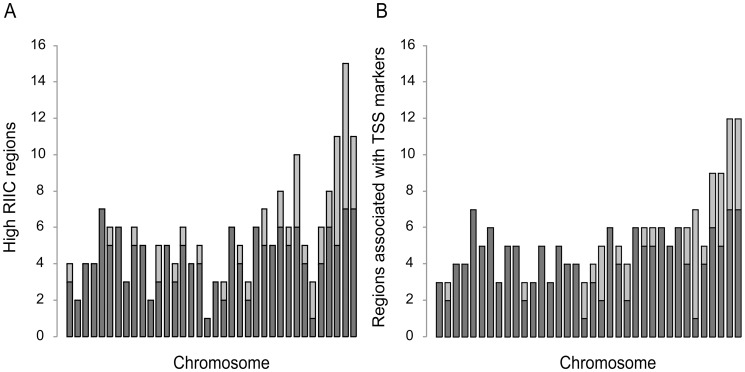
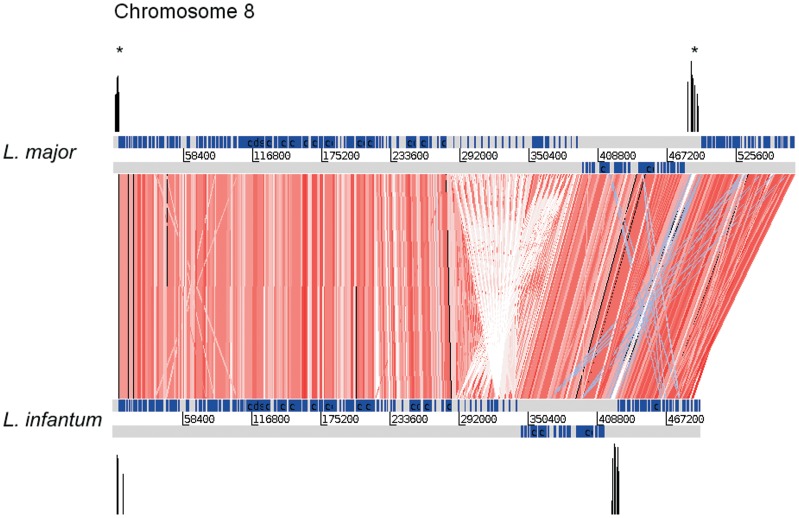
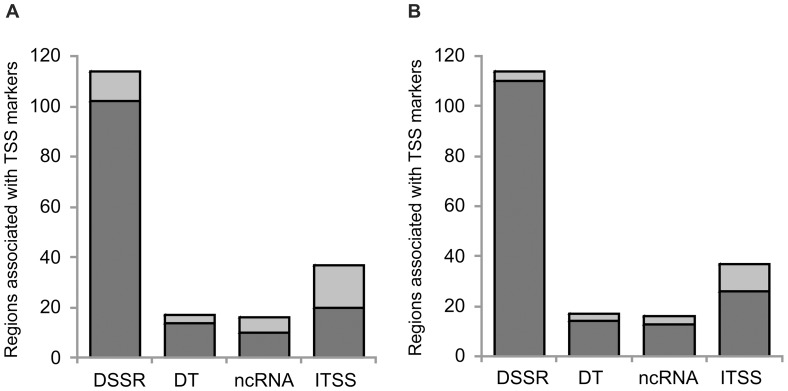
Leishmania major is a flagellated protozoan parasite of medical importance. Like other members of the Trypanosomatidae family, it possesses unique mechanisms of gene expression such as constitutive polycistronic transcription of directional gene clusters, gene amplification, mRNA trans-splicing, and extensive editing of mitochondrial transcripts. The molecular signals underlying most of these processes remain under investigation. In order to investigate the role of DNA secondary structure signals in gene expression, we carried out a genome-wide in silico analysis of the intrinsic DNA curvature. The L. major genome revealed a lower frequency of high intrinsic curvature regions as well as inter- and intra- chromosomal distribution heterogeneity, when compared to prokaryotic and eukaryotic organisms. Using a novel method aimed at detecting region-integrated intrinsic curvature (RIIC), high DNA curvature was found to be associated with regions implicated in transcription initiation. Those include divergent strand-switch regions between directional gene clusters and regions linked to markers of active transcription initiation such as acetylated H3 histone, TRF4 and SNAP50. These findings suggest a role for DNA curvature in transcription initiation in Leishmania supporting the relevance of DNA secondary structures signals.


Conflict of interest statement

Competing Interests: The authors have declared that no competing interests exist.

Figures

Figure 1
Figure 1. Graphical representation of IC peaks on selected L. major chromosomes.
Bar plots of IC positions with an IC value greater than 9 degrees per helical turn. Both DNA strands are depicted in grey below bar plots, overlaid with CDS features shown in blue. Features labeled as ncRNA, snRNA or snoRNAs are shown in green. tRNAs are shown in red.
Figure 2
Figure 2. Regional Integrated Intrinsic Curvature analysis in L. major.
Bar plot showing the percentage of regions with significant RIIC score (p<0.05), indicated as highly curved, for divergent (DSSR) and convergent (CSSR) strand switch regions.
Figure 3
Figure 3. Graphical representation of IC for regions with high RIIC score for three L. major chromosomes.
The graphs are the same as figure 1. IC for regions with high RIIC score are represented on top. Asterisks mark sites defined as sites associated with acetylated H3 histone .
Figure 4
Figure 4. Comparative analysis of high RIIC regions vs. reported putative TSS for each L. major chromosome.
A. The total number of high RIIC regions for each L. major chromosome, depicted in ascending order from left to right, is represented. Dark grey indicates high RIIC scoring regions that overlap with regions associated with TSS markers reported by Thomas et al. . B. The total number of regions associated with TSS markers obtained in Thomas, et al. for each L. major chromosome, depicted in ascending order from left to right, is represented. Dark grey indicates the number of regions associated with TSS markers that overlap high RIIC regions.
Figure 5
Figure 5. Location conservation of high RIIC scoring regions in L. major and L. infantum chromosome 8.
The graphs are the same as figure 1. Blast HSPs longer than 100 bp and with at least 80% similarity are displayed in red scale and blue lines represent inversions.
Figure 6
Figure 6. Comparative analysis of high RIIC regions vs. reported putative TSS in Leishmania.
A. The total number of different type of regions (D SS: Divergent Strand Switch; D T: divergent telomeres; ncRNA: associated with ncRNA transcription; I TSS: internal to polycistrons TSS) associated with TSS markers obtained in Thomas, et. al. in the L. major genome is represented. Dark grey indicates the number of regions associated with TSS markers that overlap with high RIIC regions. B. Same as in A displaying in dark grey the number of regions associated with TSS markers that overlap with high RIIC regions that are present either in L. major or L. infantum.

References

    1. Desjeux P (2004) Leishmaniasis: current situation and new perspectives. Comp Immunol Microbiol Infect Dis 27: 305–318. - PubMed
    1. Martinez-Calvillo S, Vizuet-de-Rueda JC, Florencio-Martinez LE, Manning-Cela RG, Figueroa-Angulo EE (2010) Gene expression in trypanosomatid parasites. J Biomed Biotechnol 2010: 525241. - PMC - PubMed
    1. Boucher N, McNicoll F, Laverdiere M, Rochette A, Chou MN, et al. (2004) The ribosomal RNA gene promoter and adjacent cis-acting DNA sequences govern plasmid DNA partitioning and stable inheritance in the parasitic protozoan Leishmania. Nucleic Acids Res 32: 2925–2936. - PMC - PubMed
    1. Casagrande L, Ruiz JC, Beverley SM, Cruz AK (2005) Identification of a DNA fragment that increases mitotic stability of episomal linear DNAs in Leishmania major. Int J Parasitol 35: 973–980. - PubMed
    1. Ubeda JM, Legare D, Raymond F, Ouameur AA, Boisvert S, et al. (2008) Modulation of gene expression in drug resistant Leishmania is associated with gene amplification, gene deletion and chromosome aneuploidy. Genome Biol 9: R115. - PMC - PubMed

Publication types

LinkOut - more resources