Review
. 2013 Aug;169(7):1430-46.
doi: 10.1111/bph.12222.

Efficacy and ligand bias at the μ-opioid receptor

Affiliations
Review

Efficacy and ligand bias at the μ-opioid receptor

E Kelly. Br J Pharmacol. 2013 Aug.

Abstract

In order to describe drug action at a GPCR, a full understanding of the pharmacological terms affinity, efficacy and potency is necessary. This is true whether comparing the ability of different agonists to produce a measurable response in a cell or tissue, or determining the relative ability of an agonist to activate a single receptor subtype and produce multiple responses. There is a great deal of interest in the μ-opioid receptor (MOP receptor) and the ligands that act at this GPCR not only because of the clinically important analgesic effects produced by MOP agonists but also because of their liability to induce adverse effects such as respiratory depression and dependence. Our understanding of the mechanisms underlying these effects, as well as the ability to develop new, more effective MOP receptor drugs, depends upon the accurate determination of the efficacy with which these ligands induce coupling of MOP receptors to downstream signalling events. In this review, which is written with the minimum of mathematical content, the basic meaning of terms including efficacy, intrinsic activity and intrinsic efficacy is discussed, along with their relevance to the field of MOP receptor pharmacology, and in particular in relation to biased agonism at this important GPCR.

Keywords: GPCR; efficacy; intrinsic efficacy; ligand bias; μ-opioid receptor.


Figures

Figure 1
Figure 1
(A) Agonist action is usually shown as a log concentration–response curve, with the curve being defined by the agonist potency (EC50 value), the agonist maximum response (Emax; this may or may not be the tissue maximum) and also by the slope at the midpoint of the curve. (B) Diagrammatic representation of a family of agonist concentration–response curves produced by activation of a single receptor subtype in a tissue. Note that since partial agonists have low efficacy for the response measured, then the partial agonist represented by the grey curve in (B) must have a very high affinity in order to have such a high potency (i.e. low value of EC50). Buprenorphine activation of [35S]GTPγS binding would be an example of such a MOP receptor agonist (McPherson et al., 2010).
Figure 2
Figure 2
Agonists can have different receptor reserves for a response. (A) Diagrammatic representation of two agonists, R and B, which act at the same receptor subtype and are full agonists for the response measured. (B) Following pretreatment of the tissue with a low concentration of an irreversible antagonist (e.g. β-funaltrexamine for MOP receptors) the curve for agonist R shifts to the right but the maximum response stays the same. Pretreatment with a higher concentration of the irreversible antagonist further shifts the curve to the right but also reduces the maximum response by about 35%. (C) Pretreatments of the tissue with the irreversible antagonist produce little shift of agonist B, but the maximum response is markedly reduced, with almost no response recordable after the higher concentration of irreversible antagonist. The receptor reserve for agonist R must be significantly greater than the one for agonist B, with the receptor reserve for agonist B being very small as there is a little rightward shift of the curve for the agonist before the maximum response decreases.
Figure 3
Figure 3
Efficacy is tissue-dependent. Diagrammatic representation of a family of concentration–response curves obtained from different tissues for a response produced by an agonist acting at one particular receptor subtype. Although the agonist has the same value of intrinsic efficacy for the receptor response, variations in the tissue-dependent factors of receptor concentration (RT) and/or efficiency of coupling of receptor to response can markedly affect the potency and maximum response of the agonist. Note also that decreasing τ from tissue 1→5 would also produce the same family of curves.
Figure 4
Figure 4
Relative intrinsic efficacy (τ) values for agonists at MOP receptors are tissue-independent. Correlation of τ values for [35S]GTPγS binding in HEK293 cells and activation of a K+ current in locus coeruleus neurones for four MOP receptor agonists. Following linear regression, the r2 value was 0.975, indicating a high correlation of agonist relative τ values obtained in the two systems. The analysis is based on data from McPherson et al. (2010) and Rivero et al. (2012).
Figure 5
Figure 5
(A) Major cellular signalling pathways activated by MOP receptor (MOPr) agonists. While the G protein-dependent signalling pathways have been established over many years, the arrestin-dependent signalling pathways have only recently begun to be characterized (Walwyn et al., ; Groer et al., ; Raehal et al., ; Henry et al., 2012). The MAPK cascade can be activated via G protein- or arrestin-dependent pathways (Zheng et al., 2008). Many of these pathways also lead to changes in gene expression, particularly with prolonged agonist treatments. (B) The in vivo consequences of MOP receptor agonist administration to a patient. Effects in red are desirable, therapeutic effects; those in blue are adverse, undesirable effects. Some, such as sedation or euphoria, can be therapeutic or undesirable depending upon the context.
Figure 6
Figure 6
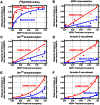
Occupancy–response relationships for DAMGO and morphine for (A) [35S]GTPγS binding fitted to a hyperbolic function, for (B–D) MOP receptor internalization, Ser375 phosphorylation and arrestin-3 recruitment fitted by linear regression, and for (E-F) the Ser375 and arrestin-3 data points from C and D instead fitted to an exponential growth model. The values of occupancy were calculated using Equation (4), using data previously published (McPherson et al., ; Rivero et al., 2012). The values shown in brackets are the R2 values from the fits in GraphPad Prism. For linear regression, in all cases the line was constrained to go through X = 0, Y = 0. The occupancy–response relationships for Ser375 phosphorylation, arrestin-3 recruitment and internalization were better described by linear than hyperbolic relationships, indicating little or no receptor reserve for these responses in this assay system (R2 values for fitting of occupany–response data for Ser375 to a hyperbolic function was 0.750 for DAMGO and did not converge for morphine; for arrestin-3 recruitment 0.788 for DAMGO and 0.704 for morphine; for internalization 0.874 for DAMGO and 0.658 for morphine). However, the R2 values for fitting Ser375 phosphorylation (E), arrestin-3 recruitment (F) and internalization (not shown) to an exponential growth model [Y = Y0 × exp(k × X)] was, in turn, better than to a linear model.
Figure 7
Figure 7
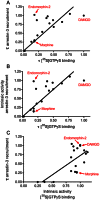
Correlation of efficacy values for [35S]GTPγS and arrestin recruitment for a series of MOP receptor agonists. In each case, the data are expressed as a fraction of the value for DAMGO (taken as 1 in each case), and were subjected to linear regression. (A) Correlation of τ values with linear regression. (B) Correlation using intrinsic activity values for arrestin recruitment and τ values for [35S]GTPγS binding, with linear regression. Note that the relationship when using intrinsic activity values for arrestin recruitment is essentially the same as when using τ values for this pathway as in A. (C) Correlation using intrinsic activity values for [35S]GTPγS binding and τ values for arrestin recruitment, with linear regression. The use of intrinsic activity for G protein output now radically alters the relationship compared to graphs A and B. Note also that endomorphin-2 no longer appears as an arrestin-biased agonist, and in fact now it almost overlies DAMGO in the correlation.
Figure 8
Figure 8
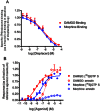
Comparison of the effects of DAMGO and morphine on ligand binding, [35S]GTPγS binding and arrestin-3 recruitment. (A) DAMGO and morphine displaced [3H]naloxone from MOP receptors with similar potency. (B) Concentration–response curves for activation of [35S]GTPγS binding and arrestin-3 recruitment for MOP receptors stably expressed in HEK293 cells. DAMGO was a full agonist in both assays, whereas morphine was a full agonist in the G protein assay but a weak partial agonist in the arrestin assay. The results in panel (A) indicate that differences between the DAMGO and morphine curves shown in (B) cannot be due to differences in affinity for MOP receptors.
Figure 9
Figure 9
Possible mechanism to explain changes in relative intrinsic efficacy of MOP receptor agonists in different tissues/cell types. (A) In tissue 1, the high-efficacy agonist DAMGO is better able to promote coupling of MOP receptors via G protein to the downstream signal than the lower efficacy agonist morphine. (B) In tissue 2, which contains significant levels of an ‘interacting protein’, DAMGO but not morphine is able to promote recruitment of the ‘interacting protein’ to the signalling complex. Recruitment of the ‘Interacting protein’ dampens DAMGO-induced signalling, and consequently reduces the efficacy of DAMGO relative to morphine. DAMGO might have this effect either because it induces a conformation of the receptor-signalling complex more favourable to recruitment of the ‘Interacting protein’, or because the efficacy of morphine is not sufficient to recruit the ‘Interacting protein’. In this example, an RGS protein (Psigfogeorgou et al., ; Traynor, 2012) could fulfil the role of an ‘Interacting protein’. Furthermore, such dispartities are more likely to occur if responses with different proximities to the receptor are compared. Thus, if G protein activation using [35S]GTPγS was used in one assay, but the more distal readout of, say, an ion channel was used in another, then the latter could be subject to regulation by interacting proteins at more levels than the former response.

References

    1. Alexander SP, Mathie A, Peters JA. Guide to Receptors and Channels (GRAC), 5th edition. Br J Pharmacol. 2011;164(Suppl. 1):S1–S324. - PMC - PubMed
    1. Bailey CP, Llorente J, Gabra BH, Smith FL, Dewey WL, Kelly E, et al. Role of protein kinase C and mu-opioid receptor (MOP receptor) desensitization in tolerance to morphine in rat locus coeruleus neurons. Eur J Neurosci. 2009;29:307–318. - PMC - PubMed
    1. Bassoni DL, Raab WJ, Achacoso PL, Loh CY, Wehrman TS. Measurements of β-arrestin recruitment to activated seven transmembrane receptors using enzyme complementation. Methods Mol Biol. 2012;897:181–203. - PubMed
    1. Bennett MI, Graham J, Schmidt-Hansen M, Prettyjohns M, Arnold S, Group GD. Prescribing strong opioids for pain in adult palliative care: summary of NICE guidance. BMJ. 2012;344:e2806. - PubMed
    1. Black JW, Leff P. Operational models of pharmacological agonism. Proc R Soc Lond B Biol Sci. 1983;220:141–162. - PubMed

Publication types

MeSH terms