. 2013 Jun;88(5):936-50.
doi: 10.1111/mmi.12234. Epub 2013 May 5.

Integrated stress response of Escherichia coli to methylglyoxal: transcriptional readthrough from the nemRA operon enhances protection through increased expression of glyoxalase I

Affiliations
Free PMC article

Integrated stress response of Escherichia coli to methylglyoxal: transcriptional readthrough from the nemRA operon enhances protection through increased expression of glyoxalase I

Ertan Ozyamak et al. Mol Microbiol. 2013 Jun.
Free PMC article

Abstract

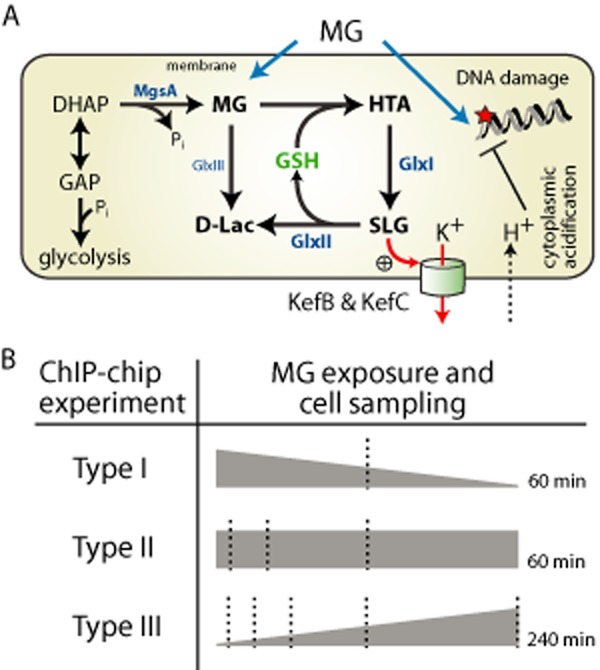
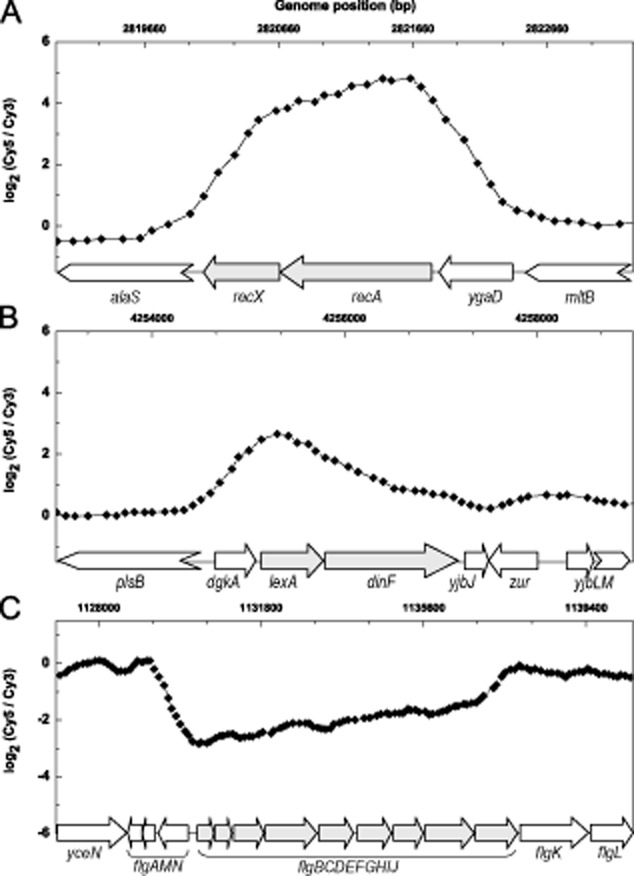
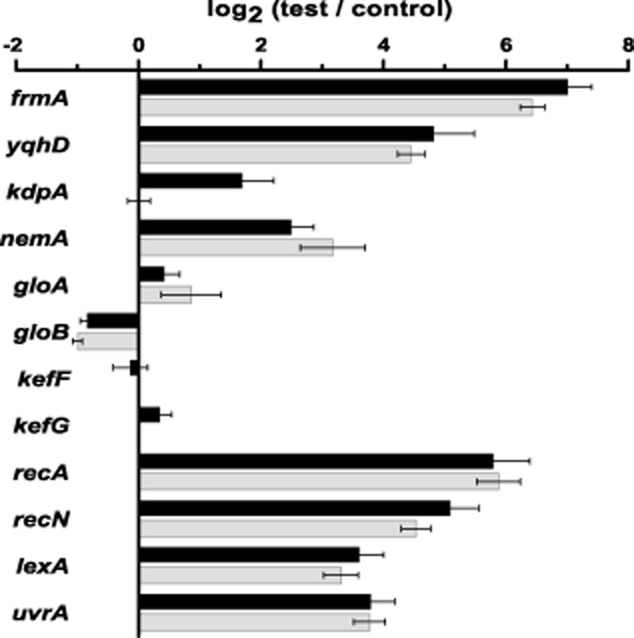
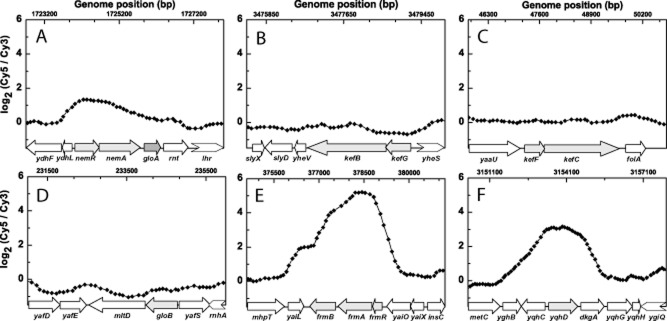
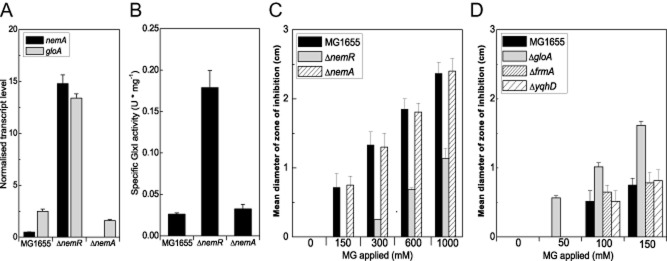
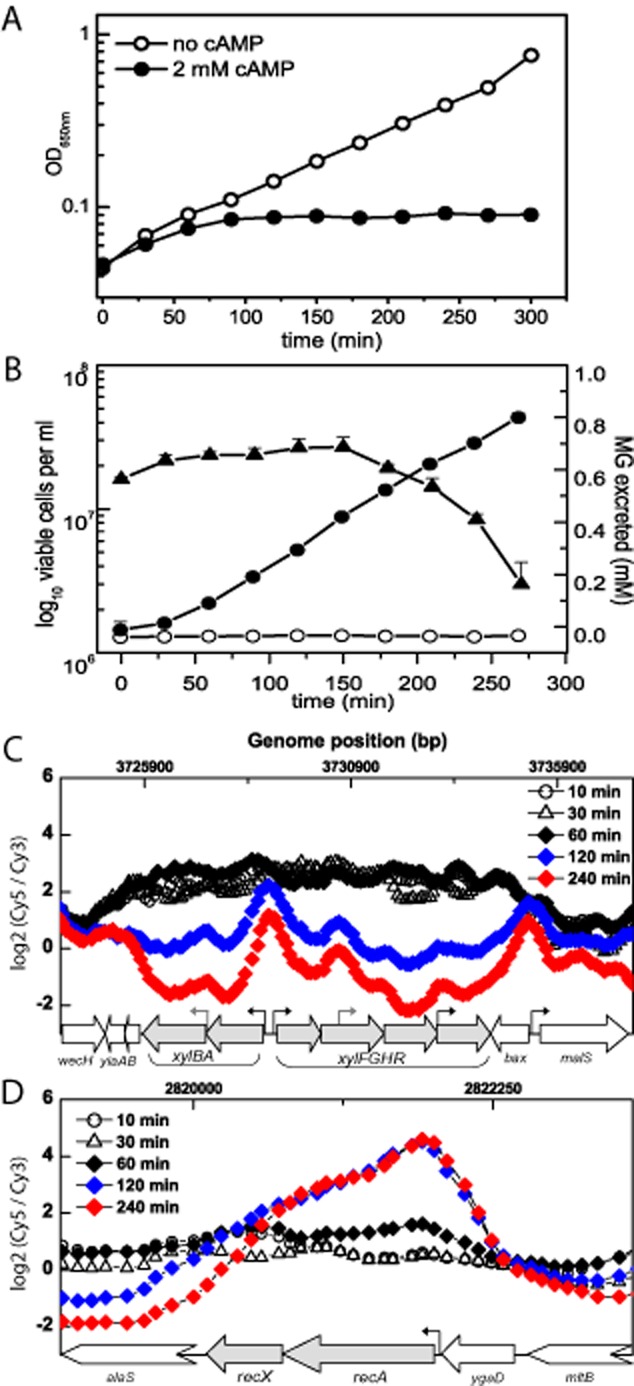
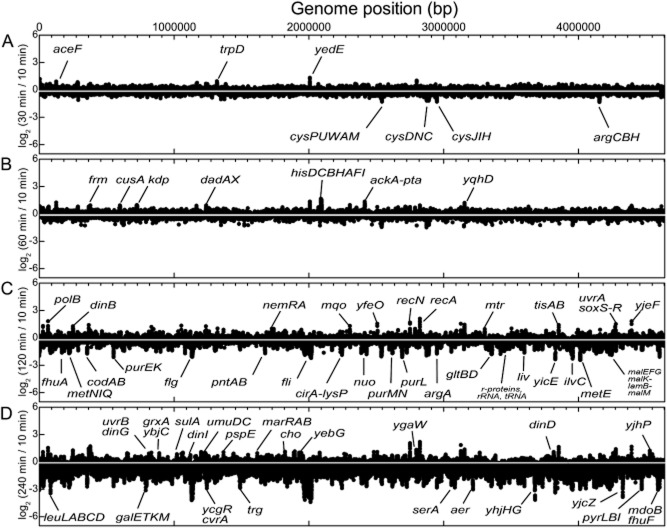
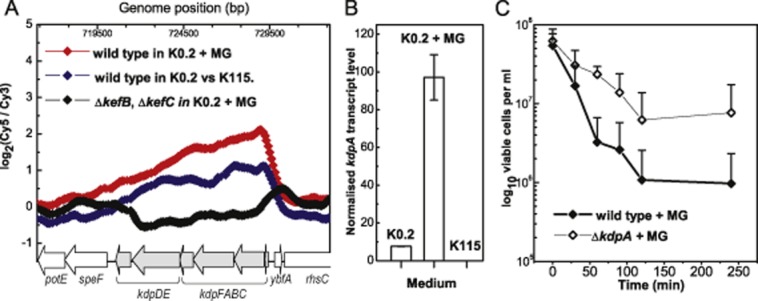
Methylglyoxal (MG) elicits activation of K(+) efflux systems to protect cells against the toxicity of the electrophile. ChIP-chip targeting RNA polymerase, supported by a range of other biochemical measurements and mutant creation, was used to identify genes transcribed in response to MG and which complement this rapid response. The SOS DNA repair regulon is induced at cytotoxic levels of MG, even when exposure to MG is transient. Glyoxalase I alone among the core MG protective systems is induced in response to MG exposure. Increased expression is an indirect consequence of induction of the upstream nemRA operon, encoding an enzyme system that itself does not contribute to MG detoxification. Moreover, this induction, via nemRA only occurs when cells are exposed to growth inhibitory concentrations of MG. We show that the kdpFABCDE genes are induced and that this expression occurs as a result of depletion of cytoplasmic K(+) consequent upon activation of the KefGB K(+) efflux system. Finally, our analysis suggests that the transcriptional changes in response to MG are a culmination of the damage to DNA and proteins, but that some integrate specific functions, such as DNA repair, to augment the allosteric activation of the main protective system, KefGB.


Figures

Fig. 1
Fig. 1
MG stress in E. coli and ChIP-chip analysis. A. Routes of MG exposure and protective systems in E. coli. B. Experimental design of ChIP-chip analysis upon MG stress. Dotted lines indicate time points of sampling.
Fig. 2
Fig. 2
Growth of E. coli strains MG1655 and MJF632 (ΔkefGB, ΔkefFC) before and after exposure to a sublethal MG concentration during mid-exponential phase. (A) Strain MG1655 (circles) and MJF632 (triangles) were grown in K0.2 minimal medium overnight and diluted into fresh medium to an OD650 ∼ 0.05. Two parallel cultures were inoculated for each strain: a control culture (open circles or triangles) and a test culture (filled circles or triangles). Cells were grown to OD650 ∼ 0.4 and the test culture was treated with 0.8 mM MG (indicated by arrow) and the growth was assessed further. Three independent experiments were performed and representative data are shown. A section of the data in (A) is presented enlarged in (B).
Fig. 3
Fig. 3
RNAP occupancy in E. coli MG1655 is increased across LexA-regulated genes recAX (A) and lexA-dinF (B) and decreased across flg genes (C) upon sublethal MG challenge (Type I experiment). Immunoprecipitated DNA from MG-treated and untreated cells was labelled with Cy5 and Cy3 respectively. Four independent experiments were performed. Data were smoothed using adjacent averaging over 5 data points. Genes and their transcriptional orientation are indicated as arrows. Chevron arrows indicate genes with genomic boundaries beyond the illustration here.
Fig. 4
Fig. 4
Transcript level changes upon MG stress are similar between strains MG1655 and MJF632, and correlate with changes in RNAP occupancy. Transcript levels for a number of genes in strain MG1655 (black bars) and MJF632 (ΔkefGB, ΔkefFC; gray bars) were determined by qRT-PCR. Cells were grown and treated exactly as in Type I ChIP-chip experiments. Transcript levels were normalized against the internal control genes topB, trkA and polA. Changes in transcript levels are expressed as fold-changes relative to untreated control samples. Error bars indicate the standard deviation of three independent experiments.
Fig. 5
Fig. 5
E. coli MG1655 induces several detoxification systems upon MG stress, but not core protective systems. RNAP occupancy across genes and operons in cells exposed to a sublethal MG concentration (Type I experiment) is shown. Same data set as in Fig. 3 used for illustration. nemRA and gloA (A), kefGB (B), kefFC (C), gloB (D), frmRAB (E), yqhD (F).
Fig. 6
Fig. 6
Induction of nemRA is beneficial for gloA expression. A. Transcript levels for nemA (black bars) and gloA (light gray bars) in strains MG1655, MJF643 (ΔnemR) and MJF644 (ΔnemA) as quantified by qRT-PCR. Cells were grown to mid-exponential phase in K0.2 medium and total RNA was isolated. B. Specific GlxI activities in cytoplasmic cell extracts of the strains in (A). Cells were grown under conditions matching those to isolate total RNA. Assays were performed using two protein concentrations from each extract to ensure that the enzyme was rate limiting. C. A ΔnemR mutant is more resistant to MG than wild type strain MG1655. D. The MG sensitivity of strains MG1655 and MJF637 (ΔgloA; positive control) was compared with those of strains MJF635 (ΔfrmA) and MJF636 (ΔyqhD). C and D. MG disc assays were conducted as detailed in Supporting information. Each strain was tested using differently concentrated MG solutions on a single K115 plate. Error bars indicate the standard deviation of three independent experiments.
Fig. 7
Fig. 7
Progressive MG accumulation results in cell death and shift in RNAP occupancy. A. Growth of E. coli MG1655 in the absence (open circles) and presence of 2 mM cAMP (filled circles) as grown for Type III experiments. Three independent growth experiments were performed (representative data are shown). B. Cell viability of strain MG1655 (triangles) and MG production in the presence (filled circles) and absence of cAMP (open circles) over the course of the growth experiment shown in Fig. 7. Error bars indicate the standard deviation of three independent experiments. C and D. ChIP-chip signals for the xyl genes (C) and recAX (D) at different time points after diluting cells into K0.2 medium containing cAMP, relative to reference cells (Type III experiments). DNA from cAMP-treated and reference cells were labelled with the Cy5 and Cy3 respectively. Averages from two independent experiments are shown. Black arrows indicate locations of known promoters. Gray arrows indicate promoters predicted by BPROM (http://linux1.softberry.com). Data smoothing and labels are as described in Fig. 3.
Fig. 8
Fig. 8
Genome-wide RNAP occupancy changes in MG1655 upon progressive MG accumulation in Type III experiments. ChIP-chip signals for test DNA (cAMP-treated) at t30min (A), t60min (B), t120min (C) and t240min (D) was compared in silico to test signals at t10min, thus visually eliminating cAMP-induced changes and highlighting MG induced changes in RNAP occupancy. For each time point Cy5 signal intensities were averaged from two independent replicates and log2 ratios were calculated. Log2 ratios were then normalized with respect to eight reference regions across the genome that exhibited low signal intensities in both cAMP-treated and untreated cells and that did not change over time (see Supporting information). For a complete list of significant changes see Table S3.
Fig. 9
Fig. 9
RNAP occupancy across kdp operons is affected under different conditions, and kdp expression sensitizes cells to MG stress. A. Shown in blue are ChIP-chip data from MG1655 cells, grown to mid-exponential phase, in K0.2 medium relative to cells grown in K115 medium. Three independent experiments were performed and shown are representative data. Shown in red are ChIP-chip data from MG1655 cells grown in K0.2 medium and exposed to a sublethal MG concentration relative to untreated cells during mid-exponential growth (Type I experiment). Shown in black are equivalent data to the ones shown in red except that experiments were performed with strain MJF632 (ΔkefGB, ΔkefFC). Four independent experiments were performed and shown are representative data. Data smoothing and labels for all ChIP-chip data as in Fig. 3. B. kdpA transcript levels in strain MG1655 grown in different minimal media as determined by qRT-PCR. Transcript levels were normalized against the internal control genes topB, trkA and polA. Shown are the averages and standard deviations of three independent experiments. C. Cell viability of strains MG1655 (filled diamonds) and MG1655ΔkdpA (open diamonds) in K0.2 medium upon MG challenge. Error bars indicate the standard deviation of three independent experiments.

Similar articles

Cited by

References

    1. Aldini G, Facino RM, Beretta G, Carini M. Carnosine and related dipeptides as quenchers of reactive carbonyl species: from structural studies to therapeutic perspectives. Biofactors. 2005;24:77–87. - PubMed
    1. Almeida Cd. 2009. Modelling of the protection mechanisms against methylgyoxal stress in Escherichia coli [electronic resource]: dynamical analysis and experimental validation. University of Aberdeen.
    1. Aslund F, Zheng M, Beckwith J, Storz G. Regulation of the OxyR transcription factor by hydrogen peroxide and the cellular thiol-disulfide status. Proc Natl Acad Sci USA. 1999;96:6161–6165. - PMC - PubMed
    1. Barnes WM, Tuley E. DNA sequence changes of mutations in the histidine operon control region that decrease attenuation. J Mol Biol. 1983;165:443–459. - PubMed
    1. Booth IR, Edwards MD, Miller S. Bacterial ion channels. Biochemistry. 2003;42:10045–10053. - PubMed

Publication types

MeSH terms