Review
. 2013 Nov 4;52(21):12216-22.
doi: 10.1021/ic400404g. Epub 2013 May 6.

Imaging DNA with fluorochrome bearing metals

Affiliations
Review

Imaging DNA with fluorochrome bearing metals

Hoonsung Cho et al. Inorg Chem. .

Abstract

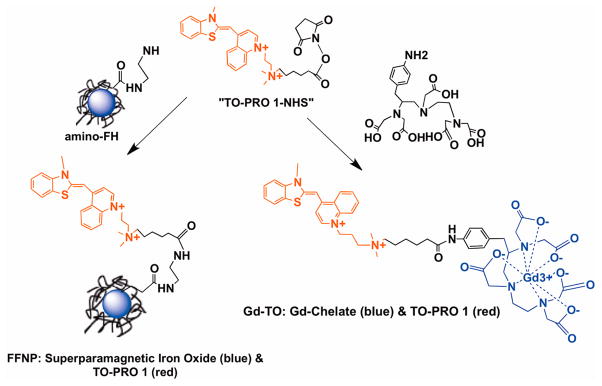
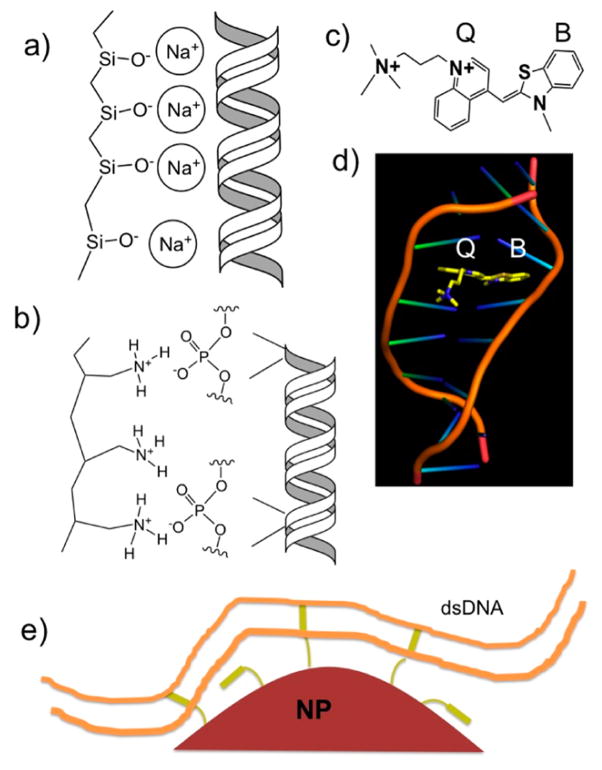
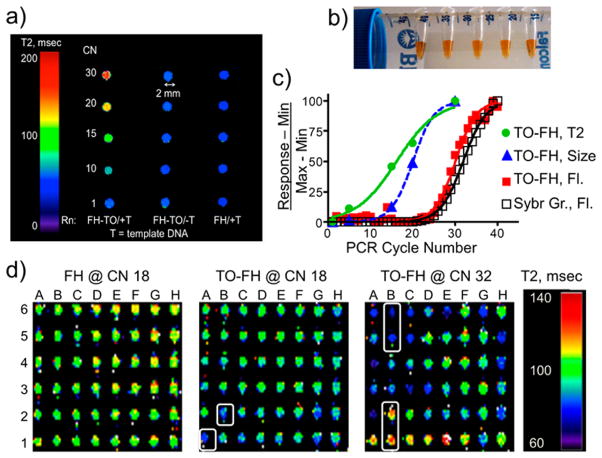
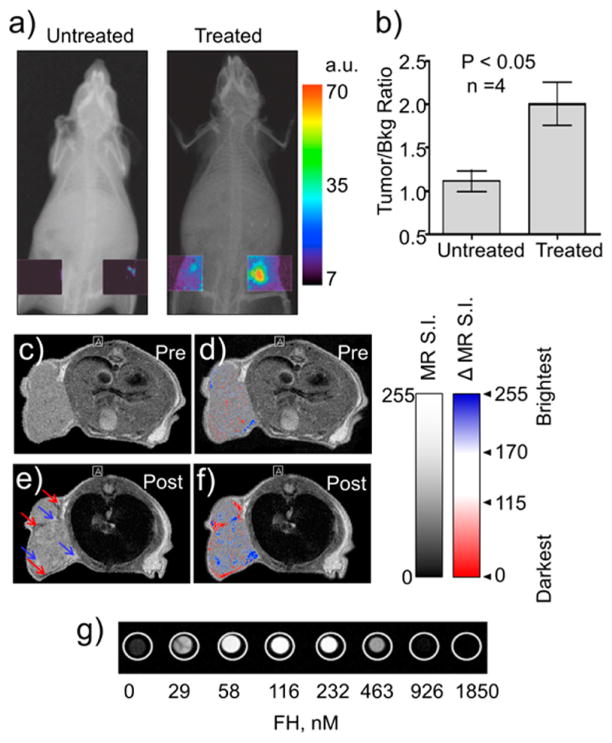
Molecules that fluoresce upon binding DNA are widely used in assaying and visualizing DNA in cells and tissues. However, using light to visualize DNA in animals is limited by the attenuation of light transmission by biological tissues. Moreover, it is now clear that DNA is an important mediator of dead cell clearance, coagulation reactions, and an immunogen in autoimmune lupus. Attaching metals (e.g., superparamagnetic nanoparticles, gadolinium ions, radioactive metal ions) to DNA-binding fluorochromes provides a way of imaging DNA in whole animals, and potentially humans, without light. Imaging metal-bearing, DNA-binding fluorochromes and their target DNA by magnetic resonance imaging may shed light on the many key roles of DNA in health and disease beyond the storage of genetic information.


Conflict of interest statement

The authors declare no competing financial interest.

Figures

Figure 1
Figure 1
Syntheses of fluorochrome–metal compounds. A common intermediate is TO-PRO 1 NHS, an N-hydroxysuccinimide ester of TO-PRO 1. TO-PRO 1 is red. TO-PRO 1 NHS can be reacted with amino-Feraheme, an aminated version of the FH NP, to yield a FFNP. The NHS also yields Gd-TO, a DNA-binding metal chelate. FFNPs are 20–50 nm in diameter, while Gd-TO is about 1000 Da, far smaller.
Figure 2
Figure 2
Electrostatic versus intercalation binding modes with DNA. (a) Ion-mediated (high ionic strength) binding of DNA and silica. (b) Salt-bridge binding between primary amines and phosphates of DNA. (c) TO-PRO 1 structure containing quinoline (Q) and benzothiazole (B) rings that intercalate into DNA. (d) Intercalation of TO-PRO 1 and double-stranded (ds)DNA. (e) FFNP featuring multiple TO-PRO 1 species (yellow) that intercalate into the dsDNA (orange). Some fluorochromes intercalate and some do not, with those failing to intercalate failing to fluoresce, as shown in Figure 4d. Base pairs are not shown.
Figure 3
Figure 3
Formation of microaggregates when DNA reacts with a FFNP (TO-FH) by AFM or light scattering. (a) Schematic depiction of the reaction between DNA and FFNP. AFM of DNA, the FFNP, and microaggregates in topographic (b) and phase images (c). The formation of microaggregates can also be monitored, as the DNA concentration increases, by dynamic light scattering (d). Reproduced with permission from Cho and Alcantara.,
Figure 4
Figure 4
Reaction between FFNPs (TO-FHs) and DNA by T2 and light scattering. These techniques measure FFNP/DNA micro-aggregate formation. Microaggregate response was measured by T2 changes (a) or by light scattering (b) and compared with fluorescence. Data were analyzed by the logit equation (c). Detection by microaggregate-based techniques occurs at lower concentrations than detection by fluorescence. (d) Monovalent and divalent binding modes: the monomeric TO-PRO 1 produces its full fluorescence (blue) upon binding to DNA. A multivalent FFNP is represented as a simplified divalent fluorochrome (gray). The FFNP has DNA-binding modes that are inefficient with respect to fluorochrome activation (white-to-blue transition). Reproduced from ref .
Figure 5
Figure 5
Monitoring PCR-generated DNA by MRI with standard PCR tubes or RT-PCR microtiter plate formats. (a) PCR reaction tubes shown in part b were imaged using a model PCR reaction at various PCR cycles (1, 10, 15, 20, and 30). With complete reagents and an FFNP (TO-FH), T2 changed in a cycle-dependent fashion. Leaving out template DNA (T) or using a NP lacking the DNA-binding fluorochrome (FH) resulted in a constant T2 at all cycle numbers. PCR tubes were sealed during T2 determination, avoiding postamplification contamination. (c) Changes in T2, microaggregate size (light scattering), or fluorescence (Fl) as a function of the PCR cycle number. Microaggregate formation, by T2 (relaxometry at 0.47 T) or light scattering, is a more sensitive method of detecting PCR DNA than fluorescence. (d) Detection of apoptosis-related gene expression by RT-PCR using TO-FH with a microtiter plate format. Commercial microtiter plates contained different primers for apoptosis-related mRNAs, with mRNA from Jurkat cells added to all wells. Either TO-FH or FH was added to plates and PCR cycling initiated. After 18 PCR cycles, wells with TO-FH but not FH show small T2 changes. After 32 cycles and with TO-FH, T2 changes are greater than those at 18 cycles. TO-FH, and not FH, reacts with products of the RT-PCR reaction in a cycle-dependent fashion. MRI was at 4.7 T. Reproduced from ref .
Figure 6
Figure 6
Imaging tumor DNA with TO-FH by surface fluorescence and MRI. Surface fluorescence is shown in parts a and b and MRI in parts c–g. (a) Tumor surface fluorescence after TO-FH injection with untreated and treated (5FU/oxaliplatin) HT-29 xenografts. (b) Tumor fluorescence, as a tumor/bkg ratio of fluorescence. (c) Pre-TO-FH MR signal intensity image. (d) Colorized version of part c with areas of highest signal intensity (brightest, blue) and lowest signal intensity (darkest, red) shown. Tumor is relatively uniform in signal intensity by MR signal intensity (c), with a few areas of high or low signal intensity shown by colorization (d). (e) Postinjection MR signal intensity image. Regions of brightening (blue arrows) and darkening (red arrows) are seen. (f) Image from part e, with areas of highest signal intensity (brightest, blue) and lowest signal intensity (darkest, red) shown. (g) Phantom image of FH solutions at varying concentrations of FH, in a nanomolar FH crystal. Using T1-weighted pulse sequences, TO-FH can brighten or darken MR images, either of a tumor (f) or phantoms (g). Reproduced from ref .
Figure 7
Figure 7
Gd-TO binding to the DNA necrotic Jurkat cells and to the DNA of an infarcted (necrotic) myocardium. (a) Phase contrast and fluorescence microscopy of Jurkat cells with and without treatment with CPT, which produces plasma membrane permeability. CPT induces Gd-TO (GadoTO) binding (green) that occurs in the nucleus by colocalization with a Hoechst nuclear stain (blue). b) Schematic depiction of part a. CPT induces plasma membrane breakdown. Gd-TO enters cells, binds to DNA, and fluoresces (red) upon DNA binding. Gadolinium metal (black circle) therefore binds DNA via TO (blue = nonfluorescent TO or red = fluorescent TO). Parts c–f show MRI of two beating mouse hearts induced into necrosis by a ligation/ischemia for 18 h. Mice were injected with Gd-TO (c and d) or Gd-DTPA (e and f). T1 relaxation time in reciprocal seconds is shown on a color scale (d and f). Both mice had extensive infarcts but hearts were beating. Accumulation of Gd-TO is seen in the infarct, producing signal hyperintensity (brightening, c) and high R1 values (d). Thus, Gd-TO (c and d) is retained in acute myocardial infarcts, while Gd-DTPA is not (e and f). (g) Dependence of Gd-TO binding to infarcted myocardium with duration of infarct. Gd-TO binding increases (0–18 h) and then declines as DNA (18–100 h) is removed. When the infarct is 100 h old, Gd-TO no longer binds. Gd-TO binding can therefore be used to tell the age of a necrotic artifact. From refs and .

Similar articles

Cited by

References

    1. Alcantara D, Guo Y, Yuan H, Goergen CJ, Chen HH, Cho H, Sosnovik DE, Josephson L. Angew Chem, Int Ed. 2012;51:6904–6907. - PMC - PubMed
    1. Cho H, Alcantara D, Yuan H, Sheth RA, Chen HH, Huang P, Andersson SB, Sosnovik DE, Mahmood U, Josephson L. ACS Nano. 2013 - PMC - PubMed
    1. Garanger E, Hilderbrand SA, Blois JT, Sosnovik DE, Weissleder R, Josephson L. Chem Commun. 2009:4444–4446. - PMC - PubMed
    1. Huang S, Chen HH, Yuan H, Dai G, Schuhle DT, Mekkaoui C, Ngoy S, Liao R, Caravan P, Josephson L, Sosnovik DE. Circ: Cardiovasc Interventions. 2011;4:729–737. - PMC - PubMed
    1. Pisetsky DS, Fairhurst AM. Autoimmunity. 2007;40:281–284. - PubMed

MeSH terms