

Perceptual integration for qualitatively different 3-D cues in the human brain
- PMID: 23647559
- PMCID: PMC3785137
- DOI: 10.1162/jocn_a_00417
Perceptual integration for qualitatively different 3-D cues in the human brain
Abstract
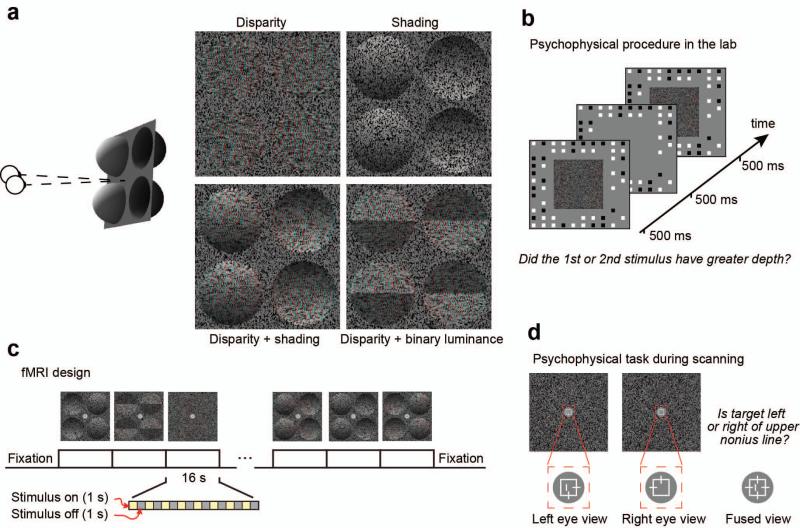
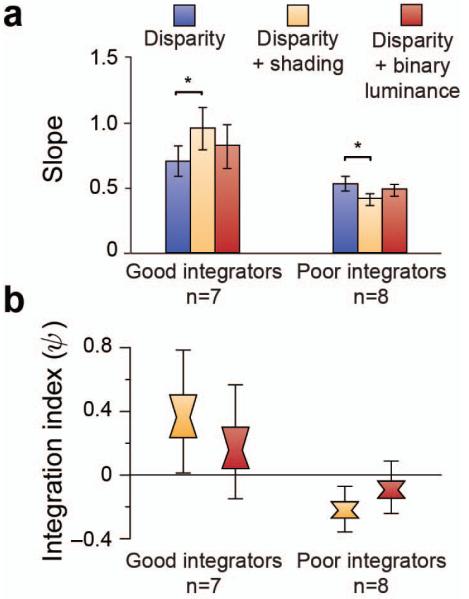
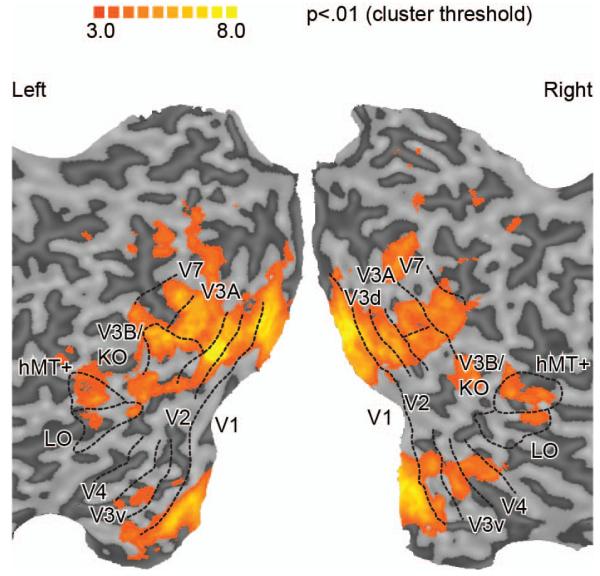
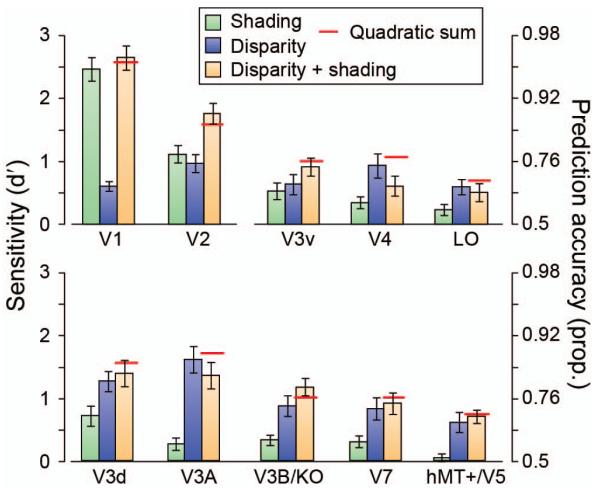
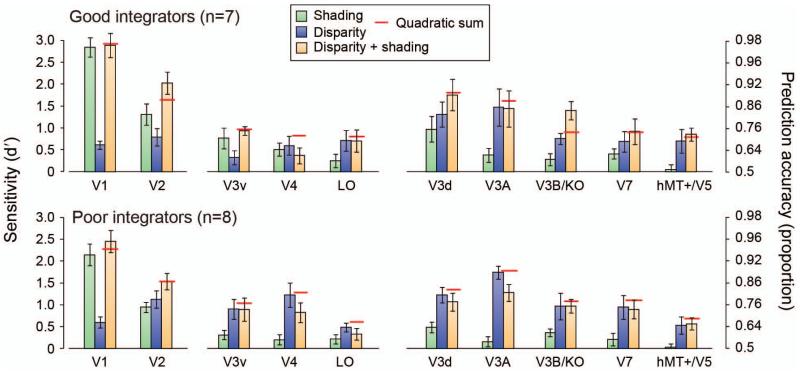
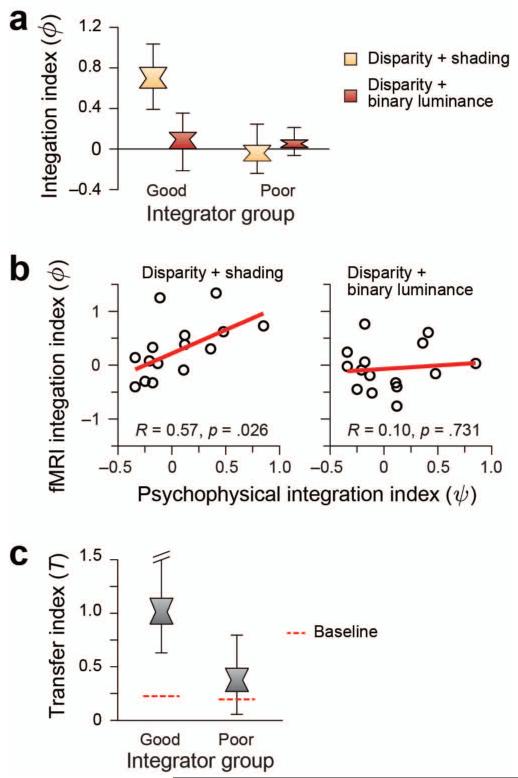
The visual system's flexibility in estimating depth is remarkable: We readily perceive 3-D structure under diverse conditions from the seemingly random dots of a "magic eye" stereogram to the aesthetically beautiful, but obviously flat, canvasses of the Old Masters. Yet, 3-D perception is often enhanced when different cues specify the same depth. This perceptual process is understood as Bayesian inference that improves sensory estimates. Despite considerable behavioral support for this theory, insights into the cortical circuits involved are limited. Moreover, extant work tested quantitatively similar cues, reducing some of the challenges associated with integrating computationally and qualitatively different signals. Here we address this challenge by measuring fMRI responses to depth structures defined by shading, binocular disparity, and their combination. We quantified information about depth configurations (convex "bumps" vs. concave "dimples") in different visual cortical areas using pattern classification analysis. We found that fMRI responses in dorsal visual area V3B/KO were more discriminable when disparity and shading concurrently signaled depth, in line with the predictions of cue integration. Importantly, by relating fMRI and psychophysical tests of integration, we observed a close association between depth judgments and activity in this area. Finally, using a cross-cue transfer test, we found that fMRI responses evoked by one cue afford classification of responses evoked by the other. This reveals a generalized depth representation in dorsal visual cortex that combines qualitatively different information in line with 3-D perception.
Figures
Similar articles
-
fMRI Analysis-by-Synthesis Reveals a Dorsal Hierarchy That Extracts Surface Slant.J Neurosci. 2015 Jul 8;35(27):9823-35. doi: 10.1523/JNEUROSCI.1255-15.2015. J Neurosci. 2015. PMID: 26156985 Free PMC article.
-
The integration of motion and disparity cues to depth in dorsal visual cortex.Nat Neurosci. 2012 Feb 12;15(4):636-43. doi: 10.1038/nn.3046. Nat Neurosci. 2012. PMID: 22327475 Free PMC article. Clinical Trial.
-
Late development of cue integration is linked to sensory fusion in cortex.Curr Biol. 2015 Nov 2;25(21):2856-2861. doi: 10.1016/j.cub.2015.09.043. Epub 2015 Oct 17. Curr Biol. 2015. PMID: 26480841 Free PMC article.
-
The Human Brain in Depth: How We See in 3D.Annu Rev Vis Sci. 2016 Oct 14;2:345-376. doi: 10.1146/annurev-vision-111815-114605. Epub 2016 Jul 22. Annu Rev Vis Sci. 2016. PMID: 28532360 Review.
-
7 tesla FMRI reveals systematic functional organization for binocular disparity in dorsal visual cortex.J Neurosci. 2015 Feb 18;35(7):3056-72. doi: 10.1523/JNEUROSCI.3047-14.2015. J Neurosci. 2015. PMID: 25698743 Free PMC article.
Cited by
-
Disparity in Context: Understanding how monocular image content interacts with disparity processing in human visual cortex.Neuroimage. 2021 Aug 15;237:118139. doi: 10.1016/j.neuroimage.2021.118139. Epub 2021 May 5. Neuroimage. 2021. PMID: 33964460 Free PMC article.
-
Unique Neural Activity Patterns Among Lower Order Cortices and Shared Patterns Among Higher Order Cortices During Processing of Similar Shapes With Different Stimulus Types.Iperception. 2021 May 26;12(3):20416695211018222. doi: 10.1177/20416695211018222. eCollection 2021 May-Jun. Iperception. 2021. PMID: 34104383 Free PMC article.
-
Generalized Representation of Stereoscopic Surface Shape and Orientation in the Human Visual Cortex.Front Hum Neurosci. 2019 Aug 20;13:283. doi: 10.3389/fnhum.2019.00283. eCollection 2019. Front Hum Neurosci. 2019. PMID: 31481886 Free PMC article.
-
Proscription supports robust perceptual integration by suppression in human visual cortex.Nat Commun. 2018 Apr 17;9(1):1502. doi: 10.1038/s41467-018-03400-y. Nat Commun. 2018. PMID: 29666361 Free PMC article.
-
Detection of Static and Dynamic Stereopsis after Femtosecond Laser Small Incision Lenticule Extraction for High Myopia.J Ophthalmol. 2021 Jun 11;2021:6667263. doi: 10.1155/2021/6667263. eCollection 2021. J Ophthalmol. 2021. PMID: 34221494 Free PMC article.
References
-
- Anzai A, Ohzawa I, Freeman RD. Joint-encoding of motion and depth by visual cortical neurons: neural basis of the Pulfrich effect. Nat Neurosci. 2001;4:513–518. - PubMed
-
- Atkins JE, Fiser J, Jacobs RA. Experience-dependent visual cue integration based on consistencies between visual and haptic percepts. Vision Research. 2001;41:449–461. - PubMed
-
- Belhumeur PN, Kriegman DJ, Yuille AL. The bas-relief ambiguity. International Journal of Computer Vision. 1999;35:33–44.
-
- Blake A, Zisserman A, Knowles G. Surface descriptions from stereo and shading. Image Vision Comput. 1985;3:183–191.
Publication types
MeSH terms
Substances
Grants and funding
LinkOut - more resources
Full Text Sources
Other Literature Sources
Research Materials