. 2013 May 7:14:306.
doi: 10.1186/1471-2164-14-306.

A roadmap of cell-type specific gene expression during sequential stages of the arbuscular mycorrhiza symbiosis

A roadmap of cell-type specific gene expression during sequential stages of the arbuscular mycorrhiza symbiosis

Claudia Hogekamp et al. BMC Genomics. .

Abstract

Background: About 80% of today's land plants are able to establish an arbuscular mycorrhizal (AM) symbiosis with Glomeromycota fungi to improve their access to nutrients and water in the soil. On the molecular level, the development of AM symbioses is only partly understood, due to the asynchronous development of the microsymbionts in the host roots. Although many genes specifically activated during fungal colonization have been identified, genome-wide information on the exact place and time point of their activation remains limited.

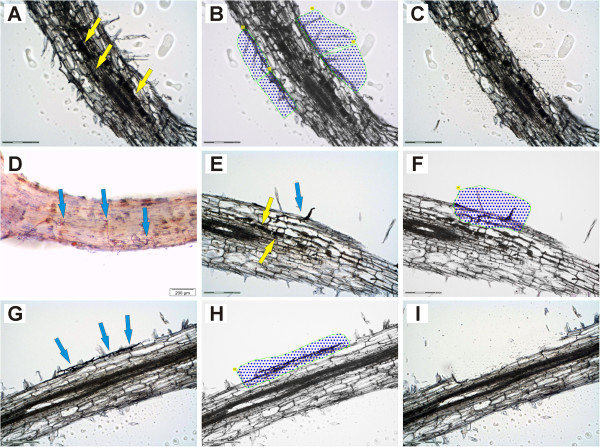
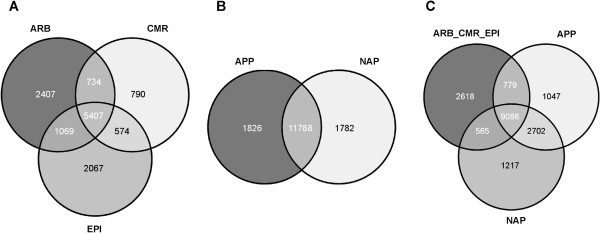
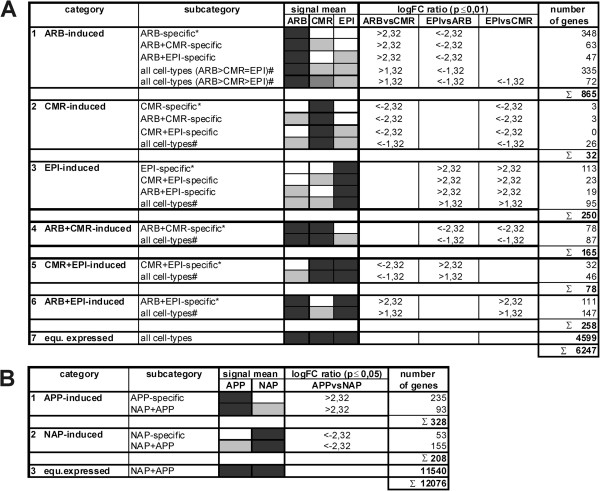
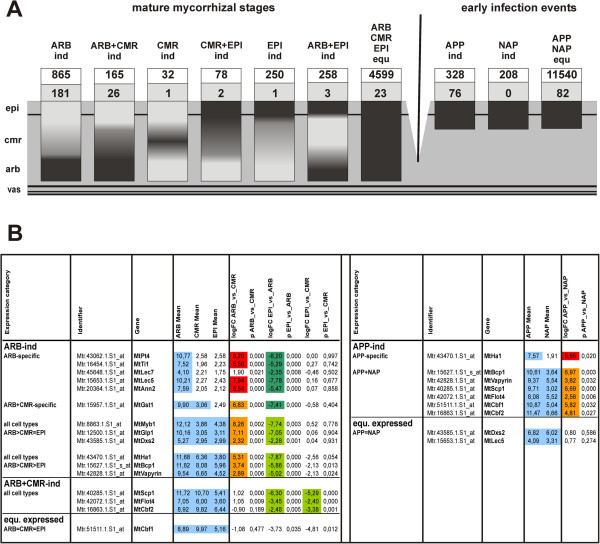
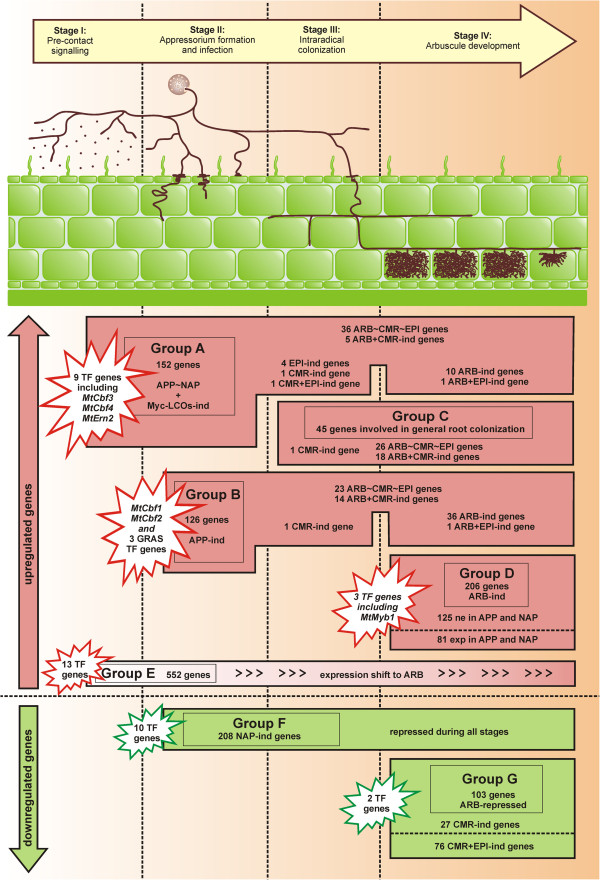
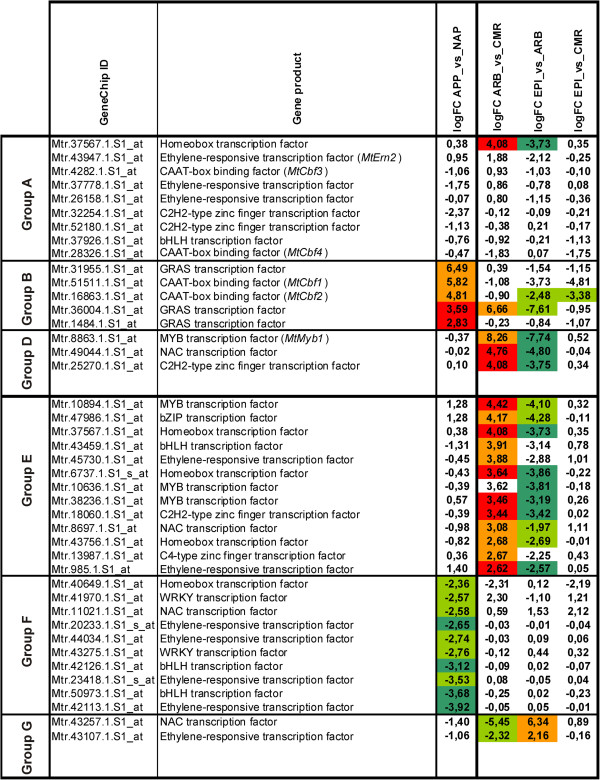
Results: In this study, we relied on a combination of laser-microdissection and the use of Medicago GeneChips to perform a genome-wide analysis of transcription patterns in defined cell-types of Medicago truncatula roots mycorrhized with Glomus intraradices. To cover major stages of AM development, we harvested cells at 5-6 and at 21 days post inoculation (dpi). Early developmental stages of the AM symbiosis were analysed by monitoring gene expression in appressorial and non-appressorial areas from roots harbouring infection units at 5-6 dpi. Here, the use of laser-microdissection for the first time enabled the targeted harvest of those sites, where fungal hyphae first penetrate the root. Circumventing contamination with developing arbuscules, we were able to specifically detect gene expression related to early infection events. To cover the late stages of AM formation, we studied arbusculated cells, cortical cells colonized by intraradical hyphae, and epidermal cells from mature mycorrhizal roots at 21 dpi. Taken together, the cell-specific expression patterns of 18014 genes were revealed, including 1392 genes whose transcription was influenced by mycorrhizal colonization at different stages, namely the pre-contact phase, the infection of roots via fungal appressoria, the subsequent colonization of the cortex by fungal hyphae, and finally the formation of arbuscules. Our cellular expression patterns identified distinct groups of AM-activated genes governing the sequential reprogramming of host roots towards an accommodation of microsymbionts, including 42 AM-activated transcription factor genes.

Conclusions: Our genome-wide analysis provides novel information on the cell-specific activity of AM-activated genes during both early and late stages of AM development, together revealing the road map of fine-tuned adjustments of transcript accumulation within root tissues during AM fungal colonization.


Figures

Figure 1
Figure 1
Laser-microdissection of epidermal cells from AM roots and of root areas containing appressoria. Collected areas are marked with blue dots framed in green. Arbuscules and appressoria are marked with yellow and blue arrows, respectively. Epidermal (EPI) samples (A-C) were collected from root areas containing mature mycorrhizal structures. The isolation of ARB and CMR cells from these samples has already been described in [32]. For the harvest of appressorial (APP) areas (D-I), roots were subjected to a short ink staining and screened for early infection units prior to embedding (D). During laser-microdissection, epidermal regions where fungal hyphae were penetrating the root and the cortical cells beneath were harvested for APP areas (F, H). In cases where arbuscules had already developed in the inner cortical cells (E, F), those cells were not included. Scale bars represent 200 μm for D and 150 μm for all other panels.
Figure 2
Figure 2
Gene expression in five cell-types of AM roots. A: Overview for ARB, CMR, and EPI cell-types. Genes were classified as expressed in a cell-type, if the corresponding mean signal intensity was larger than the threshold 2.58. B: Overview for APP and NAP cell-types. Genes were classified as expressed, if the corresponding mean signal intensity was larger than the threshold 2.95. Threshold values indicate the expression level of the arbuscule-specific MtPt4 gene in the respective cell-types. C: Overlap of genes expressed in ARB_CMR_EPI, APP or NAP. Abbreviations: ARB, cortical cells containing arbuscules; CMR, cortical cells from mycorrhizal roots; EPI, epidermal cells from mycorrhizal roots; ARB_CMR_EPI, non-redundant sum of genes expressed in ARB, CMR, and EPI cell-types; APP, appressorial areas; NAP, non-appressorial areas.
Figure 3
Figure 3
Classification of genes according to their specific expression patterns in five cell-types of AM roots. A: Genes expressed in ARB, CMR, and EPI were classified into seven categories. B: Genes expressed in APP and NAP were classified into three categories. While the 10 categories were defined on the basis of significant expression differences, all subcategories were differentiated based on detectable gene expression, using the MtPt4-thresholds as a reference. Grey-scaled boxes visualize different expression levels in the respective cell-types, ranging from white (no expression) to black (strong expression). Abbreviations: ARB, cortical cells containing arbuscules; CMR, cortical cells from mycorrhizal roots; EPI, epidermal cells from mycorrhized roots; APP, appressorial areas; NAP, non-appressorial areas; equ., equally; ind, induced; logFC, log2 fold-change; p, p-value. *To emphasize the importance of specific gene expression, genes were also considered as specific for a respective cell-type(s), if only one logFC ratio was above the threshold; # genes were also grouped into this subcategory if only one of the logFC ratios was significant; ∑: sum of genes in one category.
Figure 4
Figure 4
Gene expression in mature mycorrhizal stages and early infection events including AM marker genes. A: Visualization of gene expression patterns in AM roots for the seven categories referring to mature mycorrhizal stages and the three categories referring to early infection events, as defined in Figure 3. Overlaps between gene expression in mature mycorrhizal stages and early infection events is not shown in this diagram for reasons of simplicity. Numbers in white boxes represent the total number of genes in an expression category, numbers in grey boxes denote the overlap of this category with the 532 genes identified as “AM core set" due to a significant activation in whole roots by different AM fungi [32]. In total, cellular expression patterns were identified for 293 of all 532 genes from the AM core set. B: Detailed results for 16 AM marker genes, including mean signal intensities in the cell-types investigated, with signal intensities above the MtPt4 expression threshold being marked in blue. Expression differences between the cell-types are indicated as follows: red/dark green: expression difference (logFC≥2.32; p≤0.01) for genes expressed above the MtPt4 threshold in only one of the cell-types compared, orange/green: expression difference (logFC≥2.32; p≤0.01) for genes expressed above the MtPt4 threshold in both cell-types compared. Abbreviations: ARB, cortical cells containing arbuscules; CMR, cortical cells from mycorrhizal roots; EPI, epidermal cells from mycorrhizal roots; APP, appressorial areas; NAP, non-appressorial areas; vas, vascular tissue; ind, induced; equ., equally expressed; logFC, log2 fold-change; p, p-value.
Figure 5
Figure 5
A roadmap of cell-type specific gene expression during sequential stages of AM. Expression patterns of 1392 M. truncatula genes during four AM stages. Activated genes are shown in pink, repressed genes in green. Selected transcription factor genes (Figure 6) are highlighted. Group A: Genes with equal expression in APP and NAP that are induced by Myc-LCOs [10], thus probably activated before contact (stage I). Genes which were also expressed in mature mycorrhizal roots are listed. Group B: Genes induced in APP in comparison to NAP, thus being activated during initial intracellular infection (stage II). Genes also transcribed in mature mycorrhizal roots are listed. Group C: Genes with equal expression in all cell-types from mature mycorrhizal roots (ARB~CMR~EPI), induced in ARB and CMR alike (ARB+CMR) or being CMR-induced. Since these were not activated by Myc-LCOs or during appressorium formation, but induced in whole mycorrhizal roots (AM core set, [32]), they are probably activated during intraradical hyphal spread (stage III) and needed for general root colonization. Group D: Genes preferentially expressed in ARB. Whereas transcripts of 125 genes were not found in APP or NAP, 81 genes were only weakly expressed in APP or NAP, indicating specific or predominant activation during arbuscule formation (stage IV). Group E: Genes induced in ARB, and equally expressed in APP and NAP, thus undergoing an expression shift towards arbusculated cells. Group F: Genes induced in NAP in comparison to APP, thus being repressed upon infection. Group G: Genes exclusively induced in CMR or in CMR as well as EPI, thus being repressed during arbuscule formation. Abbreviations: LCOs, lipo-chitooligosaccharides; APP, appressorial areas; NAP, non-appressorial areas; ARB, cortical cells containing arbuscules; CMR, cortical cells from mycorrhizal roots; EPI, epidermal cells from mycorrhizal roots; ~, equal expression; ind, induced; exp, expressed; ne, not expressed.
Figure 6
Figure 6
Overview of transcription factor genes showing characteristic patterns of gene expression during AM development. Expression pattern of 42 transcription factor genes influenced by colonization with G. intraradices during four distinct stages of AM development and belonging to five of the six groups of genes defined in Figure 5. M. truncatula genes known from previous studies are shown. Expression differences between the cell-types are indicated as defined in Figure 4. Abbreviations: ARB, cortical cells containing arbuscules; CMR, cortical cells from mycorrhizal roots; EPI, epidermal cells from mycorrhizal roots; APP, appressorial areas; NAP, non-appressorial areas; logFC, log2 fold-change.

Similar articles

Cited by

References

    1. Schüßler A, Schwarzott D, Walker C. A new fungal phylum, the Glomeromycota: phylogeny and evolution. Mycol Res. 2001;105:1413–1421. doi: 10.1017/S0953756201005196. - DOI
    1. Redecker D, Kodner R, Graham LE. Glomalean fungi from the Ordovician. Science. 2000;289(5486):1920–1. doi: 10.1126/science.289.5486.1920. - DOI - PubMed
    1. Parniske M. Arbuscular mycorrhiza: the mother of plant root endosymbioses. Nat Rev Microbiol. 2008;6(10):763–75. doi: 10.1038/nrmicro1987. - DOI - PubMed
    1. Douds DD, Pfeffer PE, Shachar-Hill Y. In: Arbuscular Mycorrhizas Physiology and Function. Douds DD, Kalpunik Y, editor. Dordrecht, The Netherlands: Kluwer Academic Publishers; 2000. Carbon partioning, cost and metabolism of Arbuscular Mycorrhizae; pp. 107–130.
    1. Davies FT, Potter JR, Linderman RG. Drought Resistance of Mycorrhizal Pepper Plants Independent of Leaf P-Concentration - Response in Gas-Exchange and Water Relations. Physiol Plant. 1993;87(1):45–53. doi: 10.1111/j.1399-3054.1993.tb08789.x. - DOI

Publication types

MeSH terms