Review
. 2013;36(4):613-31.
doi: 10.3233/JAD-130485.

Amyloid-β positron emission tomography imaging probes: a critical review

Affiliations
Review

Amyloid-β positron emission tomography imaging probes: a critical review

Vladimir Kepe et al. J Alzheimers Dis. 2013.

Abstract

The rapidly rising prevalence and cost of Alzheimer's disease in recent decades has made the imaging of amyloid-β deposits the focus of intense research. Several amyloid imaging probes with purported specificity for amyloid-β plaques are currently at various stages of FDA approval. However, a number of factors appear to preclude these probes from clinical utilization. As the available "amyloid specific" positron emission tomography imaging probes have failed to demonstrate diagnostic value and have shown limited utility for monitoring therapeutic interventions in humans, a debate on their significance has emerged. The aim of this review is to identify and discuss critically the scientific issues contributing to the extensive inconsistencies reported in the literature on their purported in vivo amyloid specificity and potential utilization in patients.


Figures
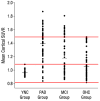
Fig. 1
Fig. 1
[18F]Florbetapir mean cortical SUVRs of subjects with probable AD (PAD) and mild cognitive impairment (MCI), as compared to older healthy controls (OHC) and young adults (YNC). The top and bottom red lines demarcate the SUVR range that most subjects fall into, regardless of their clinical diagnosis, while the middle line demarcates the highest SUVR values observed in young adults (YNC). Note the significant overlap among the groups. (From Fleisher et al. [3]; with permission)
Fig. 2
Fig. 2
Correlation between SUVRs of [18F]flutemetamol and [11C]PiB in the cortical region (A), lateral frontal region (B), striatum (C), and subcortical white matter (D) of AD patients (solid diamonds) and MCI patients (empty squares). (From Vandenberghe et al. [45]; with permission)
Fig. 3
Fig. 3
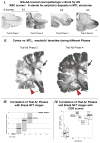
I. Phases of β-amyloidosis in medial temporal lobe (MTL) structures as described by Thal et al. (reference [17]) are incorporated in the NIA-AA revised neuropathologic criteria for AD diagnosis (references [14] and [15]). II. Relationship between cortical and MTL amyloid-β deposition is demonstrated on coronal brain tissue slices of a whole hemisphere stained with Campbell-Switzer silver stain (see Thal et al. [16]) for details) on an example of Thal Aβ Phase 2 case (left image) and an example of widespread amyloidosis in a Thal Aβ Phase 4 case (right image). Note that in Thal Aβ Phase 2 (equivalent to Braak amyloid stage B) some MTL structures (red arrowheads) already have amyloid-β deposits when amyloid-β deposition in neocortex is still confined to a limited number of neocortical brain regions (e.g. frontal lobe, temporal lobe) and many cortical brain regions still appear free of amyloid-β deposits (e.g. cingulate gyrus; large black arrows). In Thal Aβ Phase 4 (equivalent to Braak amyloid stage C) MTL structures beyond hippocampus show dense amyloid-β deposits comparable in density to other neocortical structures (right image) III. Correlation of Thal phases of β-amyloidosis in MTL structures with Braak NFT stages (from reference [17]). IV. Correlation of both pathology measures with pre-mortem CDR scores (from reference [16]). (This Figure contains parts of Figures from references [16] and [17]; with permission)
Fig. 4
Fig. 4
Mismatch between neuropathological results and ‘amyloid specific’ imaging probe signal in the medial temporal lobe. In AD medial temporal lobe structures have abundant amyloid-β deposit, both diffuse and neuritic plaques, comparable in density to those observed in the cortex as shown for temporal lobe by Price and Morris [72](upper image in the right column) and Thal and colleagues [16](lower image in the right column). Left column shows coronal view of the [11C]PiB PET image (upper image), of the MRI image from the same subject (lower image) and overlay of [11C]PiB PET image on MRI imaging for anatomical reference. Images in the central column show expanded temporal lobe structures on overlay of [11C]PiB PET image on MRI image (upper insert) and on the MRI image (lower image).The mismatch between amyloid PET imaging results and pathology in medial temporal lobe is demonstrated on an example of the AD [11C]PiB PET scan (upper image in the left row). The [11C]PiB PET signal is highly elevated throughout the cortex but is missing in the medial temporal lobe. Similar results have been reported for other “amyloid-specific” imaging probes. (This Figure contains parts of Figures from references [16] and [72]; with permission)
Fig. 5
Fig. 5
Coronal [11C]PiB PET/CT images fused with MR findings in patients with (left) melanoma metastasis and (right) meningioma. Both patients had tumors along the tentorium (From Bengel and Minoshima [78]; with permission)
Fig. 6
Fig. 6
Molecular structures, binding constants, SUVRs, and affinities of the Aβ imaging probes [11C]PiA and [11C]PiB vs. SUVR PET image. SUVR values are referenced to cerebellar grey matter and are therefore independent the influence of variable peripheral metabolism. Standardized uptake value ratio (SUVR) images, normalized to cerebellum, of two Alzheimer’s disease patients independently injected with both imaging probes ([11C]PiB, [26]; [11C]PiA, [84]). No color scale is available in the case of BTA-1. SUVR values are based on values reported in text on page 277 in [84]. (This Figure contains parts of Figures from references [26] and [84]; with permission)

Similar articles

Cited by

References

    1. Hardy J, Selkoe DJ. The amyloid hypothesis of Alzheimer’s disease: progress and problems on the road to therapeutics. Science. 2002;297:353–356. - PubMed
    1. Villemagne VL, Klunk WE, Mathis CA, Rowe CC, Brooks DJ, Hyman BT, Ikonomovic MD, Ishii K, Jack CR, Jagust WJ, Johnson KA, Koeppe RA, Lowe VJ, Masters CL, Montine TJ, Morris JC, Nordberg A, Petersen RC, Reiman EM, Selkoe DJ, Sperling RA, Van Laere K, Weiner MW, Drzezga A. Aβ Imaging: feasible, pertinent, and vital to progress in Alzheimer’s disease. Eur J Nucl Med Mol Imaging. 2012;39:209–219. - PMC - PubMed
    1. Fleisher AS, Chen K, Liu X, Roontiva A, Thiyyagura P, Ayutyanont N, Joshi AD, Clark CM, Mintun MA, Pontecorvo MJ, Doraiswamy PM, Johnson KA, Skovronsky DM, Reiman EM. Using positron emission tomography and florbetapir F18 to image cortical amyloid in patients with mild cognitive impairment or dementia due to Alzheimer disease. Arch Neurol. 2011;68:1404–1411. - PubMed
    1. Lee H, Zhu X, Castellani RJ, Nunomura A, Perry G, Smith MA. Amyloid-β in Alzheimer disease: The null versus the alternate hypotheses. J Pharm Experimental Therap. 2007;321:823–829. - PubMed
    1. Zhao LN, Long HW, Mu Y, Chew LY. The toxicity of amyloid β oligomers. Int J Mol Sci. 2012;13:7303–7327. - PMC - PubMed

Publication types