Review
. 2014 Jun:93 Pt 2:157-64.
doi: 10.1016/j.neuroimage.2013.04.095. Epub 2013 May 3.

In vivo architectonics: a cortico-centric perspective

Affiliations
Review

In vivo architectonics: a cortico-centric perspective

David C Van Essen et al. Neuroimage. 2014 Jun.

Abstract

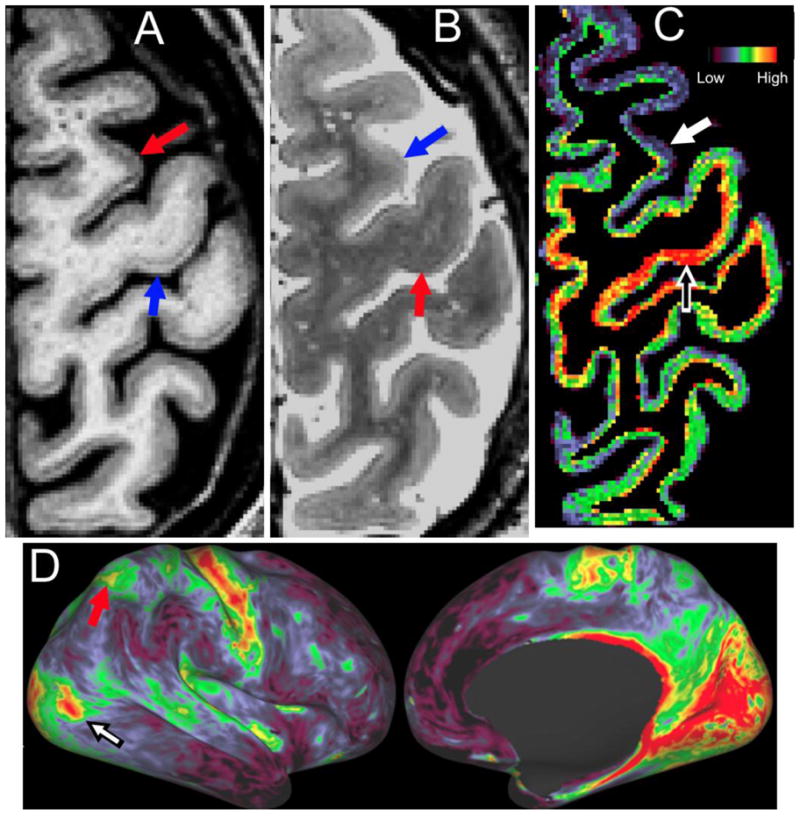
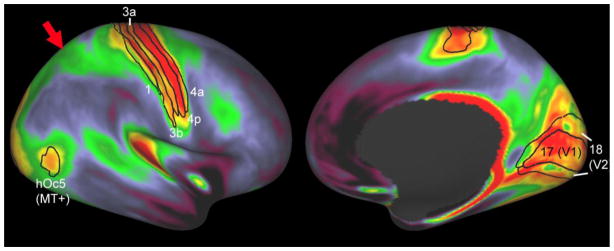
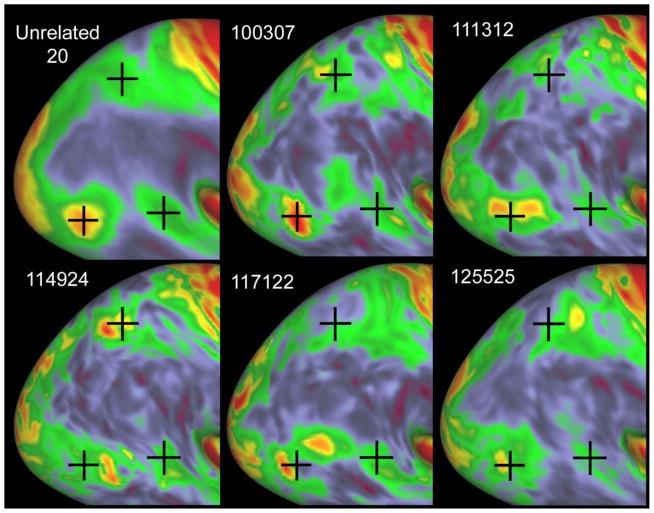
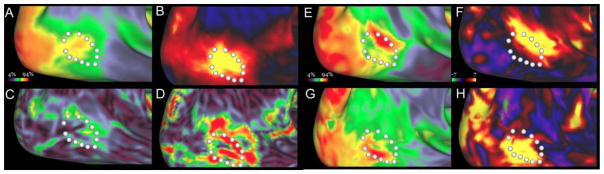
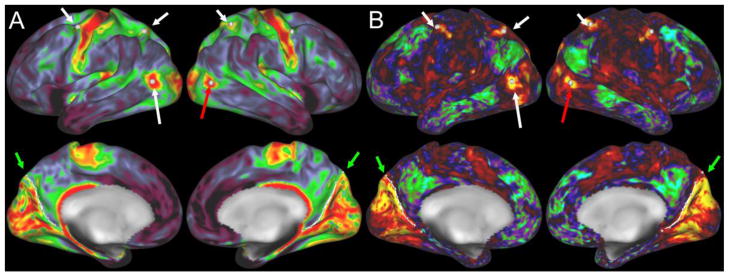
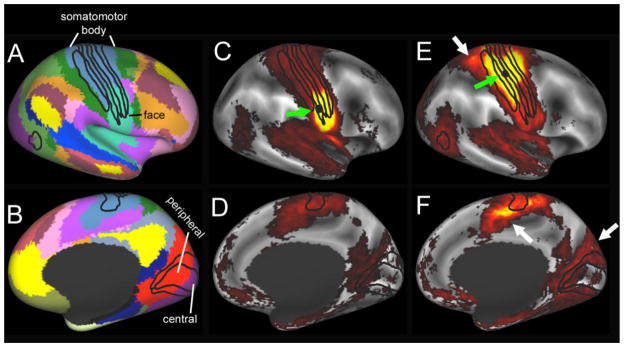
Recent advances in noninvasive structural imaging have opened up new approaches to cortical parcellation, many of which are described in this special issue on In Vivo Brodmann Mapping. In this introductory article, we focus on the emergence of cortical myelin maps as a valuable way to assess cortical organization in humans and nonhuman primates. We demonstrate how myelin maps are useful in three general domains: (i) as a way to identify cortical areas and functionally specialized regions in individuals and group averages; (ii) as a substrate for improved intersubject registration; and (iii) as a basis for interspecies comparisons. We also discuss how myelin-based cortical parcellation is complementary in important ways to connectivity-based parcellation using functional MRI or diffusion imaging and tractography. These observations and perspectives provide a useful background and context for other articles in this special issue.

Keywords: Cortical areas; Myelin; Networks; Parcellation; Registration.


Figures

Figure 1
Figure 1
Myelin content estimated by taking the voxelwise ratio of T1w (A) to T2w (B), and colorizing (C). D. Myelin map on inflated right hemisphere of the same subject, including heavily myelinated hotspots centered on area MT+ (black/white arrow) and in the intraparietal sulcus (red arrow).
Figure 2
Figure 2
Group average myelin map from the HCP Unrelated 20 subjects (ref). Black contours indicate areal boundaries of somatosensory (1,3a,3b), motor (4a,4p), and visual (17=V1, 18=V2, and hOc5 = MT+) areas from probabilistic cytoarchitectonic maps registered to the atlas surface (Fischl et al., 2008). Red arrow shows strip of moderately myelinated cortex in medial parietal cortex.
Figure 3
Figure 3
Myelin maps for the group average plus five individual HCP subjects, displayed on lateral views of the very inflated group average surface. Myelin maps were generated from the HCP Q1 open access dataset (based on methods described in Glasser et al., 2013a) and were further processed by a normalization step that compensates for bias specific to the HCP Skyra scanner.
Figure 4
Figure 4
Myelin maps compared to tfMRI motion activation maps in a group average (upper left) vs individual subjects. A. Group average myelin map from 10 subjects (14 scans, including four repeat subjects) from a pilot HCP dataset. B. Group average motion activation from the same population. C. Spatial gradient of group average myelin map. D. Spatial gradient of group average motion map. E, F. Myelin map and task activation hotspots are colocalized in one subject. G, H. In a different subject, myelin map and task activation are again colocalized, but in a different location relative to the group-average MT+ border. Adapted from Glasser et al., 2012a).
Figure 5
Figure 5
Correlations between myelin hotspots and functional connectivity in an individual HCP subject 100307. A. Myelin map for this subject, with highlighted vertices indicating a seed location in right MT+ (red arrow) and additional myelin hotspots in frontal (FEF) and parietal cortex. B. Functional connectivity map associated with the seed location in right MT+ shows strong colocalization of functional connectivity hotspots with myelin hotspots in panel A.
Figure 6
Figure 6
A, B. Functional network parcellation by Yeo et al. (2011) shows functional network boundaries that cut midway through architectonically-defined somatosensory areas (panel A) and visual areas (panel B). C – F. Functional connectivity maps from the HCP Q1 unrelated 20 group average 20 for seeds within area 3b face representation (panels C, D) and upper body representation (panels E, F), including the arm and hand.

References

    1. Allman JM. Evolution of the visual system in early primates. In: Sprague J, Epstein A, editors. Progress in Physiological Pscyhology. Academic Press; 1977. pp. 1–53.
    1. Allman JM. In: Evolving Brains. Freeman WH, editor. Scientific American Library; New York: 2000.
    1. Amunts K, Malikovic A, Mohlberg H, Schormann T, Zilles K. Brodmann’s Areas 17 and 18 Brought into Stereotaxic Space--Where and How Variable? NeuroImage. 2000;11:66–84. - PubMed
    1. Anticevic A, Dierker DL, Gillespie SK, Repovs G, Csernansky JG, Van Essen DC, Barch DM. Comparing surface-based and volume-based analyses of functional neuroimaging data in patients with schizophrenia. Neuroimage. 2008b;41:835–848. - PMC - PubMed
    1. Beckmann M, Johansen-Berg H, Rushworth MF. Connectivity-based parcellation of human cingulate cortex and its relation to functional specialization. J Neurosci. 2009;29:1175–1190. - PMC - PubMed

Publication types