. 2013 Oct;28(10):2122-35.
doi: 10.1002/jbmr.1954.

Swedish mutant APP suppresses osteoblast differentiation and causes osteoporotic deficit, which are ameliorated by N-acetyl-L-cysteine

Affiliations

Swedish mutant APP suppresses osteoblast differentiation and causes osteoporotic deficit, which are ameliorated by N-acetyl-L-cysteine

Wen-Fang Xia et al. J Bone Miner Res. 2013 Oct.

Abstract

Reduced bone mineral density and hip fracture are frequently observed in patients with Alzheimer's disease (AD). However, mechanisms underlying their association remain poorly understood. Amyloid precursor protein (APP) is a transmembrane protein that is ubiquitously expressed in bone marrow stromal cells (BMSCs), osteoblasts (OBs), macrophages (BMMs), and osteoclasts (OCs). Mutations in the APP gene identified in early-onset AD patients are believed to cause AD. But little is known about APP's role in bone remodeling. Here, we present evidence for Swedish mutant APP (APPswe) in suppression of OB differentiation and function in culture and in mouse. APP expression in BMSCs increases during aging. Ubiquitous expression of APPswe in young adult Tg2576 transgenic mice (under the control of a prion promoter) recaptured skeletal "aging-like" deficits, including decreased OB genesis and bone formation, increased adipogenesis and bone marrow fat, and enhanced OC genesis and bone resorption. Remarkably, selective expression of APPswe in mature OB-lineage cells in TgAPPswe-Ocn mice (under the control of osteocalcin [Ocn] promoter-driven Cre) also decreased OB genesis and increased OC formation, resulting in a trabecular bone loss. These results thus suggest a cell-autonomous role for APPswe in suppressing OB formation and function, but a nonautonomous effect on OC genesis. Notably, increased adipogenesis and elevated bone marrow fat were detected in young adult Tg2576 mice, but not in TgAPPswe-Ocn mice, implying that APPswe in BMSCs and/or multicell types in bone marrow promotes bone marrow adipogenesis. Intriguingly, the skeletal aging-like deficits in young adult Tg2576 mice were prevented by treatment with N-acetyl-L-cysteine (NAC), an antioxidant, suggesting that reactive oxygen species (ROS) may underlie APPswe-induced osteoporotic deficits. Taken together, these results demonstrate a role for APPswe in suppressing OB differentiation and bone formation, implicate APPswe as a detrimental factor for AD-associated osteoporotic deficit, and reveal a potential clinical value of NAC in the treatment of osteoporotic deficits. © 2013 American Society for Bone and Mineral Research.

Keywords: ALZHEIMER'S DISEASE; APP; NAC; OSTEOBLAST; OSTEOPOROSIS.


Conflict of interest statement

All authors state that they have no conflicts of interest.

Figures

Fig. 1.
Fig. 1.
Age-dependent increase of endogenous APP protein levels in BMSCs. (A, B) Western blot analysis of endogenous APP levels in differently-aged purified BMSCs. The BMSCs were isolated from indicated aged WT mice and purified as described in Subjects and Methods. The data were quantified by NIH ImageJ software, normalized by that in 3-month-old BMSCs, and presented in B (mean±SD, n=3). (C, D) Immunohistochemical staining analysis of Aβ (by 6E10 antibody) in femur and tibia sections from 1-year-old WT and Tg2576 mice. The representative images are shown in C. Inserts are amplified images indicated in the dotted square. The 6E10 staining signals in osteocytes and bone marrow cells were quantified (positive cells/total cells in a selective region; e.g., BMcells, %) and presented in D (mean±SD, n=5 femur samples per genotype). *pμ0.05, significant difference from the WT control. (E) Representative images of Congo Red staining analysis of Aβ in femur sections from 1-year-old WT and Tg2576 mice.
Fig. 2.
Fig. 2.
Decrease of bone formation in neonatal Tg2576 mice. (A, B) Reduced bone formation in 1-month-old Tg2576 mice was detected by dynamic histomorphometric measurements of double-fluorescent-labeled femurs. WT and Tg2576 mice at P16 were injected (intraperitoneal) with fluorochromelabeled calcein green (10 mg/kg; Sigma-Aldrich), and 12 days after (P28), they were reinjected to label active bone-forming surfaces. At P30, mice were euthanized and the left femur was fixed in 70% EtOH, sectioned at 20μm, and viewed by fluorescence microscope, as shown in A. The endocortical mineral apposition rate (Ec.MAR) calculated in micrometers per day (μm/d) and the bone formation rate (Ec.BFR=MAR×mineralization surface/bone surface) from fluorochrome double-labels at the endocortical surfaces are illustrated in B. (C, D) Decreased osteoid numbers of trabecular bones in 4-month-old Tg2576 femurs were viewed by Goldner’s trichrome staining analysis. Images are shown in C, and quantification analysis of osteoid numbers per unit of bone surface is presented in D. (E) Reduced immunostaining signals of osteocalcin in 4-month-old Tg2576 femur sections, as compared with that in WT femurs, is shown. (F) Decreased serum levels of osteocalcin, measured by ELISA assays, in 4-month-old Tg2576 mice are presented. In B, D, and F, the values of mean±SD from 5 different animals per genotype are shown. *p<0.05, significantly different from the WT control.
Fig. 3.
Fig. 3.
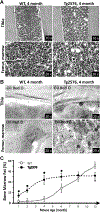
Increase of bone marrow fat in young adult Tg2576 mice. H&E (A) and Oil Red O (B) staining analyses show increases in bone marrow fat-containing cells in Tg2576 mice at 4 months old. (C) Quantification analysis of bone marrow fat cells over total bone marrow cells in femur mid-diaphysis is presented. Mice at indicated age groups (5 mice per age group per genotype, males and females) were examined. Increases in bone marrow fat were only detected in young (1–6 months old) Tg2576 mice (as compared with WT controls of the same age).
Fig. 4.
Fig. 4.
Reduced vitro OB formation and function in Tg2576-BMSC culture. BMSCs from 2-month-old WT and Tg2576 femurs were induced for OB differentiation (see Subjects and Methods). ALP staining images at day 7 and 14 cultures are shown (A), and ALP activity (ALP positive area/over total area, normalized by day 3 WT culture) is also presented (B).(C) Real-time PCR analysis of osteocalcin expression in un-induced (N) andOB-induced (I-OB) cultures (day 14). At day 28 of culture, cells were von Kossa-stained (D), and the von Kossa staining data was quantified and is illustrated (E). In B, C,and E, the values of mean ± SD (n = 3 different cultures) are presented. *p < 0.01, significant decrease compared to the WT control.
Fig. 5.
Fig. 5.
Elevation of in vitro adipogenesis in Tg2576-whole bone marrow and Tg2576-BMSC cultures. (A, B) Whole bone marrow cells from femurs of WT and Tg2576 mice (4 months old) were induced for adipocyte differentiation for 2 weeks (see Subjects and Methods). Cells were stained with Oil Red O (A), and the data were quantified (B). (C, D) Isolated BMSCs from WT and Tg2576 mice (4 months old) were induced for adipocyte differentiation as in A. The data was quantified and is shown in D. In B and D, the values of mean ± SD (n = 3 different experiments) are shown. **p < 0.01, significant difference from the WT control.
Fig. 6.
Fig. 6.
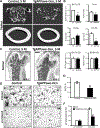
Loss of trabecular bone mass in TgAPPswe-Ocn femurs and decrease of in vitro OB genesis in TgAPPswe-Ocn-BMSC culture. (A, B) The μCT analysis of femurs from 5-month-old TgAPPswe-Ocn and control littermates (Tg[flox]APPswe). Five different mice of each genotype (males and females) were examined blindly. Representative 3D images are shown in A. Quantification analyses (mean ± SD, n = 5) are presented in B. * p < 0.05, significant difference from control littermates. Note that the trabecular bone (tb) volumes over total volumes (BV/TV), the trabecular bone numbers (Th.N), trabecular separation (Tb.Sp), and the connectivity density (CD) were all deficient in TgAPPswe-Ocn femurs as compared with the WT control. The cortical bone volumes over total volumes in TgAPPswe-Ocn appeared to be normal. (C, D) H&E staining analysis of femurs from 5-month-old control and TgAPPswe-Ocn mice. Representative images are shown in C.Bar= 10 μm. Quantification analyses (mean ± SD, n = 5) are presented in D. *p < 0.05, significant difference. (E, F) In vitro osteoblastogenesis showed decreased ALP+ cells derived from TgAPPswe-Ocn-BMSC culture. Representative images of ALP staining are shown in E, and the quantification analysis of the average ALP activities (mean ± SD from 3 different cultures) is presented in F. *p < 0.01, significant difference. Bar = 20 μm.
Fig. 7.
Fig. 7.
OC genesis in vitro and TRAP staining analysis in TgAPPswe-Ocn mice. (A, B) In vitro OC genesis of BMMs derived from control and TgAPPswe-Ocn mice (3 months old). OCs were generated from purified BMMs (5×10⁴) cultured in the presence of RANKL (100 ng/mL) and M-CSF (1%) for 6 days. Representative images of TRAP staining are shown in A. Quantitative analyses of the average TRAP-positive multinuclei cell (MNC) density (count TRAP + MNCs [>3 nuclei per cell] per unit area) are presented in B. The values of mean±SD from 3 separate cultures are shown. *p<0.05, significant difference from control. (C, D) TRAP staining analysis of femur sections from 5-month-old WT and TgAPPswe-Ocn mice. Representative images of TRAP staining are shown in C. Images marked with black squares were amplified and are shown in the bottom panels. The quantitative analysis of TRAP+ cells per unit bone surface (BS) was carried out in trabecular bones of femurs and is shown in D. The values of mean±SD from 3 different animals are shown.
Fig. 8.
Fig. 8.
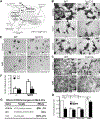
NAC rescue of APPswe-suppression of OB differentiation and APPswe-induction of adipogenesis in culture. (A) A schematic illustration of different antioxidants and DAPT’s effects on APP metabolism and oxidative stress. (B–D) Effects of EUK134, DAPT, and NAC on OB differentiation (viewed by ALP staining) of BMSCs derived from WT and Tg2576 mice. Representative images of ALP staining are shown in B and C, and the quantification analysis of the average ALP activities (normalized by WT control) is presented in D. (E, F) Effect of NAC on adipogenesis (viewed by Oil Red O staining) of BMSCs derived from WT and Tg2576 mice. Representative images of Oil Red O staining are shown in E, and the data were quantified and are shown in F. In D and F, the values of mean±SD from 3 different cultures are presented. *p<0.01, significant difference. (G) The table summarizes the effects of EUK134, DPI, and NAC on OB and OC genesis.
Fig. 9.
Fig. 9.
NAC amelioration of skeletal aging-like osteoporotic deficit in young adult Tg2576 mice. Tg2576 mice (at 1 month old, 5 per group, male and females) were fed drinking water containing with vehicle (Veh.) or NAC (2 mg/kg/d) for 3 months, and their femur bone samples and sera were collected for phenotypic analysis. (A, B) The μCT analysis displayed an increased trabecular bone volumes of NAC-treated Tg2576 femurs. In addition, the trabecular bone thickness (Tb.Th) and trabecular separation (Tb.Sp) were all ameliorated or improved by NAC treatment. The cortical bone volumes were unaffected by NAC. (C, D) Goldner’s trichrome staining analysis showed an increased osteoid numbers of trabecular bones in NAC-treated Tg2576 femurs. Representative images are shown in C, and the data were quantified (osteoid area/bone area, normalized by WT) and are shown in D. (E) Increased serum levels of osteocalcin in NAC-treated Tg2576 mice were detected by ELISA assays. In B, D, and E, the values of mean±SD from 5 different animals per genotype are shown. *p<0.05, significant difference.
Fig. 10.
Fig. 10.
NAC inhibition of bone resorption in Tg2576 mice and OC genesis in vitro. Measurements of serum levels of PYD (A) and IL-6 (B) in 4-month-old WT and Tg2576 mice treated with vehicle (Veh.) or NAC by RIA and ELISA analyses, respectively. Five mice per genotype (males and females) were measured. *p<0.05, significant difference from control. (C, D) Effects of NAC, EUK134, and DPI on in vitro OC genesis from BMMs. Representative images of TRAP staining are shown in C. Quantitative analyses of the average TRAP-positive multinuclei cell (MNC) density (count TRAPþMNCs [>3 nuclei per cell] per unit area) are presented in D. The values of mean±SD from 3 separate cultures are shown. *p<0.05, significant difference from control.

Comment in

Similar articles

Cited by

References

    1. Davies L, Wolska B, Hilbich C, Multhaup G, Martins R, Simms G, Beyreuther K, Masters CL. A4 amyloid protein deposition and the diagnosis of Alzheimer’s disease: prevalence in aged brains determined by immunocytochemistry compared with conventional neuropathologic techniques. Neurology. 1988;38:1688–93. - PubMed
    1. Tysiewicz-Dudek M, Pietraszkiewicz F, Drozdzowska B. Alzheimer’s disease and osteoporosis: common risk factors or one condition predisposing to the other?. Ortop Traumatol Rehabil. 2008;10: 315–23. - PubMed
    1. Melton LJ 3rd, Beard CM, Kokmen E, Atkinson EJ, O’Fallon WM. Fracture risk in patients with Alzheimer’s disease. J Am Geriatr Soc. 1994;42:614–9. - PubMed
    1. Tan ZS, Seshadri S, Beiser A, Zhang Y, Felson D, Hannan MT, Au R, Wolf PA, Kiel DP. Bone mineral density and the risk of Alzheimer disease. Arch Neurol. 2005;62:107–11. - PubMed
    1. Sato Y, Asoh T, Oizumi K. High prevalence of vitamin D deficiency and reduced bone mass in elderly women with Alzheimer’s disease. Bone. 1998;23:555–7. - PubMed

Publication types

MeSH terms