. 2013 Sep;62(9):3033-43.
doi: 10.2337/db12-1242. Epub 2013 May 6.

Tetrahydrobiopterin has a glucose-lowering effect by suppressing hepatic gluconeogenesis in an endothelial nitric oxide synthase-dependent manner in diabetic mice

Affiliations

Tetrahydrobiopterin has a glucose-lowering effect by suppressing hepatic gluconeogenesis in an endothelial nitric oxide synthase-dependent manner in diabetic mice

Abulizi Abudukadier et al. Diabetes. 2013 Sep.

Abstract

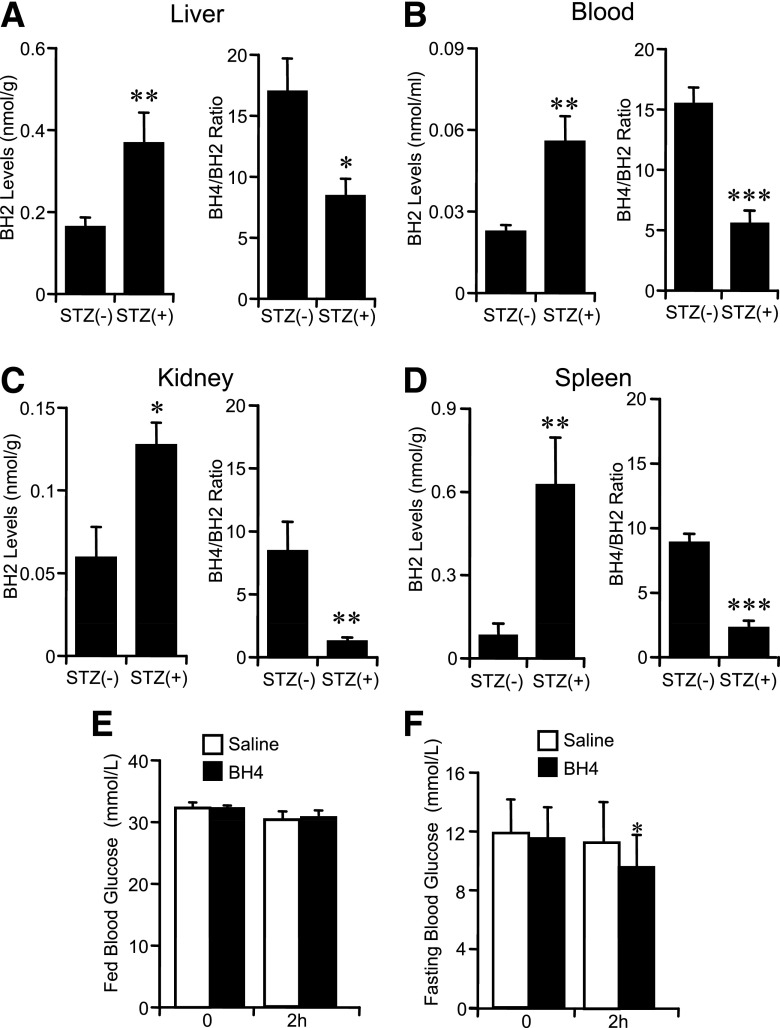
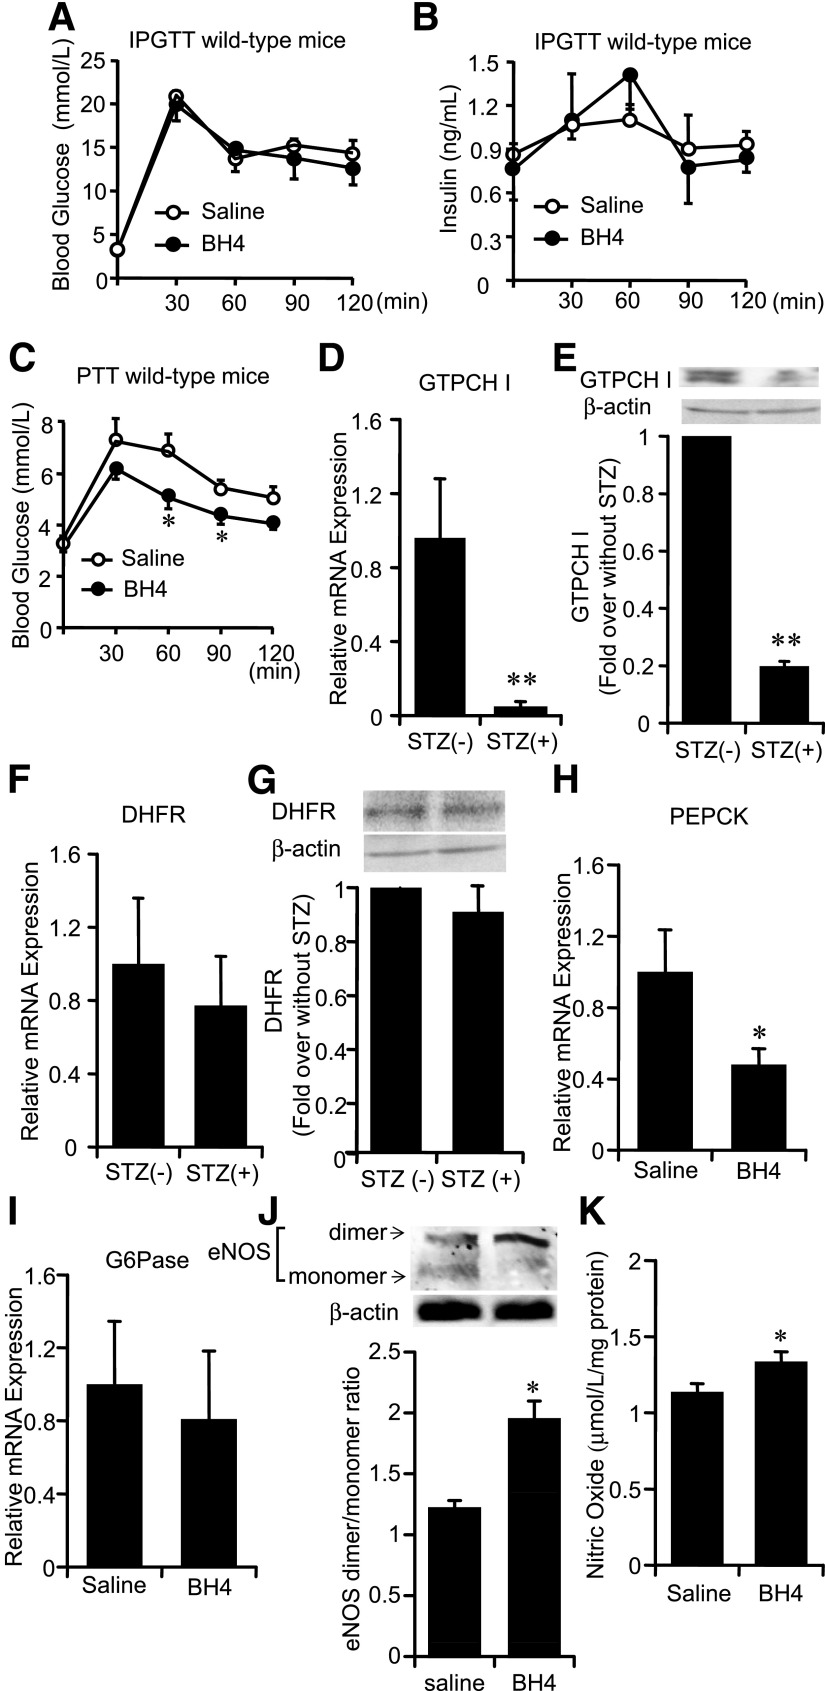
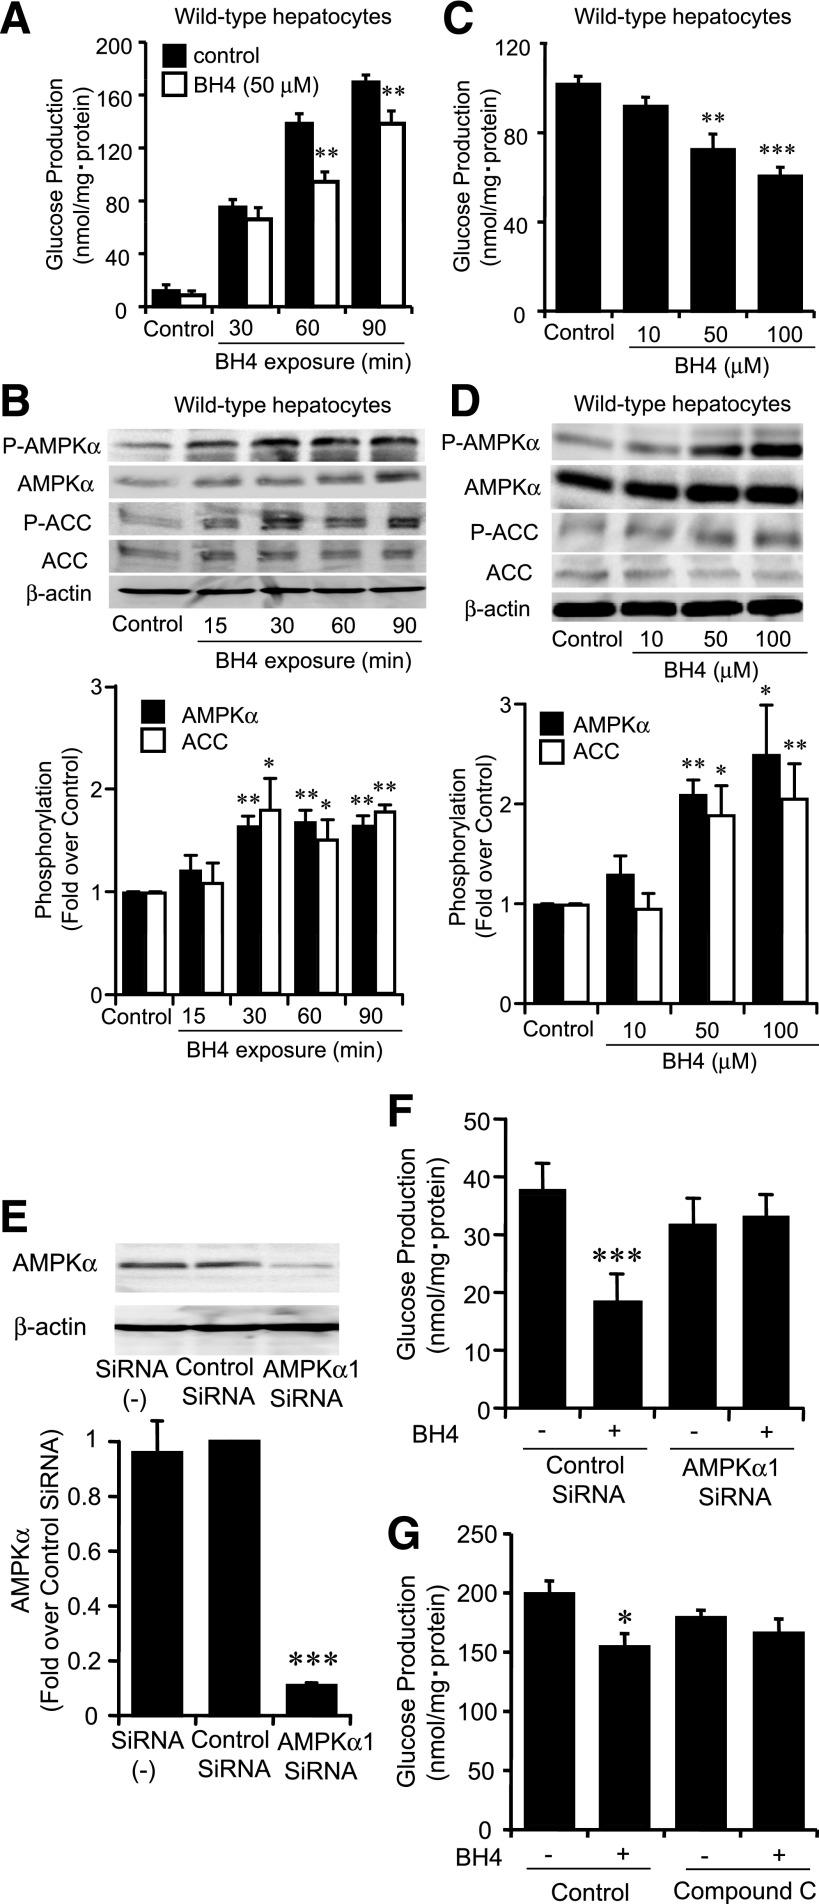
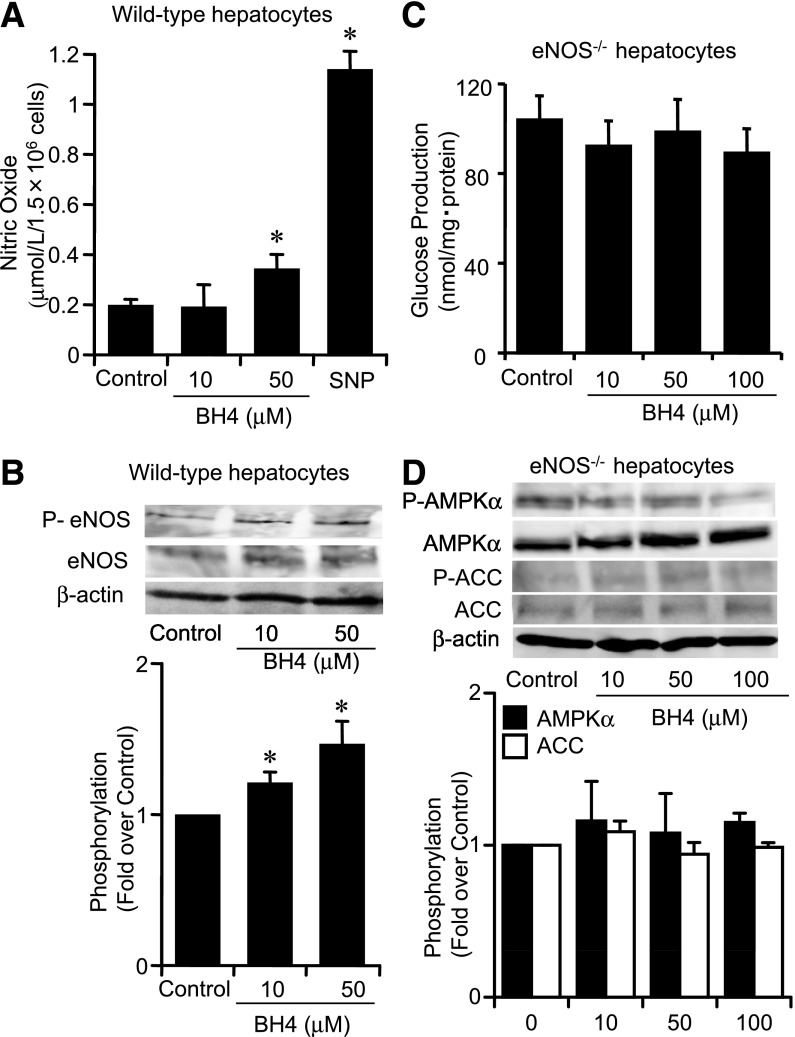
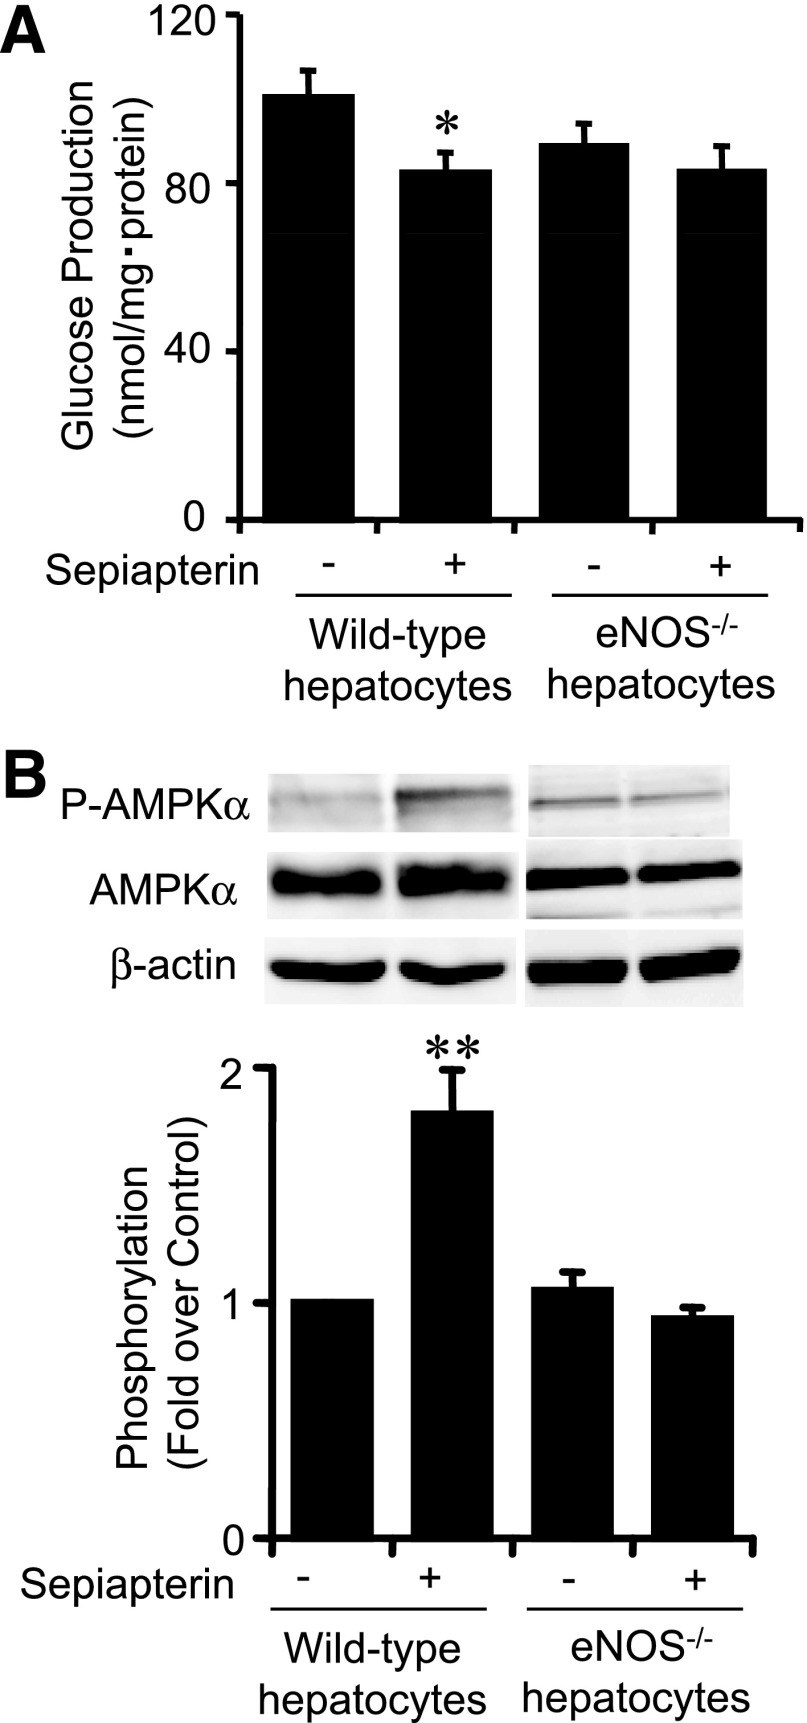
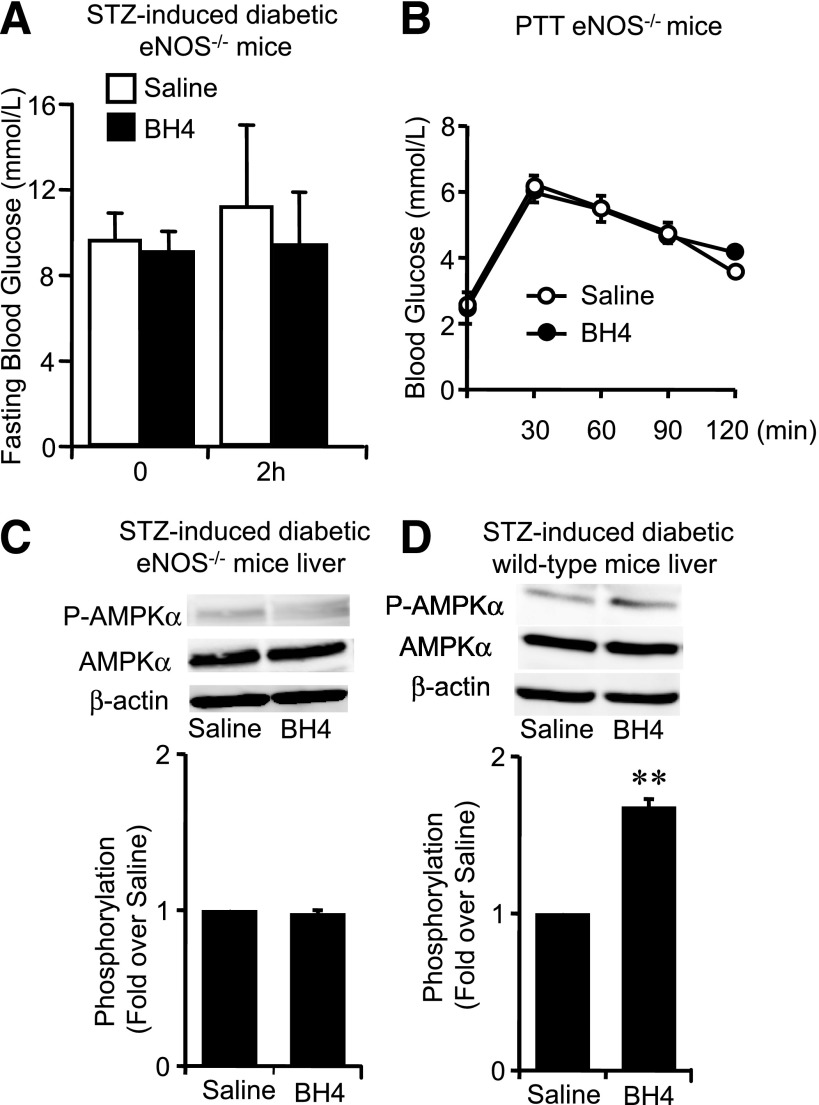
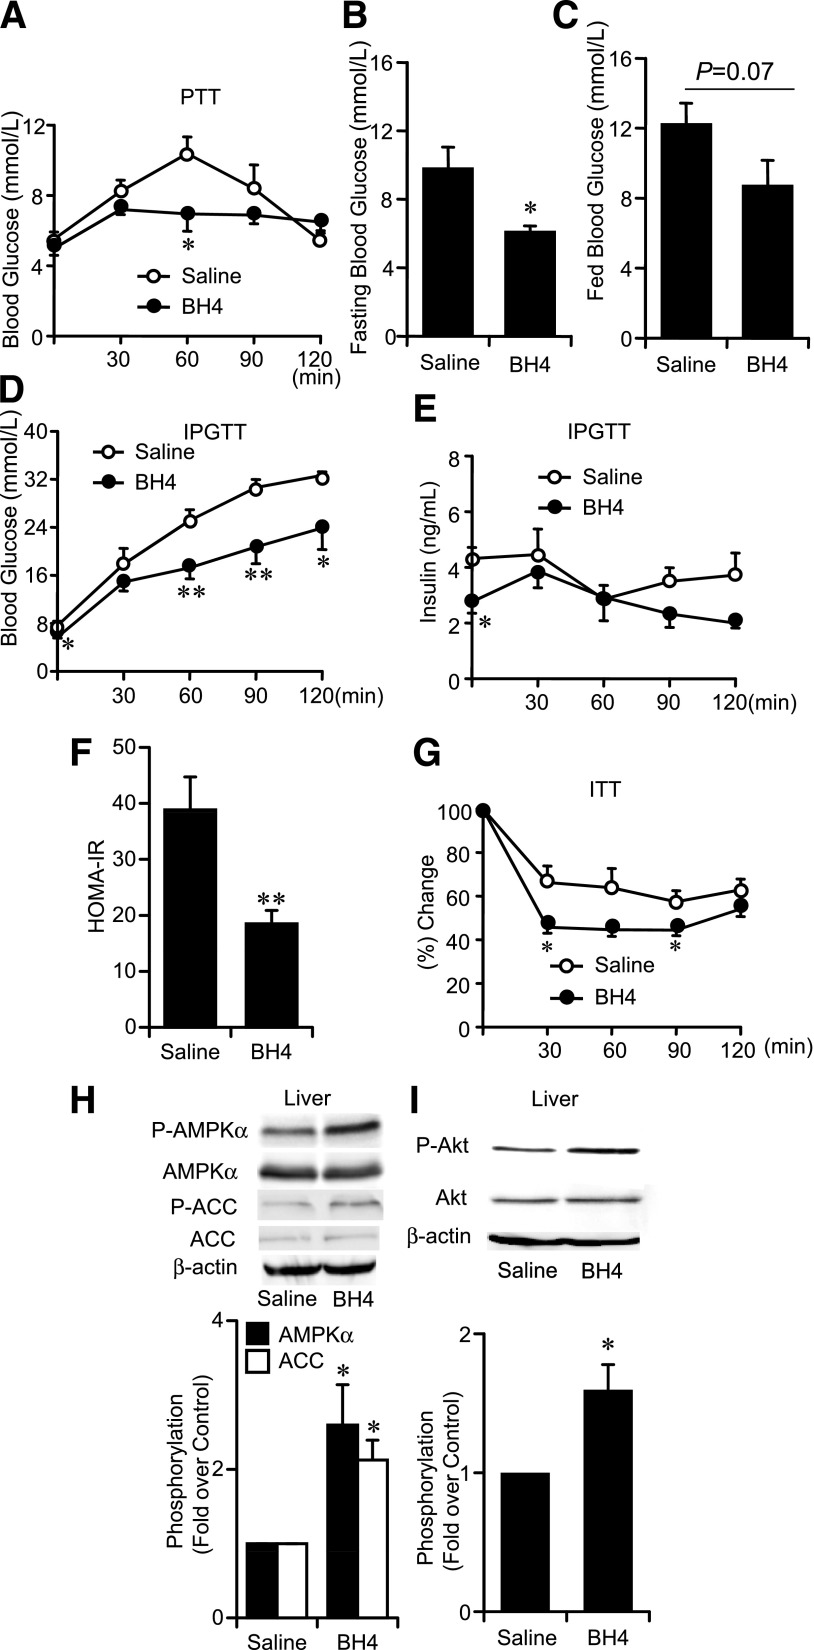
Endothelial nitric oxide synthase (eNOS) dysfunction induces insulin resistance and glucose intolerance. Tetrahydrobiopterin (BH4) is an essential cofactor of eNOS that regulates eNOS activity. In the diabetic state, BH4 is oxidized to 7,8-dihydrobiopterin, which leads to eNOS dysfunction owing to eNOS uncoupling. The current study investigates the effects of BH4 on glucose metabolism and insulin sensitivity in diabetic mice. Single administration of BH4 lowered fasting blood glucose levels in wild-type mice with streptozotocin (STZ)-induced diabetes and alleviated eNOS dysfunction by increasing eNOS dimerization in the liver of these mice. Liver has a critical role in glucose-lowering effects of BH4 through suppression of hepatic gluconeogenesis. BH4 activated AMP kinase (AMPK), and the suppressing effect of BH4 on gluconeogenesis was AMPK-dependent. In addition, the glucose-lowering effect and activation of AMPK by BH4 did not appear in mice with STZ-induced diabetes lacking eNOS. Consecutive administration of BH4 in ob/ob mice ameliorated glucose intolerance and insulin resistance. Taken together, BH4 suppresses hepatic gluconeogenesis in an eNOS-dependent manner, and BH4 has a glucose-lowering effect as well as an insulin-sensitizing effect in diabetic mice. BH4 has potential in the treatment of type 2 diabetes.


Figures

FIG. 1.
FIG. 1.
Biopterin dynamics and effects of BH4 on blood glucose levels in diabetic mice. AD: BH2 levels and BH4-to-BH2 ratio of liver, blood, kidney, and spleen. Values are means ± SE. n = 7. *P < 0.05, **P < 0.01, ***P < 0.001 vs. without STZ. E and F: Fed blood glucose levels were not changed 2 h after injection of BH4 (20 mg/kg i.p.) to STZ diabetic wild-type mice; fasting blood glucose levels were significantly decreased. Values are means ± SE. n = 8. *P < 0.05 vs. the value of preinjection of saline with BH4 intraperitoneally; paired t test. No significant difference of fed and fasting blood glucose levels 2 h after intraperitoneal injection of saline to mice with STZ-induced diabetes.
FIG. 2.
FIG. 2.
Role of liver tissue in glucose-lowering effects of BH4. A and B: IPGTT to wild-type mice. Blood glucose levels and plasma insulin levels after administration of glucose (2 g/kg i.p.) with or without BH4 (20 mg/kg). Values are means ± SE (n = 6). C: PTT to wild-type mice. Elevation of blood glucose levels after intraperitoneal administration of pyruvate with BH4 (20 mg/kg) to wild-type mice was suppressed compared with those without BH4. Values are means ± SE (n = 6). *P < 0.05 vs. saline. D: In mice with STZ-induced diabetes, mRNA levels of GTPCH I expression were significantly decreased compared with those in nondiabetic wild-type mice liver. Values are means ± SE (n = 5). **P < 0.01 vs. nondiabetic wild-type mice liver. E: In wild-type mice with STZ-induced diabetes, protein expression levels of GTPCH I were significantly decreased compared with those in nondiabetic wild-type mice liver. Values are means ± SE (n = 5). **P < 0.01 vs. nondiabetic wild-type mice liver. F: No significant difference of mRNA expression levels of DHFR in liver was detected between nondiabetic mice and mice with STZ-induced diabetes. Values are means ± SE (n = 10). G: No significant difference of protein expression levels of DHFR in liver was detected between nondiabetic mice and mice with STZ-induced diabetes. Values are means ± SE (n = 5). H and I: In liver tissues of wild-type mice with STZ-induced diabetes treated with BH4, mRNA levels of PEPCK were significantly decreased compared with those treated without BH4. The mRNA levels of G6Pase were not changed. Values are means ± SE (n = 6), *P < 0.05 vs. saline. J: Liver tissues of eNOS dimer and monomer expression 2 h after intraperitoneal injection of saline with or without BH4 (20 mg/kg) to wild-type mice with STZ-induced diabetes. Densitometric analysis of the ratio of eNOS dimer to monomer. Values are means ± SE (n = 5). *P < 0.05 vs. saline. K: In liver tissues of wild-type mice with STZ-induced diabetes treated with BH4, NO content was significantly increased compared with those treated without BH4. Values are means ± SE (n = 5). *P < 0.05 vs. saline.
FIG. 3.
FIG. 3.
BH4 suppressed gluconeogenesis and increased AMPKα phosphorylation in hepatocytes isolated from wild-type mice. A: Time course of gluconeogenesis with exposure to BH4. Suppressing effect on gluconeogenesis by 50 μmol/L BH4 compared with control was detected after 60 min in hepatocytes isolated from wild-type mice. Values are means ± SE (n = 6). **P < 0.01 vs. control. B: Time course of phosphorylation of AMPKα and ACC upon exposure to BH4 (50 μmol/L). Both AMPKα and ACC phosphorylation were stimulated after 30 min exposure to BH4 in hepatocytes isolated from wild-type mice. Data are expressed as fold stimulation over control. Values are means ± SE (n = 3). *P < 0.05, **P < 0.01 vs. control. C: Suppressing effect on gluconeogenesis after 1 h exposure of BH4 was detected ranging over 50 μmol/L in hepatocytes isolated from wild-type mice. Values are means ± SE (n = 6). **P < 0.01, ***P < 0.001 vs. control. D: Effect of BH4 on phosphorylation of AMPK and ACC. After 30 min exposure to BH4, both AMPKα and ACC phosphorylation were increased by BH4 dose dependently ranging over 50 μmol/L in hepatocytes isolated from wild-type mice. Data are expressed as fold stimulation over control. Values are means ± SE (n = 3). *P < 0.05, **P < 0.01 vs. control. E: With transfection with AMPKα1 siRNA, protein expression of AMPKα was decreased compared with that of transfection with control siRNA. Values are means ± SE (n = 3). ***P < 0.001 vs. control siRNA. F: Transfected with AMPKα1 siRNA, suppressing effect of BH4 (50 μmol/L) on hepatic glucose production was inhibited. Values are means ± SE (n = 6). ***P < 0.001 vs. values transfected with control siRNA without BH4. G: Compound C (20 μmol/L), an AMPK inhibitor, abolished the suppressing effect of BH4 (50 μmol/L) on gluconeogenesis. Values are means ± SE (n = 6). *P < 0.05 vs. values without BH4 and without compound C.
FIG. 4.
FIG. 4.
Lack of the effect of BH4 on suppression of gluconeogenesis in eNOS−/− mouse hepatocytes. A: BH4 (50 μmol/L) significantly increased NO production in hepatocytes from wild-type mice. SNP (20 μmol/L) was used as positive control. Values are means ± SE (n = 5). *P < 0.05 vs. control. B: BH4 (ranging from 10 to 50 μmol/L) increased eNOS phosphorylation at Ser1177 in hepatocytes from wild-type mice. Values are means ± SE (n = 5). *P < 0.05 vs. control. C: BH4 (ranging from 10 to 100 μmol/L) did not suppress gluconeogenesis after 1 h exposure in hepatocytes from eNOS−/− mice. Values are means ± SE (n = 6). D: After 30 min exposure to BH4 ranging from 10 to 100 μmol/L, AMPKα and ACC phosphorylation were not increased by BH4 in hepatocytes from eNOS−/− mice. Data are expressed as fold stimulation over control. Values are means ± SE (n = 3).
FIG. 5.
FIG. 5.
Effect of sepiapterin, a BH4 precursor, on gluconeogenesis and AMPK activation. A: After 1 h exposure, sepiapterin (50 μmol/L) significantly suppressed gluconeogenesis in hepatocytes isolated from wild-type mice. This effect was not observed in hepatocytes isolated from eNOS−/− mice. Values are means ± SE (n = 6). *P < 0.05 vs. control. B: After 30 min exposure to sepiapterin (50 μmol/L), AMPKα phosphorylation was increased in hepatocytes isolated from wild-type mice. AMPKα phosphorylation was not increased by sepiapterin in hepatocytes isolated from eNOS−/− mice. Data are expressed as fold stimulation over control. Values are means ± SE (n = 3). **P < 0.01 vs. control.
FIG. 6.
FIG. 6.
Effects of BH4 in eNOS−/− mice with STZ-induced diabetes. A: No significant difference of fasting blood glucose levels 2 h after intraperitoneal injection of saline with or without BH4 (20 mg/kg) to eNOS−/− mice with STZ-induced diabetes. Values are means ± SE (n = 7). B: PTT to eNOS−/− mice. No effects of BH4 (20 mg/kg) on suppressing hepatic gluconeogenesis were detected in PTT in eNOS−/− mice. Values are means ± SE (n = 6). C: AMPKα phosphorylation in liver of eNOS−/− mice with STZ-induced diabetes was not changed by BH4 administration. Data are expressed as fold stimulation over saline. Values are means ± SE (n = 3). D: AMPKα phosphorylation in liver of wild-type mice with STZ-induced diabetes was significantly increased by BH4 (20 mg/kg) administration. Data are expressed as fold stimulation over saline. Values are means ± SE (n = 3). **P < 0.01 vs. saline.
FIG. 7.
FIG. 7.
Effects of BH4 in ob/ob mice. A: PTT to ob/ob mice with or without single administration of BH4 (20 mg/kg). Values are means ± SE (n = 6). *P < 0.05 vs. the value of saline. B: Fasting blood glucose levels of ob/ob mice treated with BH4 (20 mg/kg/day) for 10 days were significantly decreased compared with those treated without BH4. Values are means ± SE (n = 6). *P < 0.05 vs. the value of saline. C: Fed blood glucose levels in ob/ob mice treated with or without BH4 for 10 days. P = 0.07 vs. the value of saline. Values are means ± SE (n = 6). D and E: IPGTT to ob/ob mice. Blood glucose levels and plasma insulin levels after administration of glucose (1 g/kg i.p.) with or without BH4 for 10 days. Values are means ± SE (n = 6). *P < 0.05, **P < 0.01 vs. without BH4. F: HOMA-IR calculated from fasting blood glucose and insulin levels from IPGTT data in ob/ob mice treated with or without BH4 for 10 days. Values are means ± SE (n = 6). **P < 0.01 vs. the value of saline. G: Insulin tolerance test (ITT) to ob/ob mice treated with or without BH4 for 10 days. Values are means ± SE (n = 6). *P < 0.05 vs. the value of saline. H and I: AMPKα, ACC, and Akt phosphorylation in liver tissues of ob/ob mice was increased by 10 days’ administration of BH4. Data are expressed as fold stimulation over saline. Values are means ± SE (n = 3). *P < 0.05 vs. saline.

Similar articles

Cited by

References

    1. Triggle CR, Ding H. A review of endothelial dysfunction in diabetes: a focus on the contribution of a dysfunctional eNOS. J Am Soc Hypertens 2010;4:102–115 - PubMed
    1. Huang PL. eNOS, metabolic syndrome and cardiovascular disease. Trends Endocrinol Metab 2009;20:295–302 - PMC - PubMed
    1. Kim JA, Montagnani M, Koh KK, Quon MJ. Reciprocal relationships between insulin resistance and endothelial dysfunction: molecular and pathophysiological mechanisms. Circulation 2006;113:1888–1904 - PubMed
    1. Duplain H, Burcelin R, Sartori C, et al. . Insulin resistance, hyperlipidemia, and hypertension in mice lacking endothelial nitric oxide synthase. Circulation 2001;104:342–345 - PubMed
    1. Shankar RR, Wu Y, Shen HQ, et al. . Mice with gene disruption of both endothelial and neuronal nitric oxide synthase exhibit insulin resistance. Diabetes 2000;49:684–687 - PubMed

Publication types

MeSH terms