. 2013 Jun 14;288(24):17261-71.
doi: 10.1074/jbc.M112.438515. Epub 2013 May 6.

Interferon-inducible transmembrane protein 3 (IFITM3) restricts reovirus cell entry

Affiliations

Interferon-inducible transmembrane protein 3 (IFITM3) restricts reovirus cell entry

Amanda A Anafu et al. J Biol Chem. .

Abstract

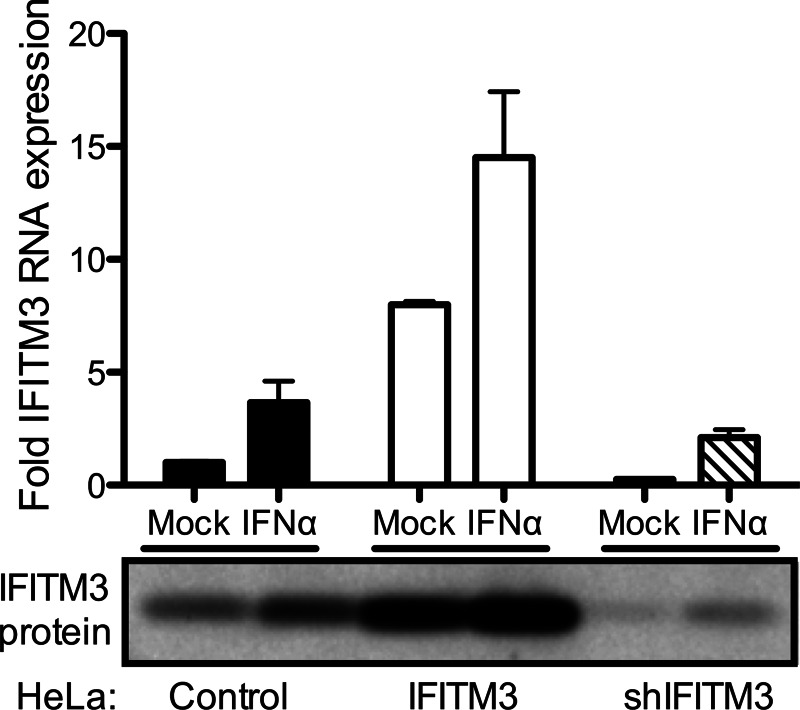
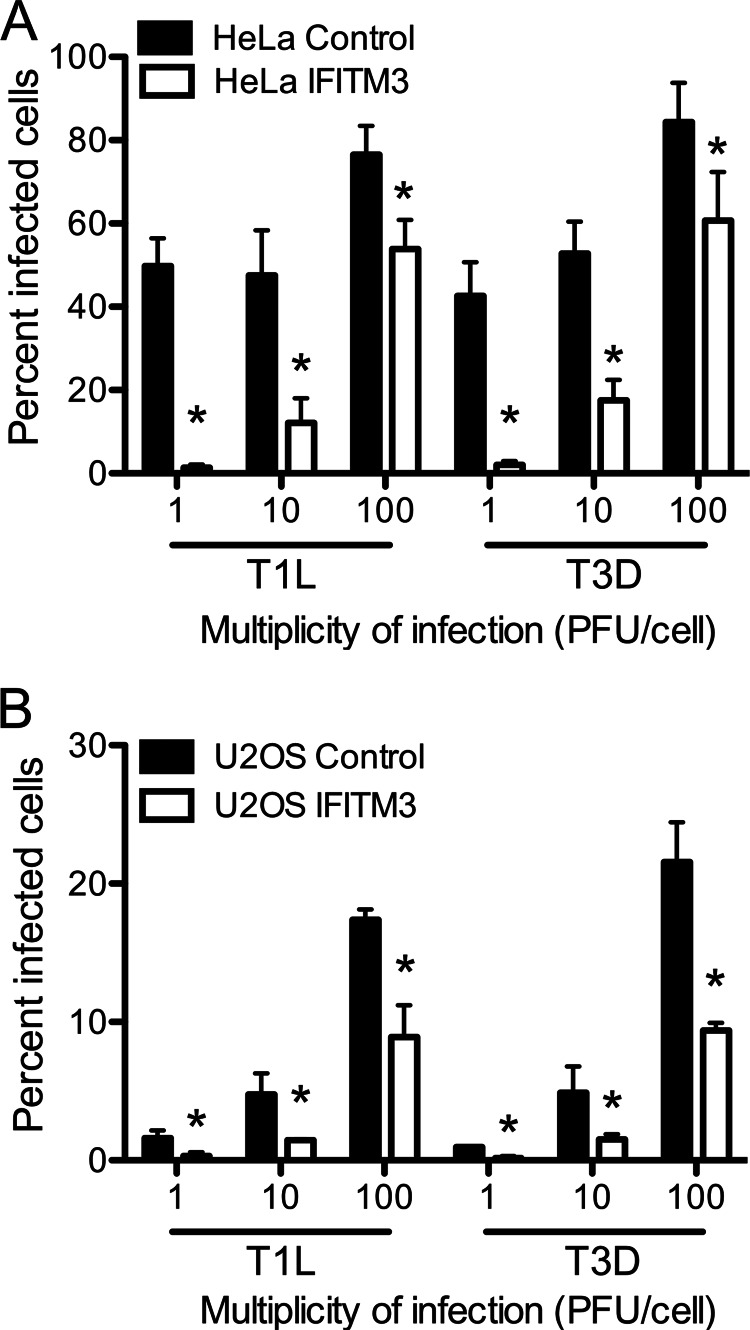
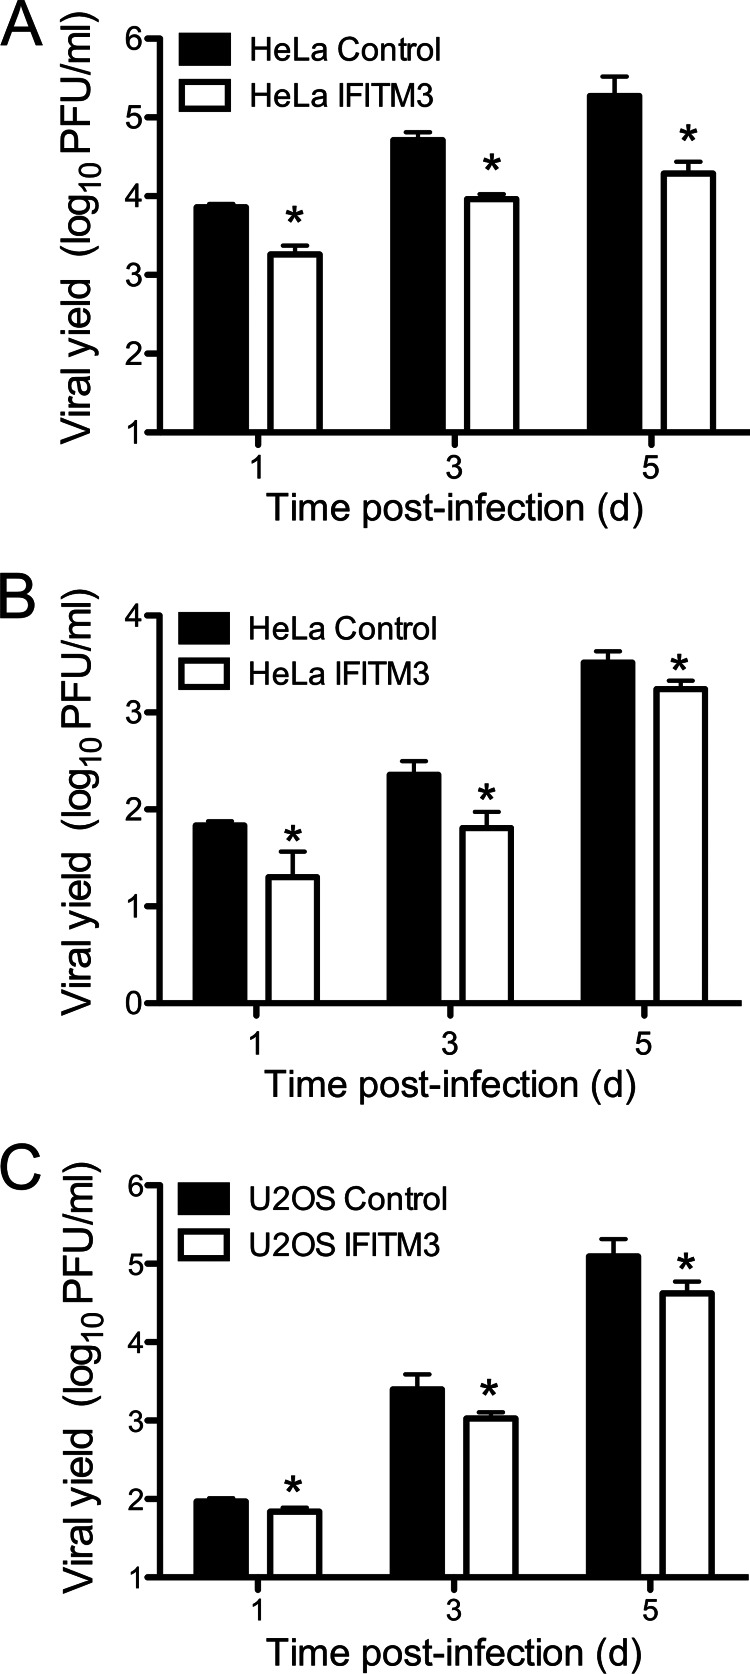
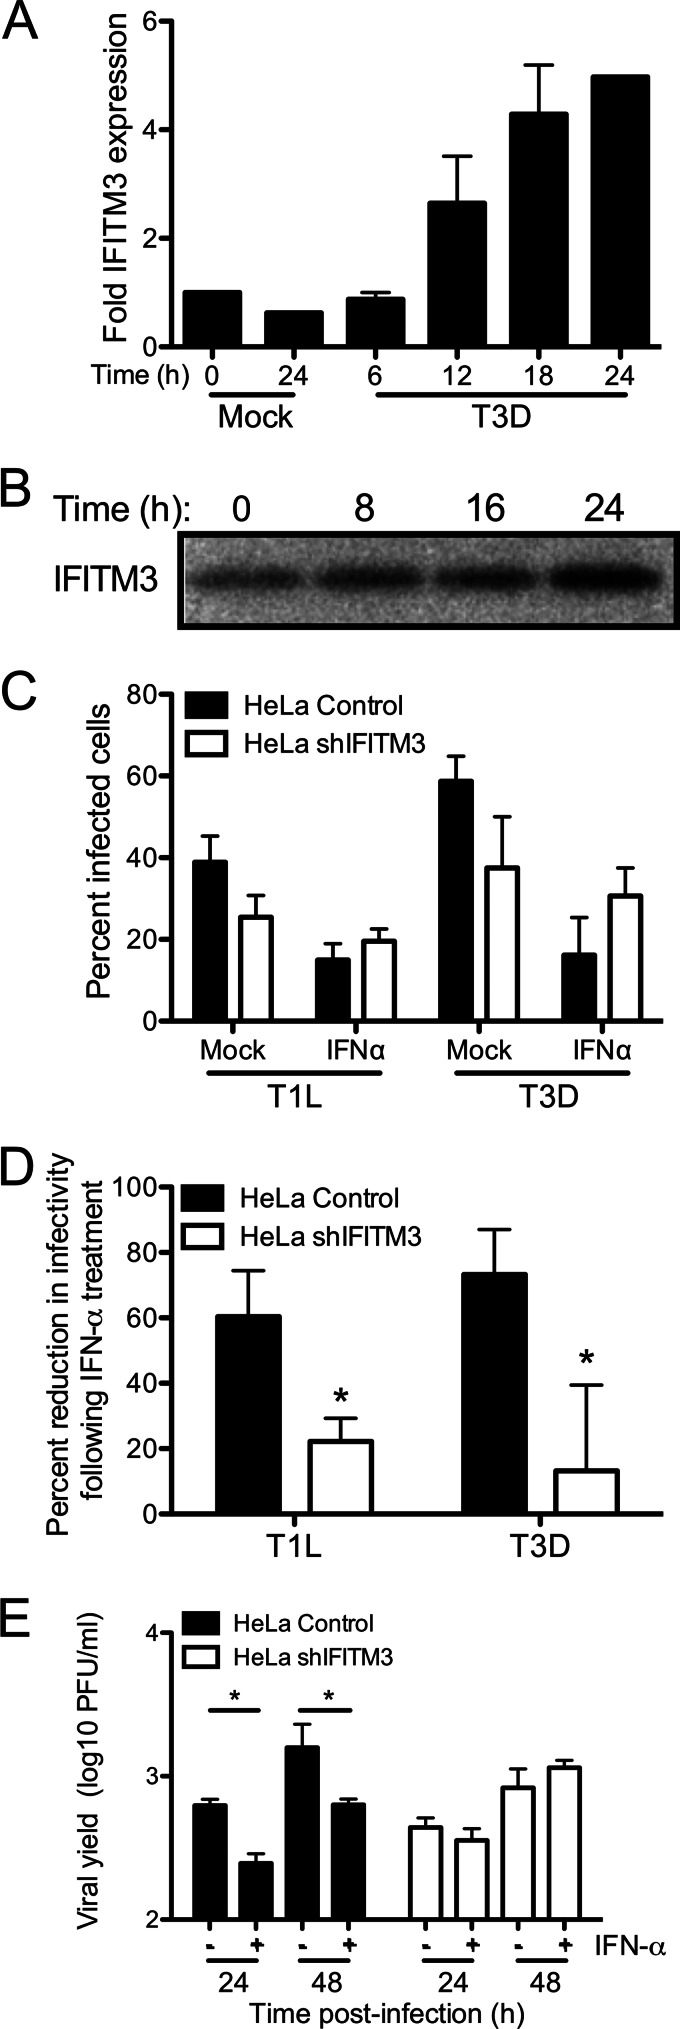
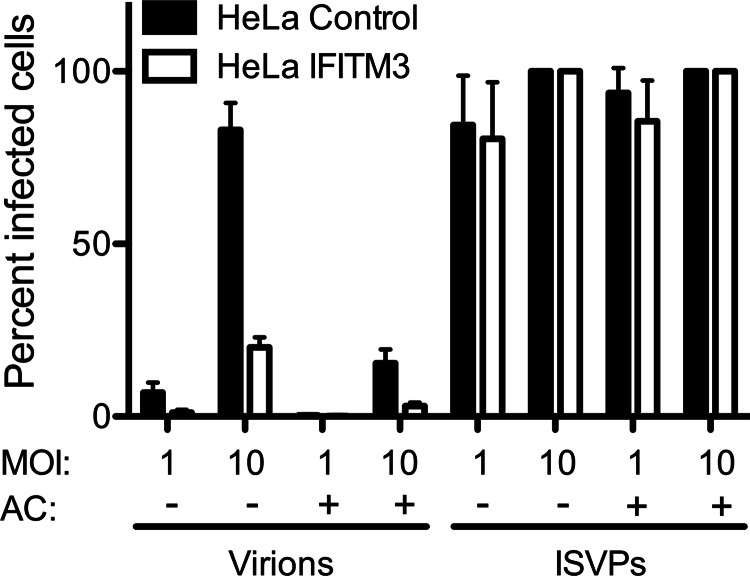
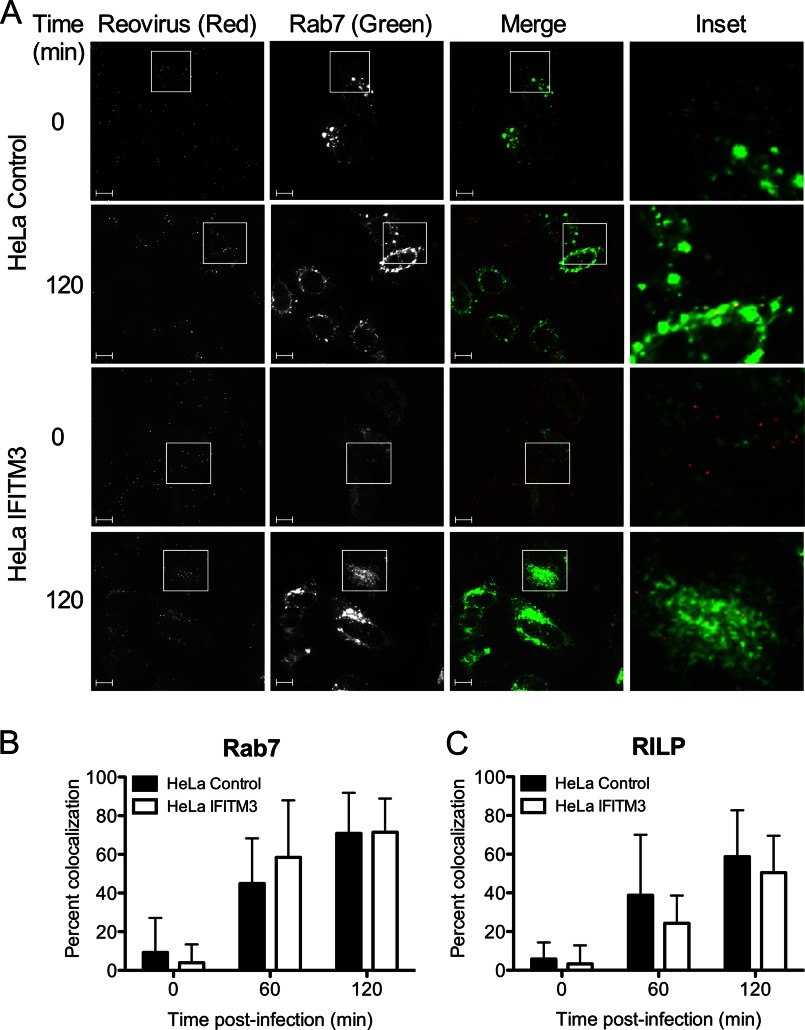
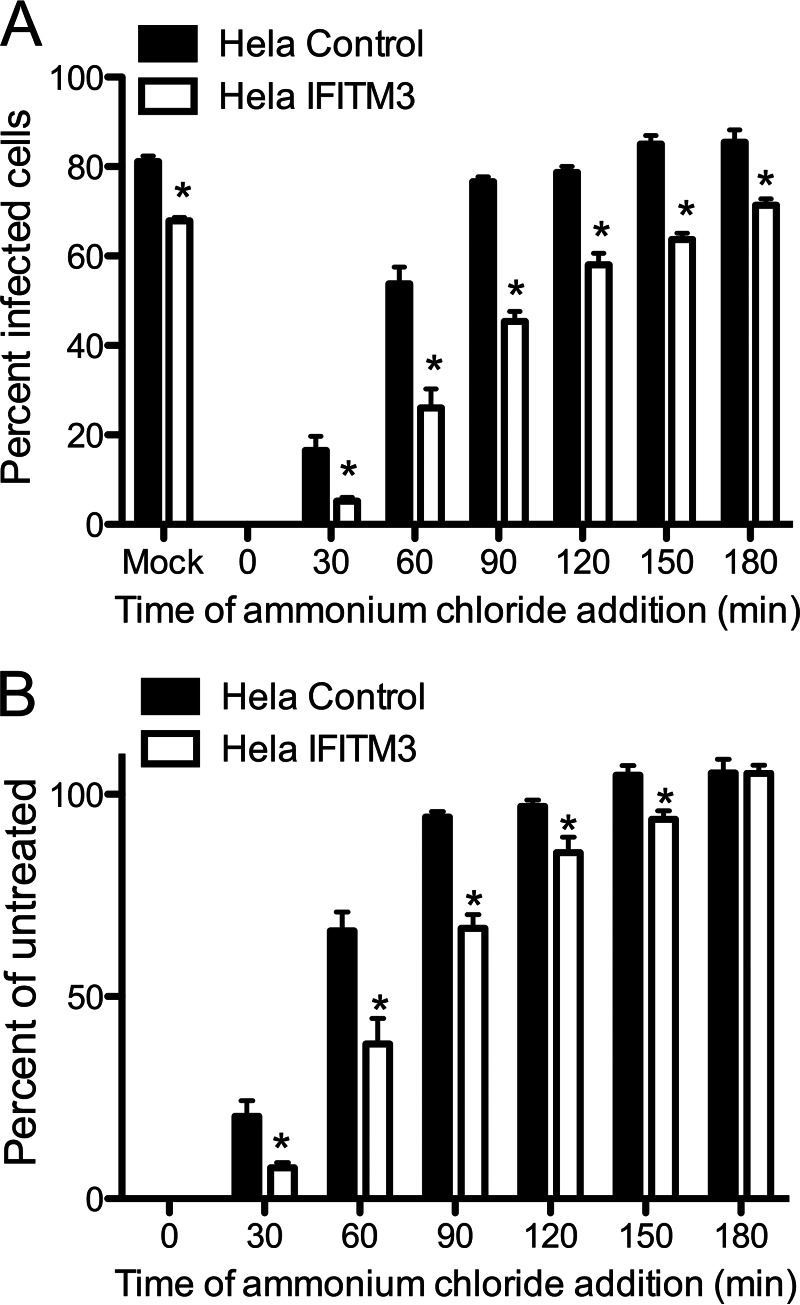
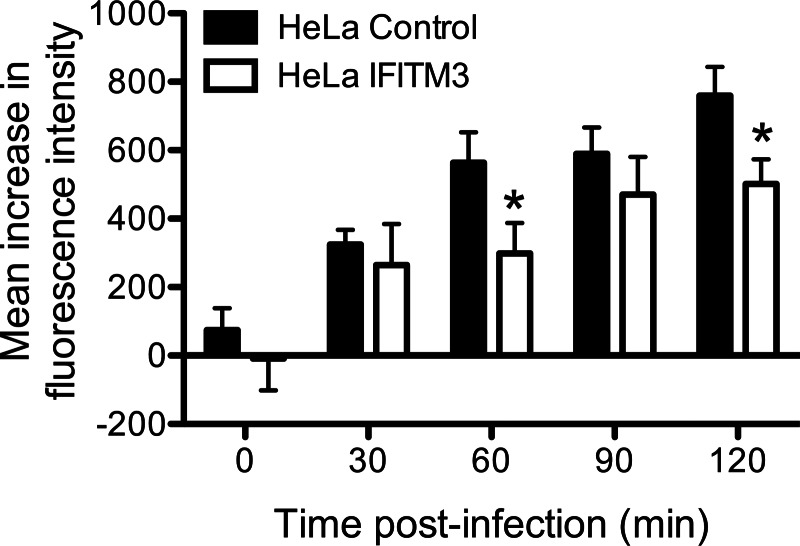
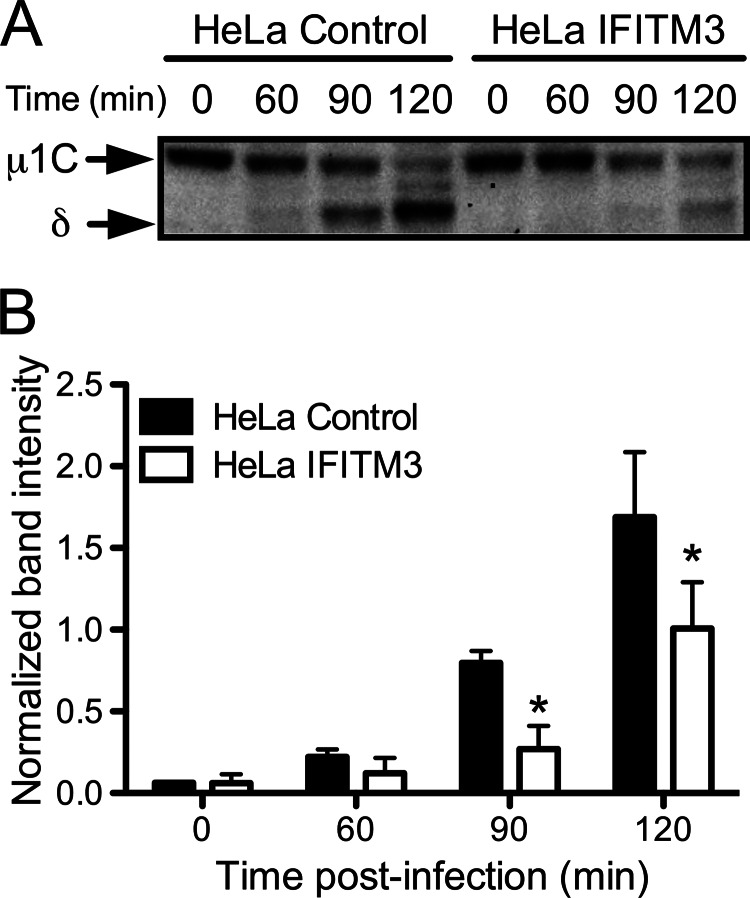
Reoviruses are double-stranded RNA viruses that infect the mammalian respiratory and gastrointestinal tract. Reovirus infection elicits production of type I interferons (IFNs), which trigger antiviral pathways through the induction of interferon-stimulated genes (ISGs). Although hundreds of ISGs have been identified, the functions of many of these genes are unknown. The interferon-inducible transmembrane (IFITM) proteins are one class of ISGs that restrict the cell entry of some enveloped viruses, including influenza A virus. One family member, IFITM3, localizes to late endosomes, where reoviruses undergo proteolytic disassembly; therefore, we sought to determine whether IFITM3 also restricts reovirus entry. IFITM3-expressing cell lines were less susceptible to infection by reovirus, as they exhibited significantly lower percentages of infected cells in comparison to control cells. Reovirus replication was also significantly reduced in IFITM3-expressing cells. Additionally, cells expressing an shRNA targeting IFITM3 exhibited a smaller decrease in infection after IFN treatment than the control cells, indicating that endogenous IFITM3 restricts reovirus infection. However, IFITM3 did not restrict entry of reovirus infectious subvirion particles (ISVPs), which do not require endosomal proteolysis, indicating that restriction occurs in the endocytic pathway. Proteolysis of outer capsid protein μ1 was delayed in IFITM3-expressing cells in comparison to control cells, suggesting that IFITM3 modulates the function of late endosomal compartments either by reducing the activity of endosomal proteases or delaying the proteolytic processing of virions. These data provide the first evidence that IFITM3 restricts infection by a nonenveloped virus and suggest that IFITM3 targets an increasing number of viruses through a shared requirement for endosomes during cell entry.

Keywords: Endosomes; Innate Immunity; Interferon; Interferon-stimulated Gene; Reovirus; Virus Entry.


Figures

FIGURE 1.
FIGURE 1.
IFITM3 expression in HeLa cell lines. Vector control, IFITM-3-expressing, and shIFITM3-expressing HeLa cell lines were mock-treated or treated with 100 IU/ml IFN-α for 6 h. Cultures were scraped into PBS and pelleted. RNA was extracted from cultures, converted into cDNA, and used for qPCR analysis using primers specific for IFITM3 (top panel). The level of IFITM3 RNA was normalized to that of GAPDH in each culture. Alternatively, cultures were lysed with radioimmunoprecipitation buffer and subjected to SDS-PAGE electrophoresis followed by immunoblotting using antisera against IFITM3 (bottom panel).
FIGURE 2.
FIGURE 2.
IFITM3 restricts reovirus infection. HeLa (A and B) or U2OS (C) vector control- or IFITM3-expressing cells were infected with reovirus strains T1L and T3D at the indicated m.o.i. (pfu/cell). The percentage of infected cells was determined by fluorescent focus assay 18 h post-infection. The results are presented as the means of triplicate samples. Error bars indicate S.D. *, p < 0.05 by Student's t test in comparison with vector control cells.
FIGURE 3.
FIGURE 3.
IFITM3 restricts reovirus replication. HeLa (A and B) or U2OS (C) vector control- or IFITM3-expressing cells were infected with reovirus strain T3D at an m.o.i. of 1 pfu/cell (A and C) or 100 pfu/cell (B). Viral titers at the indicated times were determined by plaque assay. The results are presented as the mean viral yields, calculated by dividing titer at the indicated time by titer at 0 h for triplicate samples. Error bars indicate S.D. *, p < 0.05 by Student's t test in comparison with vector control cells.
FIGURE 4.
FIGURE 4.
Knockdown of IFITM3 expression decreases reovirus sensitivity to type I interferon. A, HeLa cells were mock-infected or infected with T3D at an m.o.i. of 100 pfu/cell. RNA was isolated from cells at the indicated times post-infection, and IFITM3 expression was quantified by qPCR relative to GAPDH expression. Results represent the means of duplicate cDNA syntheses for two independent experiments. Error bars indicate S.D. B, HeLa cells were infected with T3D at an m.o.i. of 100 pfu/cell. IFITM3 protein levels in cell lysates at the indicated times post-infection were determined by immunoblot using an antibody specific for IFITM3. C, HeLa vector control- or shIFITM3-expressing cells were either mock-treated or treated with IFN-α (100 IU/ml) for 6 h. Cells were then infected with TIL or T3D at an m.o.i. of 10 pfu/cell. The percentage of infected cells was determined by fluorescent focus assay 18 h post-infection. The results are presented as the means of triplicate samples. Error bars indicate S.D. D, values from C were normalized to show a decrease in reovirus infectivity after treatment with IFN-α in HeLa shIFITM3 and vector control cells. E, HeLa vector control- or shIFITM3-expressing cells were either mock-treated or treated with IFN-α (100 IU/ml) for 6 h. Cells were then infected with T3D at an m.o.i. of 1 pfu/cell. Viral titers at the indicated times were determined by plaque assay. The results are presented as the mean viral yields, calculated by dividing titer at the indicated time by titer at 0 h for triplicate samples. Error bars indicate S.D. *, p < 0.05 by Student's t test in comparison with mock treated cells.
FIGURE 5.
FIGURE 5.
IFITM3 does not restrict entry of reovirus ISVPs. HeLa vector control- or IFITM3-expressing cells were infected with either rsT3D-σ1T249I virions or T3D-σ1T249I ISVPs at the indicated m.o.i. After a 45-min adsorption, cells were either mock-treated or treated with 10 mm ammonium chloride (AC) and incubated at 37 °C for 18 h. The percentage of infected cells was determined by fluorescent focus assay. The results are presented as the means of triplicate samples. Error bars indicate S.D.
FIGURE 6.
FIGURE 6.
IFITM3 does not alter reovirus trafficking to late endosomes. A, HeLa vector control or IFITM3-expressing cells were transfected with EGFP-Rab7 (green) 18 h before infection. Cells were chilled at 4 °C for 1 h and then adsorbed with 10,000 particles/cell of reovirus-A546 (red) at 4 °C for 1 h. The inoculum was removed, and cells were washed to remove unbound virus and then either fixed with 2% paraformaldehyde or supplemented with complete medium and incubated at 37 °C for the times shown before fixing. Cells were imaged by confocal microscopy. Insets depict enlarged areas of boxed regions. Scale bars, 10 μm. B and C, shown is quantification of colocalization of reovirus-A546 particles with EGFP-tagged versions of Rab7 (B) and RILP (C) after adsorption of reovirus for the times shown. Data are presented as the percent of virus particles exhibiting spectral overlap with EGFP expression (n = 12–18 cells per time point, average of 322 particles per time point). Error bars indicate S.D.
FIGURE 7.
FIGURE 7.
IFITM3 expression delays the kinetics of reovirus escape from ammonium chloride treatment. A, HeLa vector control- or IFITM3-expressing cells were adsorbed with rsT3D at an m.o.i. of 25 pfu/cell for 1 h at 4 °C. Cells were washed 3 times with PBS and incubated with prewarmed media at 37 °C. At the times shown after adsorption, ammonium chloride was added to a final concentration of 25 mm. The percentage of infected cells was determined by fluorescent focus assay 18 h post-infection. The results are presented as the percentage of cells infected for triplicate samples. B, the data shown in panel A were normalized to the percentage of infected cells in untreated wells. Error bars indicate S.D. *, p < 0.05 by Student's t test versus vector control cells.
FIGURE 8.
FIGURE 8.
IFITM3 delays the kinetics of reovirus particle entry into acidified endosomal compartments. HeLa vector control- or IFITM3-expressing cells were chilled at 4 °C for 1 h and adsorbed with 10,000 particles/cell of reovirus-pHrodo at 4 °C for 1 h. The inoculum was removed, the unbound virus was washed away, and the cells were supplemented with prewarmed complete medium and incubated at 37 °C for the times shown. The cells were analyzed by flow cytometry. The data are shown as the mean fluorescence intensity from triplicate samples. Error bars indicate S.D. *, p < 0.05 by Student's t test in comparison with vector control cells.
FIGURE 9.
FIGURE 9.
IFITM3 expression delays reovirus outer capsid cleavage. A, HeLa vector control- or IFITM3-expressing cells were adsorbed with T3D at an m.o.i. of 100 pfu/cell for 1 h at 4 °C. Cells were washed 2 times with PBS and incubated with prewarmed media at 37 °C. At the times shown after adsorption, cells were scraped into PBS, pelleted at 3000 × g, and resuspended in radioimmunoprecipitation buffer. Lysates were clarified by centrifugation at 13,000 × g, resolved in 4–12% polyacrylamide gels, and transferred to PVDF membranes. The membranes were probed with a rabbit polyclonal anti-T3D antiserum and an anti-rabbit AP-conjugated secondary antibody and visualized using chemiluminescence. B, bands corresponding to μ1C and δ from three individual experiments were quantified using ImageJ software and normalized using nonspecific background bands. *, p < 0.05 by Student's t test in comparison with vector control cells.

Similar articles

Cited by

References

    1. Mogensen T. H. (2009) Pathogen recognition and inflammatory signaling in innate immune defenses. Clin. Micro. Rev. 22, 240–273 - PMC - PubMed
    1. Jensen S., Thomsen A. R. (2012) Sensing of RNA viruses. A review of innate immune receptors involved in recognizing RNA virus invasion. J. Virol. 86, 2900–2910 - PMC - PubMed
    1. Borden E. C., Williams B. R. (2011) Interferon-stimulated genes and their protein products. what and how? J. Interferon Cytokine Res. 31, 1–4 - PubMed
    1. Farrell P. J., Balkow K., Hunt T., Jackson R. J., Trachsel H. (1977) Phosphorylation of initiation factor eIF-2 and the control of reticulocyte protein synthesis. Cell 11, 187–200 - PubMed
    1. Ratner L., Wiegand R. C., Farrell P. J., Sen G. C., Cabrer B., Lengyel P. (1978) Interferon, double-stranded RNA, and RNA degradation. Fractionation of the endonuclease INT system into two macromolecular components. Role of a small molecule in nuclease activation. Biochem. Biophys. Res. Commun. 81, 947–954 - PubMed

Publication types

LinkOut - more resources