

Isolation and characterization of the small subunit of the uptake hydrogenase from the cyanobacterium Nostoc punctiforme
- PMID: 23649626
- PMCID: PMC3689976
- DOI: 10.1074/jbc.M113.468587
Isolation and characterization of the small subunit of the uptake hydrogenase from the cyanobacterium Nostoc punctiforme
Abstract
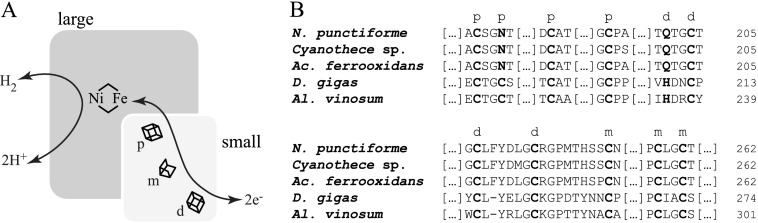
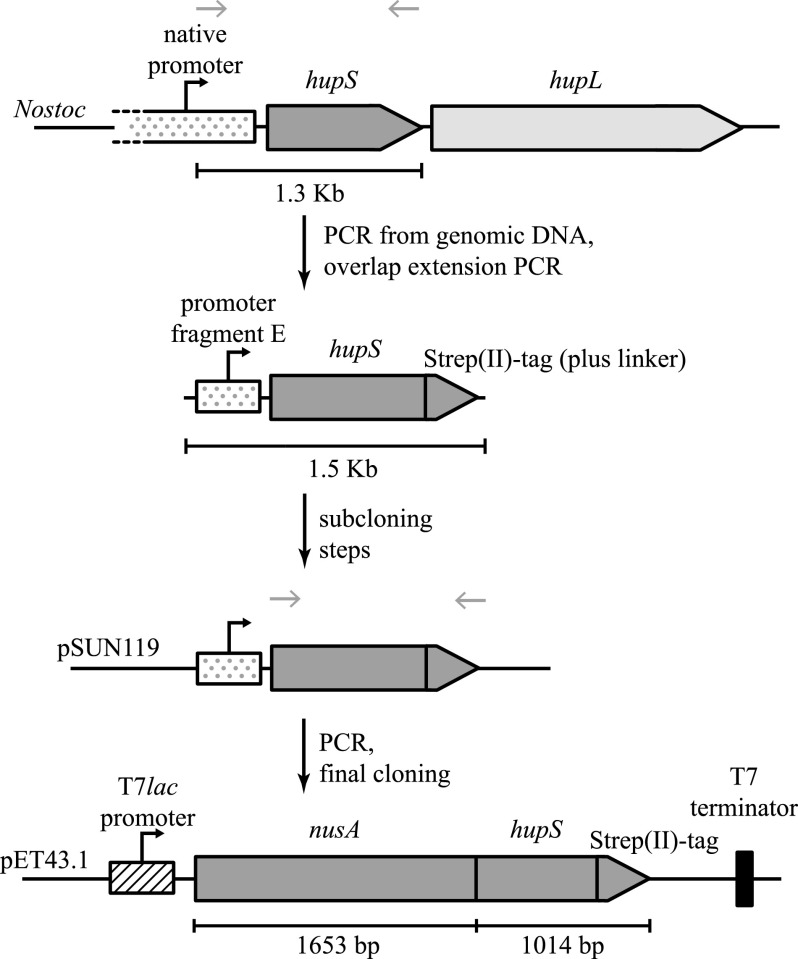
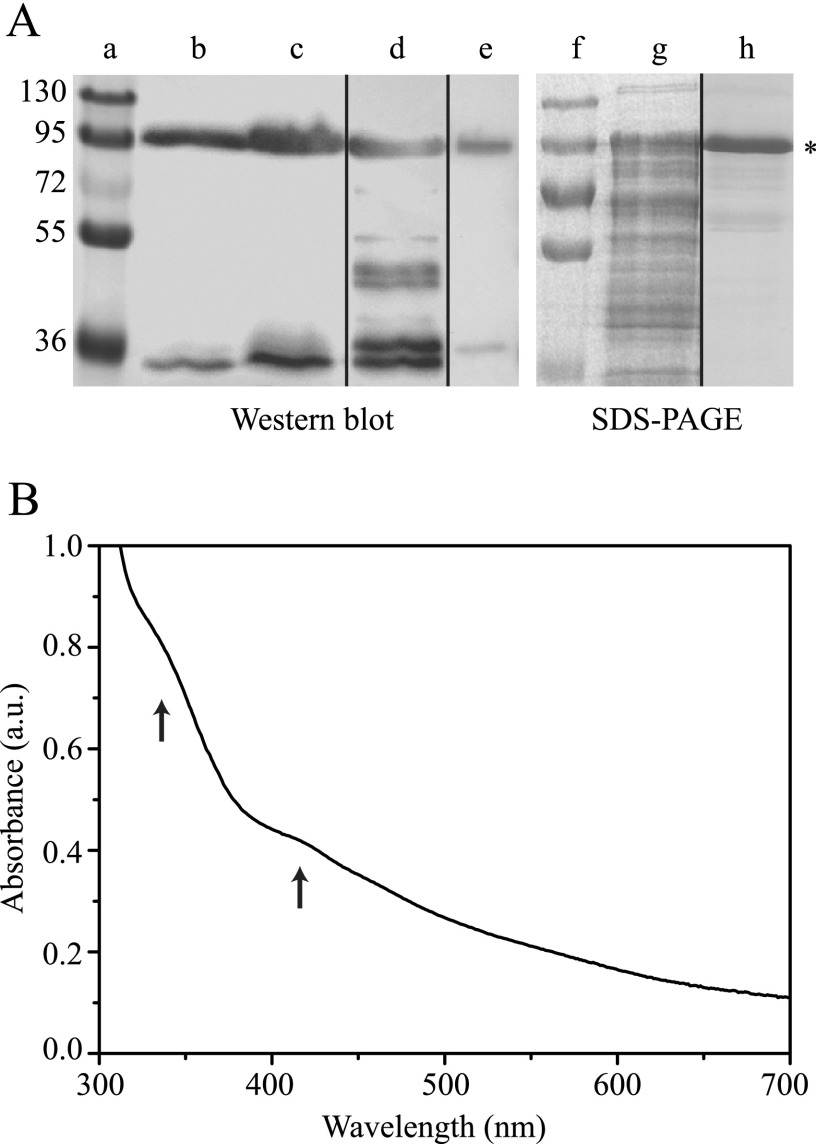
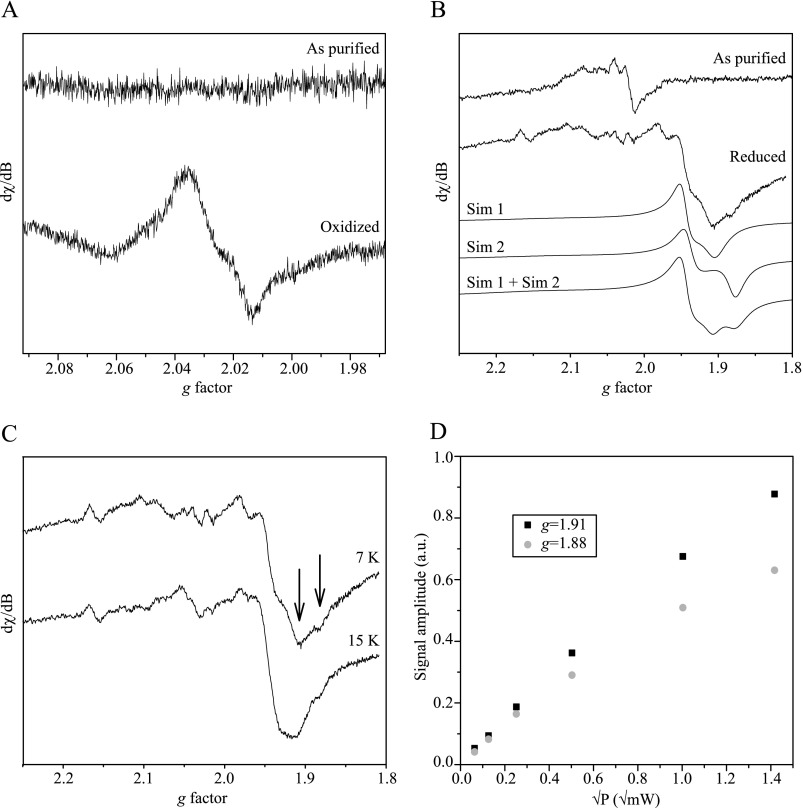
In nitrogen-fixing cyanobacteria, hydrogen evolution is associated with hydrogenases and nitrogenase, making these enzymes interesting targets for genetic engineering aimed at increased hydrogen production. Nostoc punctiforme ATCC 29133 is a filamentous cyanobacterium that expresses the uptake hydrogenase HupSL in heterocysts under nitrogen-fixing conditions. Little is known about the structural and biophysical properties of HupSL. The small subunit, HupS, has been postulated to contain three iron-sulfur clusters, but the details regarding their nature have been unclear due to unusual cluster binding motifs in the amino acid sequence. We now report the cloning and heterologous expression of Nostoc punctiforme HupS as a fusion protein, f-HupS. We have characterized the anaerobically purified protein by UV-visible and EPR spectroscopies. Our results show that f-HupS contains three iron-sulfur clusters. UV-visible absorption of f-HupS has bands ∼340 and 420 nm, typical for iron-sulfur clusters. The EPR spectrum of the oxidized f-HupS shows a narrow g = 2.023 resonance, characteristic of a low-spin (S = ½) [3Fe-4S] cluster. The reduced f-HupS presents complex EPR spectra with overlapping resonances centered on g = 1.94, g = 1.91, and g = 1.88, typical of low-spin (S = ½) [4Fe-4S] clusters. Analysis of the spectroscopic data allowed us to distinguish between two species attributable to two distinct [4Fe-4S] clusters, in addition to the [3Fe-4S] cluster. This indicates that f-HupS binds [4Fe-4S] clusters despite the presence of unusual coordinating amino acids. Furthermore, our expression and purification of what seems to be an intact HupS protein allows future studies on the significance of ligand nature on redox properties of the iron-sulfur clusters of HupS.
Keywords: Cyanobacteria; Electron Paramagnetic Resonance (EPR); Hydrogenase; Iron-Sulfur Protein; Redox.
Figures
Similar articles
-
Photoinduced reduction of the medial FeS center in the hydrogenase small subunit HupS from Nostoc punctiforme.J Inorg Biochem. 2015 Jul;148:57-61. doi: 10.1016/j.jinorgbio.2015.03.018. Epub 2015 Apr 14. J Inorg Biochem. 2015. PMID: 25912316
-
A HupS-GFP fusion protein demonstrates a heterocyst-specific localization of the uptake hydrogenase in Nostoc punctiforme.FEMS Microbiol Lett. 2011 Mar;316(2):152-9. doi: 10.1111/j.1574-6968.2010.02206.x. Epub 2011 Jan 24. FEMS Microbiol Lett. 2011. PMID: 21204939
-
Activation of HydA(DeltaEFG) requires a preformed [4Fe-4S] cluster.Biochemistry. 2009 Jul 7;48(26):6240-8. doi: 10.1021/bi9000563. Biochemistry. 2009. PMID: 19435321
-
The structure and mechanism of iron-hydrogenases.Biochim Biophys Acta. 1990 Nov 5;1020(2):115-45. doi: 10.1016/0005-2728(90)90044-5. Biochim Biophys Acta. 1990. PMID: 2173950 Review.
-
The three classes of hydrogenases from sulfate-reducing bacteria of the genus Desulfovibrio.FEMS Microbiol Rev. 1988 Dec;4(4):299-344. doi: 10.1111/j.1574-6968.1988.tb02748.x. FEMS Microbiol Rev. 1988. PMID: 3078655 Review.
Cited by
-
Metalloproteins in the Biology of Heterocysts.Life (Basel). 2019 Apr 3;9(2):32. doi: 10.3390/life9020032. Life (Basel). 2019. PMID: 30987221 Free PMC article. Review.
-
A broad survey reveals substitution tolerance of residues ligating FeS clusters in [NiFe] hydrogenase.BMC Biochem. 2014 Jun 17;15:10. doi: 10.1186/1471-2091-15-10. BMC Biochem. 2014. PMID: 24934472 Free PMC article.
-
Distal [FeS]-Cluster Coordination in [NiFe]-Hydrogenase Facilitates Intermolecular Electron Transfer.Int J Mol Sci. 2017 Jan 5;18(1):100. doi: 10.3390/ijms18010100. Int J Mol Sci. 2017. PMID: 28067774 Free PMC article.
-
From protein engineering to artificial enzymes - biological and biomimetic approaches towards sustainable hydrogen production.Sustain Energy Fuels. 2018 Apr 1;2(4):724-750. doi: 10.1039/c7se00582b. Epub 2018 Feb 6. Sustain Energy Fuels. 2018. PMID: 31497651 Free PMC article. Review.
-
Cyanobacterial hydrogenases and hydrogen metabolism revisited: recent progress and future prospects.Int J Mol Sci. 2015 May 8;16(5):10537-61. doi: 10.3390/ijms160510537. Int J Mol Sci. 2015. PMID: 26006225 Free PMC article. Review.
References
-
- Styring S. (2012) Artificial photosynthesis for solar fuels. Faraday Discuss. 155, 357–376 - PubMed
-
- Dasgupta C. N., Jose Gilbert J., Lindblad P., Heidorn T., Borgvang S. A., Skjanes K., Das D. (2010) Recent trends on the development of photobiological processes and photobioreactors for the improvement of hydrogen production. Int. J. Hydrogen Energy 35, 10218–10238
-
- Lee H. S., Vermaas W. F., Rittmann B. E. (2010) Biological hydrogen production: prospects and challenges. Trends Biotechnol. 28, 262–271 - PubMed
-
- Armstrong F. A., Belsey N. A., Cracknell J. A., Goldet G., Parkin A., Reisner E., Vincent K. A., Wait A. F. (2009) Dynamic electrochemical investigations of hydrogen oxidation and production by enzymes and implications for future technology. Chem. Soc. Rev. 38, 36–51 - PubMed
-
- Fritsch J., Scheerer P., Frielingsdorf S., Kroschinsky S., Friedrich B., Lenz O., Spahn C. M. (2011) The crystal structure of an oxygen-tolerant hydrogenase uncovers a novel iron-sulphur centre. Nature 479, 249–252 - PubMed
Publication types
MeSH terms
Substances
LinkOut - more resources
Full Text Sources
Other Literature Sources
Molecular Biology Databases
