

HOX antisense lincRNA HOXA-AS2 is an apoptosis repressor in all trans retinoic acid treated NB4 promyelocytic leukemia cells
- PMID: 23649634
- PMCID: PMC3999165
- DOI: 10.1002/jcb.24586
HOX antisense lincRNA HOXA-AS2 is an apoptosis repressor in all trans retinoic acid treated NB4 promyelocytic leukemia cells
Abstract
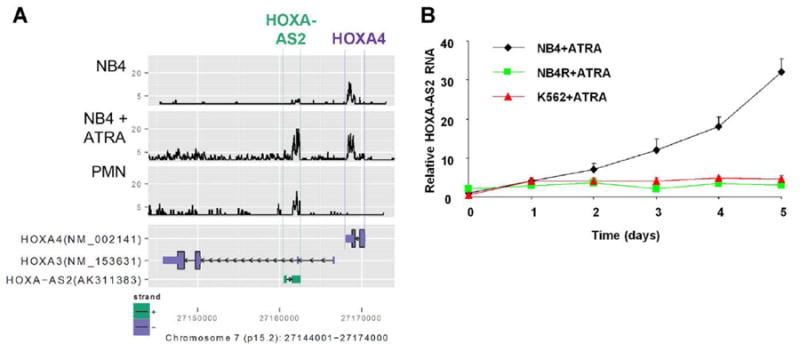
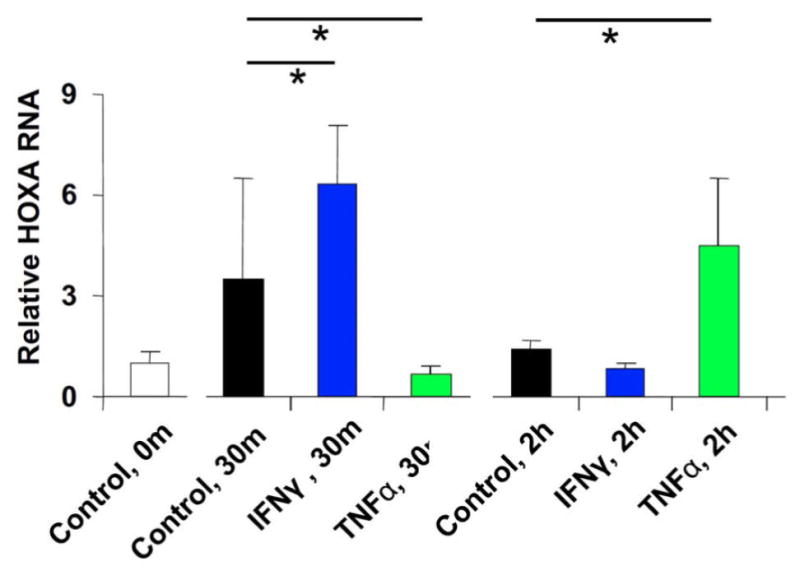
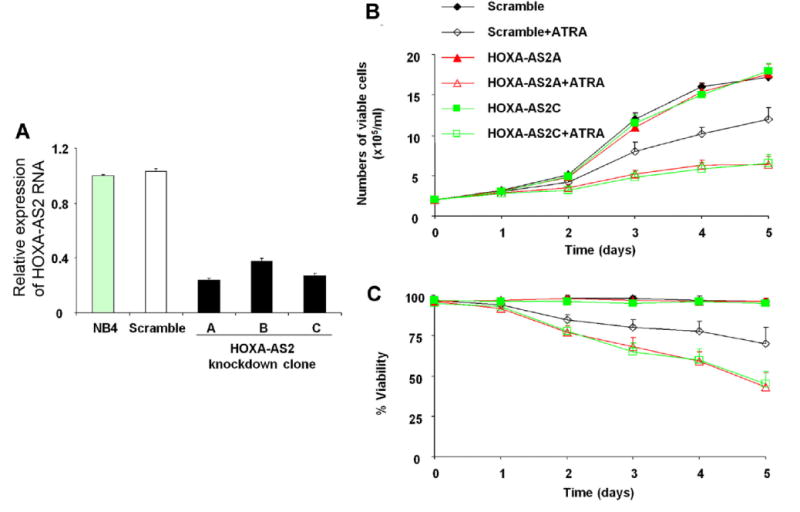
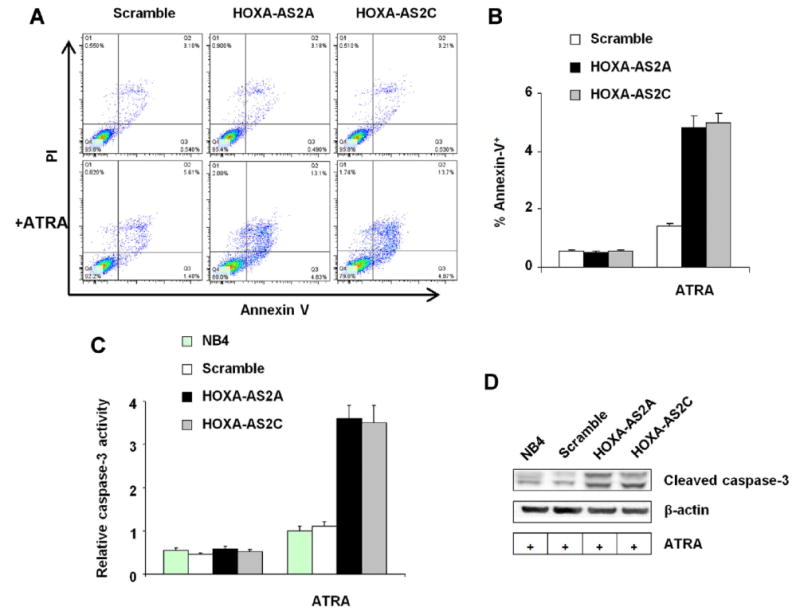
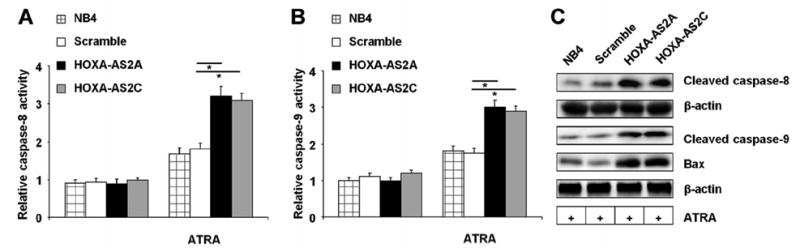
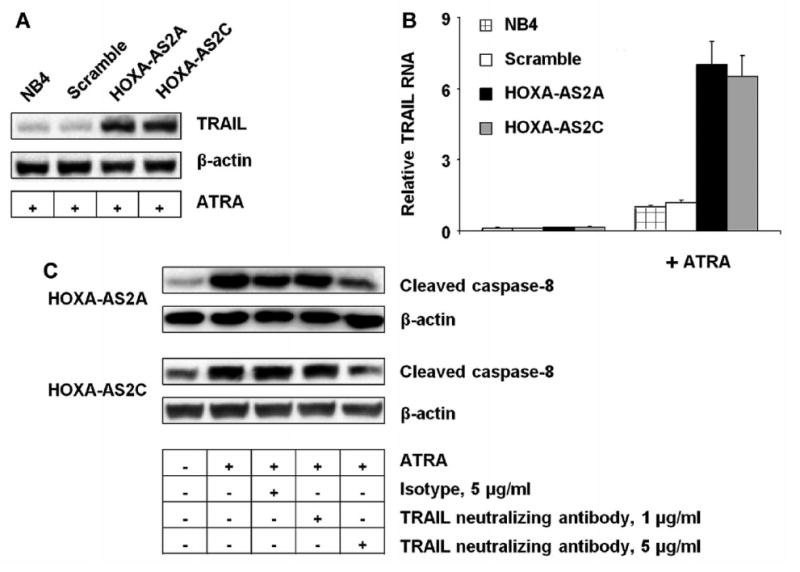
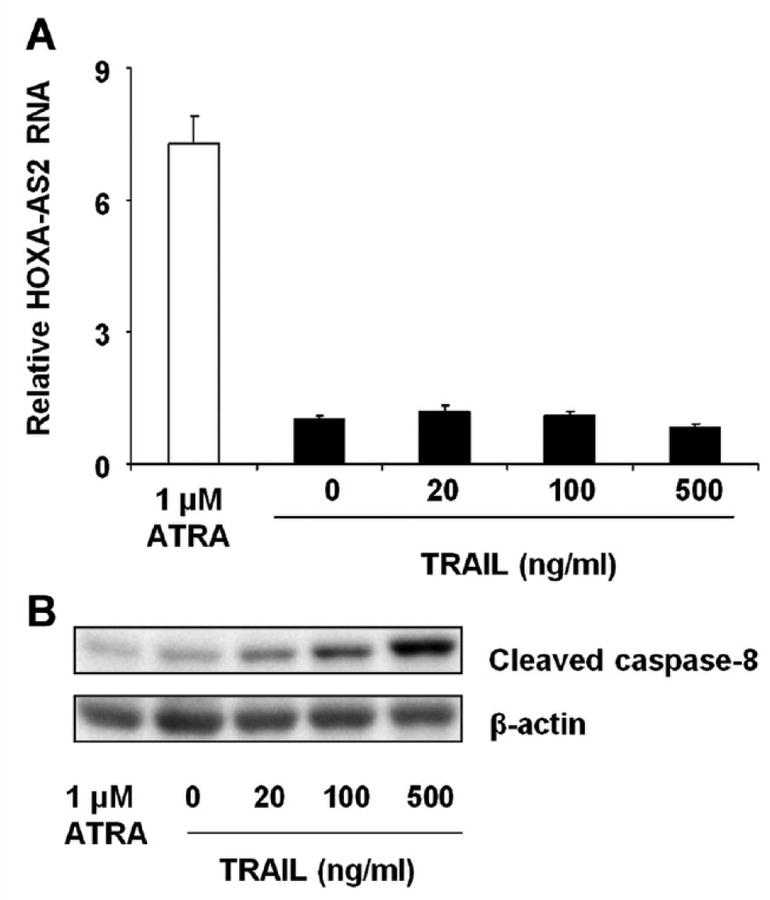
HOXA cluster antisense RNA 2 (HOXA-AS2) is a long non-coding RNA located between the HOXA3 and HOXA4 genes in the HOXA cluster. Its transcript is expressed in NB4 promyelocytic leukemia cells and human peripheral blood neutrophils, and expression is increased in NB4 cells treated with all trans retinoic acid (ATRA). Knockdown of HOXA-AS2 expression by transduced shRNA decreases the number of viable cells and increases the proportion of apoptotic cells, measured by annexin V binding and by activity and cleavage of caspases-3, -8, and -9. The increase in death of HOXA-AS2 knockdown cells was accompanied by an elevated TNF-related apoptosis-inducing ligand (TRAIL) levels, but ATRA-induced NB4 cells treated with TRAIL did show an increase in HOXA-AS2 expression. These results demonstrate that ATRA induction of HOXA-AS2 suppresses ATRA-induced apoptosis, possibly through a TRAIL-mediated pathway. HOXA-AS2-mediated negative regulation thus contributes to the fine-tuning of apoptosis during ATRA-induced myeloid differentiation in NB4 cells.
Keywords: APOPTOSIS; Hox GENE CLUSTER; LONG INTERGENIC NON-CODING RNA (lincRNA); MYELOID; NON-CODING RNA.
Copyright © 2013 Wiley Periodicals, Inc.
Figures
Similar articles
-
FOXO3A as a key molecule for all-trans retinoic acid-induced granulocytic differentiation and apoptosis in acute promyelocytic leukemia.Blood. 2010 May 6;115(18):3787-95. doi: 10.1182/blood-2009-05-222976. Epub 2010 Mar 9. Blood. 2010. PMID: 20215638
-
Overexpression of long noncoding RNA HOXA-AS2 predicts an adverse prognosis and promotes tumorigenesis via SOX4/PI3K/AKT pathway in acute myeloid leukemia.Cell Biol Int. 2020 Aug;44(8):1745-1759. doi: 10.1002/cbin.11370. Epub 2020 Jun 10. Cell Biol Int. 2020. PMID: 32369230
-
Long intergenic non-coding RNA HOTAIRM1 regulates cell cycle progression during myeloid maturation in NB4 human promyelocytic leukemia cells.RNA Biol. 2014;11(6):777-87. doi: 10.4161/rna.28828. Epub 2014 Apr 24. RNA Biol. 2014. PMID: 24824789 Free PMC article.
-
The functional role of LncRNA HOXA-AS2 in multiple human cancers.Pathol Res Pract. 2025 Feb;266:155795. doi: 10.1016/j.prp.2024.155795. Epub 2024 Dec 24. Pathol Res Pract. 2025. PMID: 39756105 Review.
-
LncRNA HOXA-AS2 and its molecular mechanisms in human cancer.Clin Chim Acta. 2018 Oct;485:229-233. doi: 10.1016/j.cca.2018.07.004. Epub 2018 Jul 4. Clin Chim Acta. 2018. PMID: 29981289 Review.
Cited by
-
Long Non-Coding RNAs, Nuclear Receptors and Their Cross-Talks in Cancer-Implications and Perspectives.Cancers (Basel). 2024 Aug 22;16(16):2920. doi: 10.3390/cancers16162920. Cancers (Basel). 2024. PMID: 39199690 Free PMC article. Review.
-
Long non-coding RNAs in the regulation of myeloid cells.J Hematol Oncol. 2016 Sep 29;9(1):99. doi: 10.1186/s13045-016-0333-7. J Hematol Oncol. 2016. PMID: 27680332 Free PMC article. Review.
-
Long Non-coding RNA LOC285194 Promotes Epithelial Ovarian Cancer Progression via the Apoptosis Signaling Pathway.In Vivo. 2022 Jan-Feb;36(1):121-131. doi: 10.21873/invivo.12683. In Vivo. 2022. PMID: 34972707 Free PMC article.
-
Upregulation of long non-coding RNA HOXA-AS2 promotes proliferation and induces epithelial-mesenchymal transition in gallbladder carcinoma.Oncotarget. 2017 May 16;8(20):33137-33143. doi: 10.18632/oncotarget.16561. Oncotarget. 2017. PMID: 28388535 Free PMC article.
-
Knockdown of HOXA-AS2 suppresses proliferation and induces apoptosis in colorectal cancer.Am J Transl Res. 2017 Oct 15;9(10):4545-4552. eCollection 2017. Am J Transl Res. 2017. PMID: 29118916 Free PMC article.
References
-
- Altucci L, Rossin A, Raffelsberger W, Reitmair A, Chomienne C, Gronemeyer H. Retinoic acid-induced apoptosis in leukemia cells is mediated by paracrine action of tumor-selective death ligand TRAIL. Nat Med. 2001;7:680–686. - PubMed
-
- Bodmer JL, Holler N, Reynard S, Vinciguerra P, Schneider P, Juo P, Blenis J, Tschopp J. TRAIL receptor-2 signals apoptosis through FADD and caspase-8. Nat Cell Biol. 2000;2:241–243. - PubMed
Publication types
MeSH terms
Substances
Grants and funding
LinkOut - more resources
Full Text Sources
Other Literature Sources
Research Materials
