. 2013 Sep;6(5):1123-32.
doi: 10.1242/dmm.011924. Epub 2013 May 2.

Evidence for transgenerational metabolic programming in Drosophila

Affiliations

Evidence for transgenerational metabolic programming in Drosophila

Jessica L Buescher et al. Dis Model Mech. 2013 Sep.

Abstract

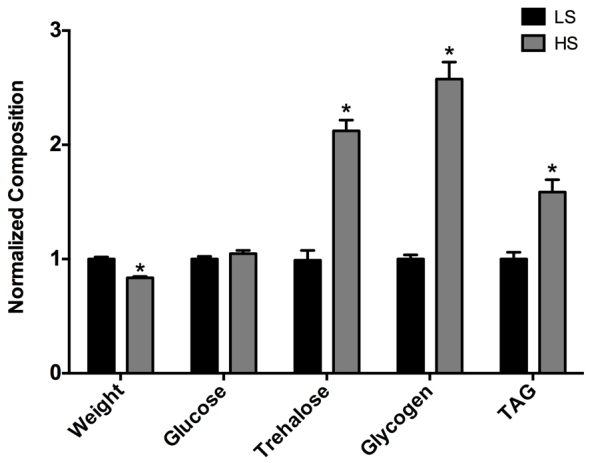
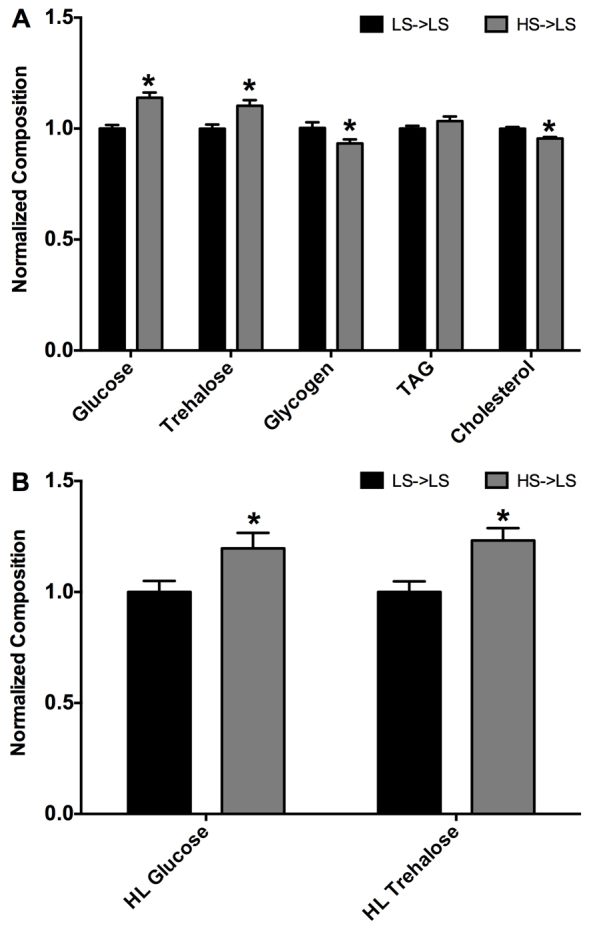
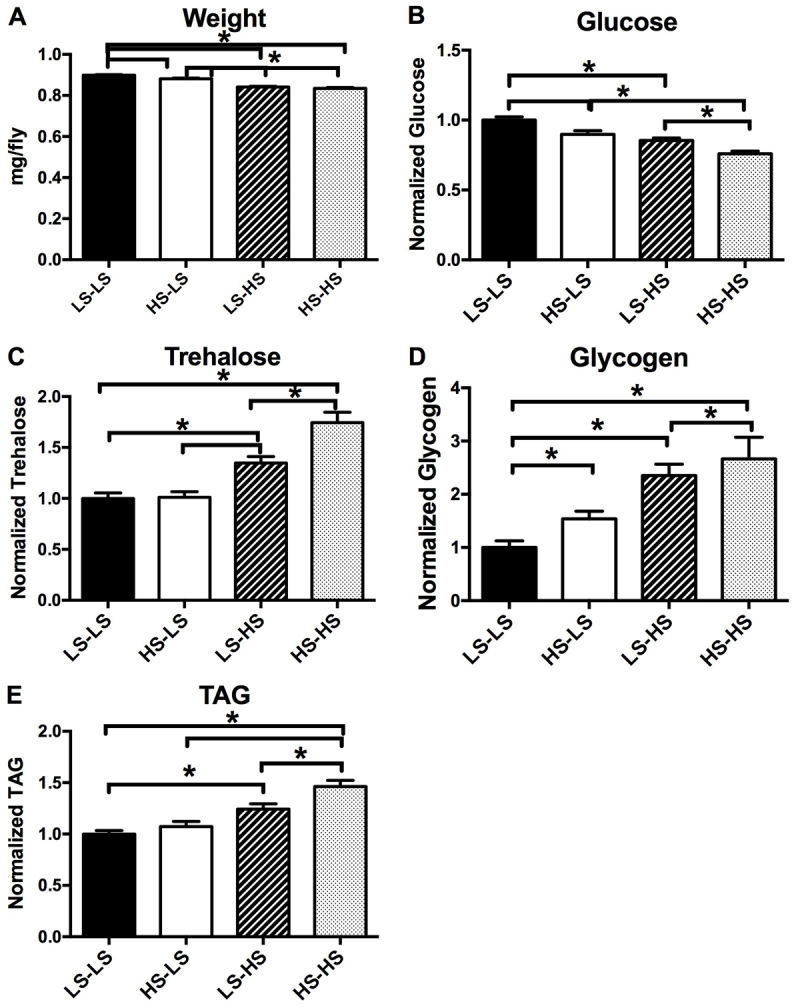
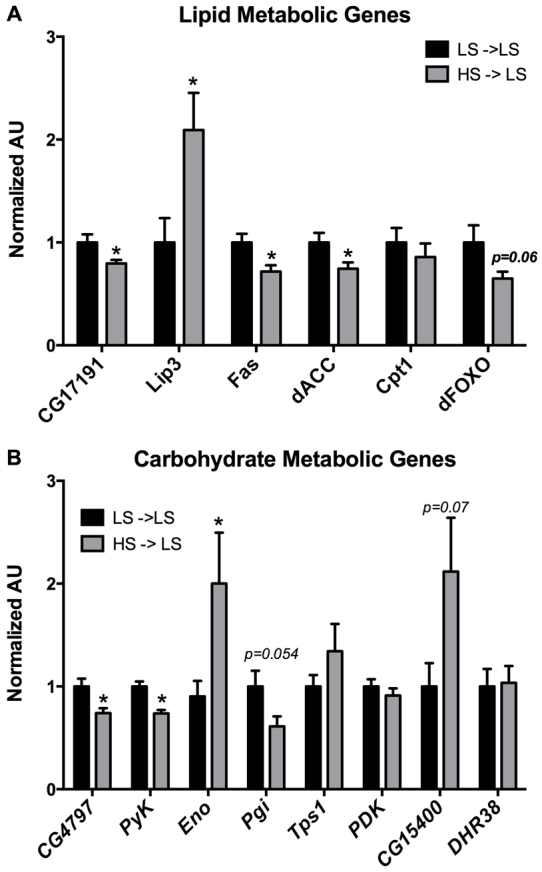
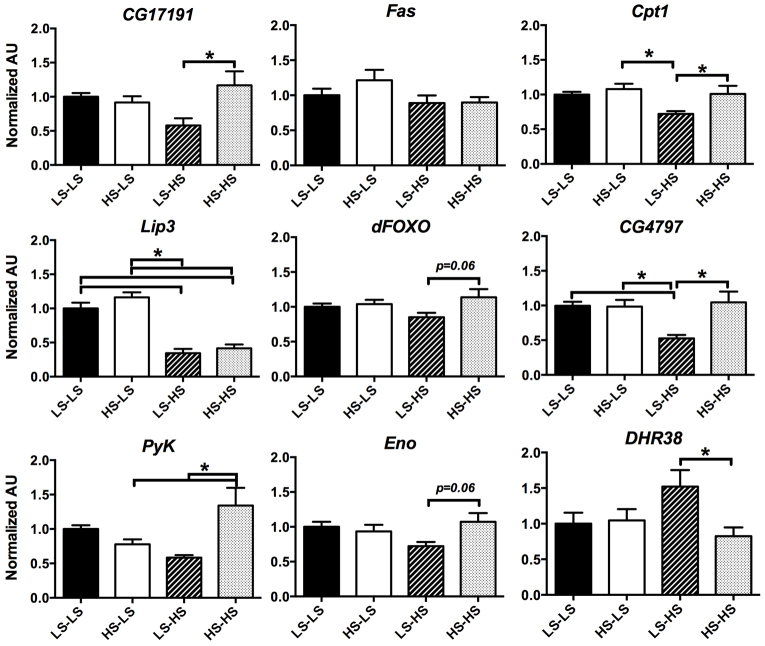
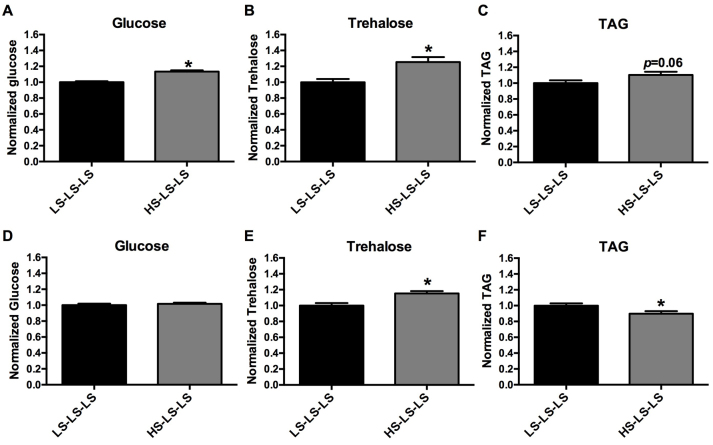
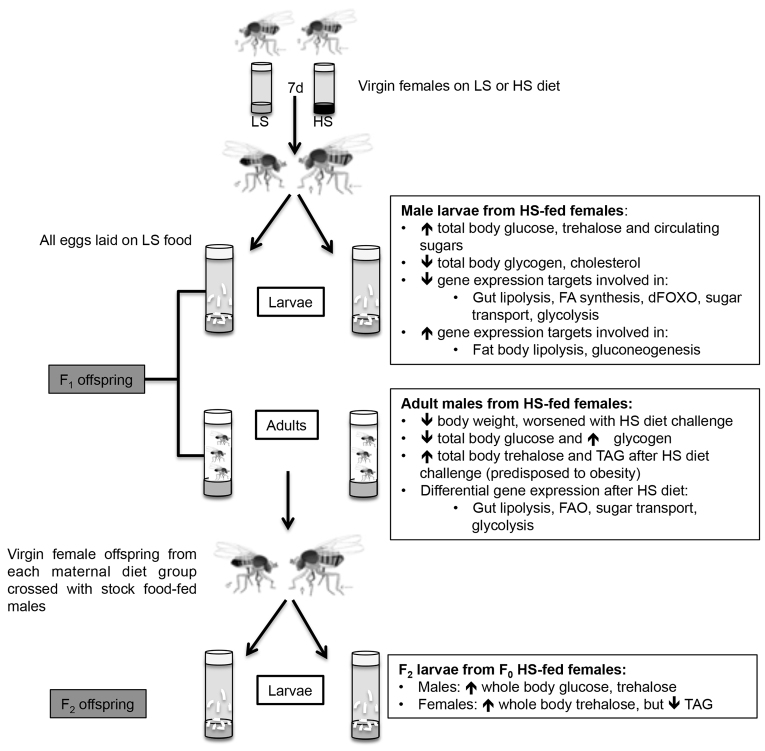
Worldwide epidemiologic studies have repeatedly demonstrated an association between prenatal nutritional environment, birth weight and susceptibility to adult diseases including obesity, cardiovascular disease and type 2 diabetes. Despite advances in mammalian model systems, the molecular mechanisms underlying this phenomenon are unclear, but might involve programming mechanisms such as epigenetics. Here we describe a new system for evaluating metabolic programming mechanisms using a simple, genetically tractable Drosophila model. We examined the effect of maternal caloric excess on offspring and found that a high-sugar maternal diet alters body composition of larval offspring for at least two generations, augments an obese-like phenotype under suboptimal (high-calorie) feeding conditions in adult offspring, and modifies expression of metabolic genes. Our data indicate that nutritional programming mechanisms could be highly conserved and support the use of Drosophila as a model for evaluating the underlying genetic and epigenetic contributions to this phenomenon.


Figures

Fig. 1.
Fig. 1.
HS-fed virgin females exhibit an obese-like phenotype. Virgin female body composition after 7 days of low sucrose (LS) or high sucrose (HS) diet. Bars represent mean body composition, normalized to weight and presented as fold change versus LS control ± s.e.m.; n=13–15 pooled samples; *P<0.05.
Fig. 2.
Fig. 2.
Male larval offspring from HS-fed maternal flies have altered body composition and circulating sugar levels. (A) Wandering L3 (wL3) total body composition. Bars represent mean body composition, normalized to weight and presented as fold change relative to LS-LS control ± s.e.m.; n≥25. (B) Hemolymph glucose and trehalose concentrations from wL3 offspring. Bars represent mean concentration as compared with controls (LS-LS=1.0) ± s.e.m.; n=16–18 pooled samples; * P<0.05.
Fig. 3.
Fig. 3.
Diet-challenged offspring from HS-fed maternal flies exhibit altered body composition. (A–E) Total body composition of adult male offspring after 14 days of diet challenge with either low sucrose (LS) or high sucrose (HS) diet. x-axis labels denote maternal diet-offspring adult diet after eclosion. Bars represent mean body composition, normalized to weight and presented as fold change versus control (LS-LS=1.0) ± s.e.m.; n≥20 pooled samples; P<0.05 versus *LS-LS.
Fig. 4.
Fig. 4.
wL3 male offspring from HS-fed maternal flies exhibit altered gene expression. (A,B) qRT-PCR analysis of mRNA from mL3 male offspring for genes involved in lipid metabolism (CG17191, Lip3, Fas, dACC, Cpt1, dFOXO) and carbohydrate metabolism [CG4797 (glucose transporter), PyK, Eno, Pgi, Tps1, Pdk, CG15400 (glucose-6-phosphatase), DHR38]. Bars represent relative expression ± s.e.m., presented as fold change compared with the control value (=1.0) in each case. All expression data was normalized to α-tubulin 84B mRNA. n=8–10 pooled samples; *P<0.05.
Fig. 5.
Fig. 5.
Diet-challenged male adult offspring exhibit differential gene expression. qRT-PCR analysis of mRNA from adult male offspring from either LS- or HS-fed maternal flies cultured on either LS (LS-LS, HS-LS) or HS (LS-HS, HS-HS) food for 14 days after eclosion. Transcripts of gene involved in lipid metabolism: CG17191 (lipase), Fas, Cpt1, Lip3, dFOXO; and carbohydrate metabolism: CG4797 (glucose transporter), PyK, Eno and DHR38. Bars represent mean relative expression ± s.e.m., presented as fold change versus the control value (=1.0) in each case. All expression data was normalized to α-tubulin 84B mRNA. n=10–14 pooled samples; P<0.05 versus *LS-LS.
Fig. 6.
Fig. 6.
Second-generation larval offspring have significant changes in body composition after a maternal HS diet. wL3 total body composition of F2 generation male offspring (A–C) [(A) glucose, (B) trehalose, (C) TAG] and females (D–F) [(D) glucose, (E) trehalose, (F) TAG]. x-axis labels denote maternal diet-F1 larval and adult diets-F2 larval diet. Bars represent mean body composition, normalized to weight and presented as compared with control (LS-LS-LS=1.0) ± s.e.m.; n=20–30 pooled samples; *P<0.05 versus LS-LS-LS.
Fig. 7.
Fig. 7.
Summary of experimental design and results. Virgin female flies were placed on either an LS or HS diet for 7 days and then crossed with wild-type male flies (from stock food). All offspring developed on LS food. F1 offspring were examined at both the larval and adult stage and had altered body composition and expression of metabolic target genes. Virgin female F1 offspring were collected and crossed with stock-food-fed males. Both male and female F2 larval offspring had body composition changes. FAO, fatty acid oxidation.

Similar articles

Cited by

References

    1. Aguila J. R., Suszko J., Gibbs A. G., Hoshizaki D. K. (2007). The role of larval fat cells in adult Drosophila melanogaster. J. Exp. Biol. 210, 956–963 - PubMed
    1. Andres A. J., Thummel C. S. (1994). Methods for quantitative analysis of transcription in larvae and prepupae. Methods Cell Biol. 44, 565–573 - PubMed
    1. Backhaus B. S. E., Sulkowski E., Schlote F. W. (1984). A semi-synthetic, general-purpose medium for Drosophila melanogaster. Drosoph. Inf. Serv. 60, 210–212
    1. Baker K. D., Thummel C. S. (2007). Diabetic larvae and obese flies-emerging studies of metabolism in Drosophila. Cell Metab. 6, 257–266 - PMC - PubMed
    1. Baker J. L., Olsen L. W., Sørensen T. I. (2007). Childhood body-mass index and the risk of coronary heart disease in adulthood. N. Engl. J. Med. 357, 2329–2337 - PMC - PubMed

Publication types

LinkOut - more resources