. 2013 Jul;41(13):6553-67.
doi: 10.1093/nar/gkt313. Epub 2013 May 6.

The mTERF protein MOC1 terminates mitochondrial DNA transcription in the unicellular green alga Chlamydomonas reinhardtii

Affiliations

The mTERF protein MOC1 terminates mitochondrial DNA transcription in the unicellular green alga Chlamydomonas reinhardtii

Lutz Wobbe et al. Nucleic Acids Res. 2013 Jul.

Abstract

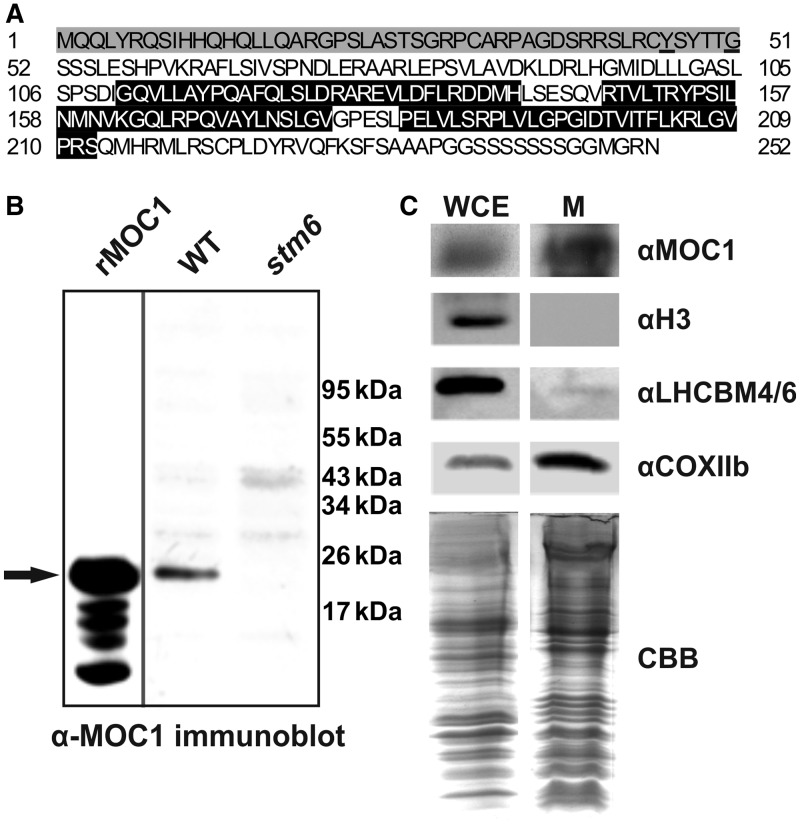
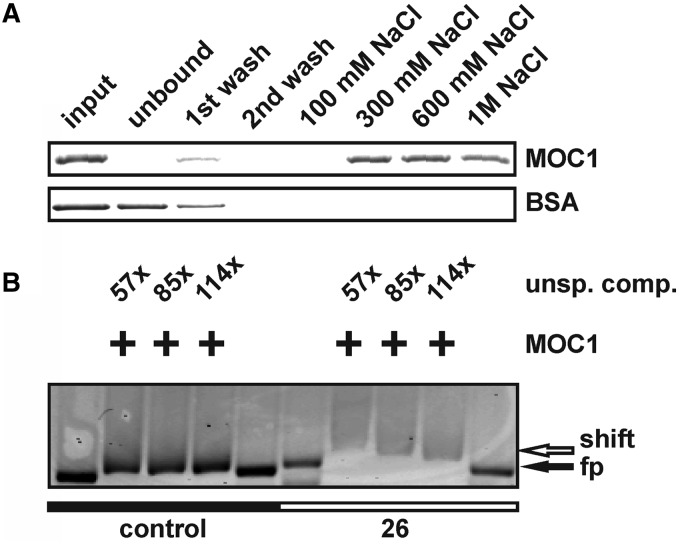
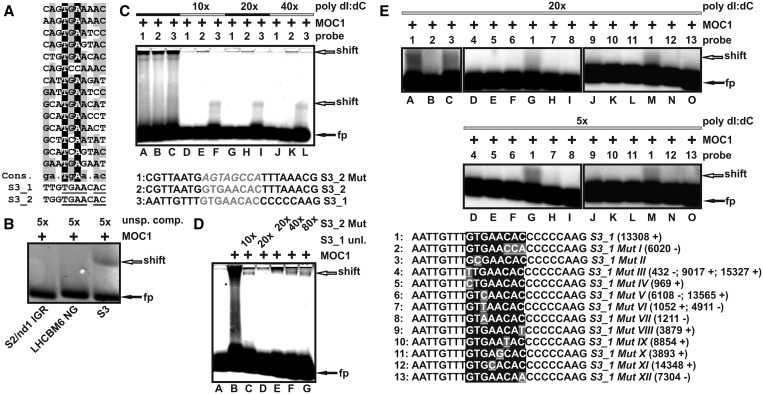
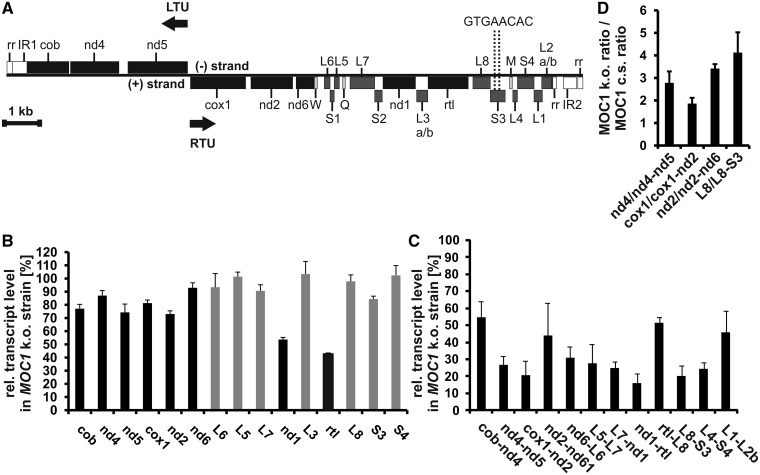
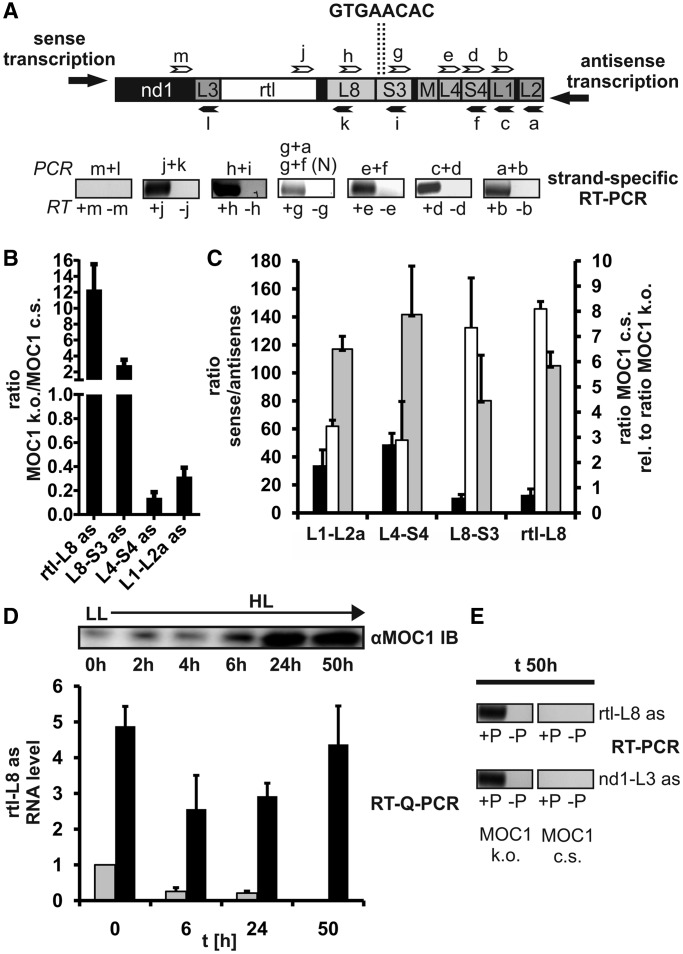
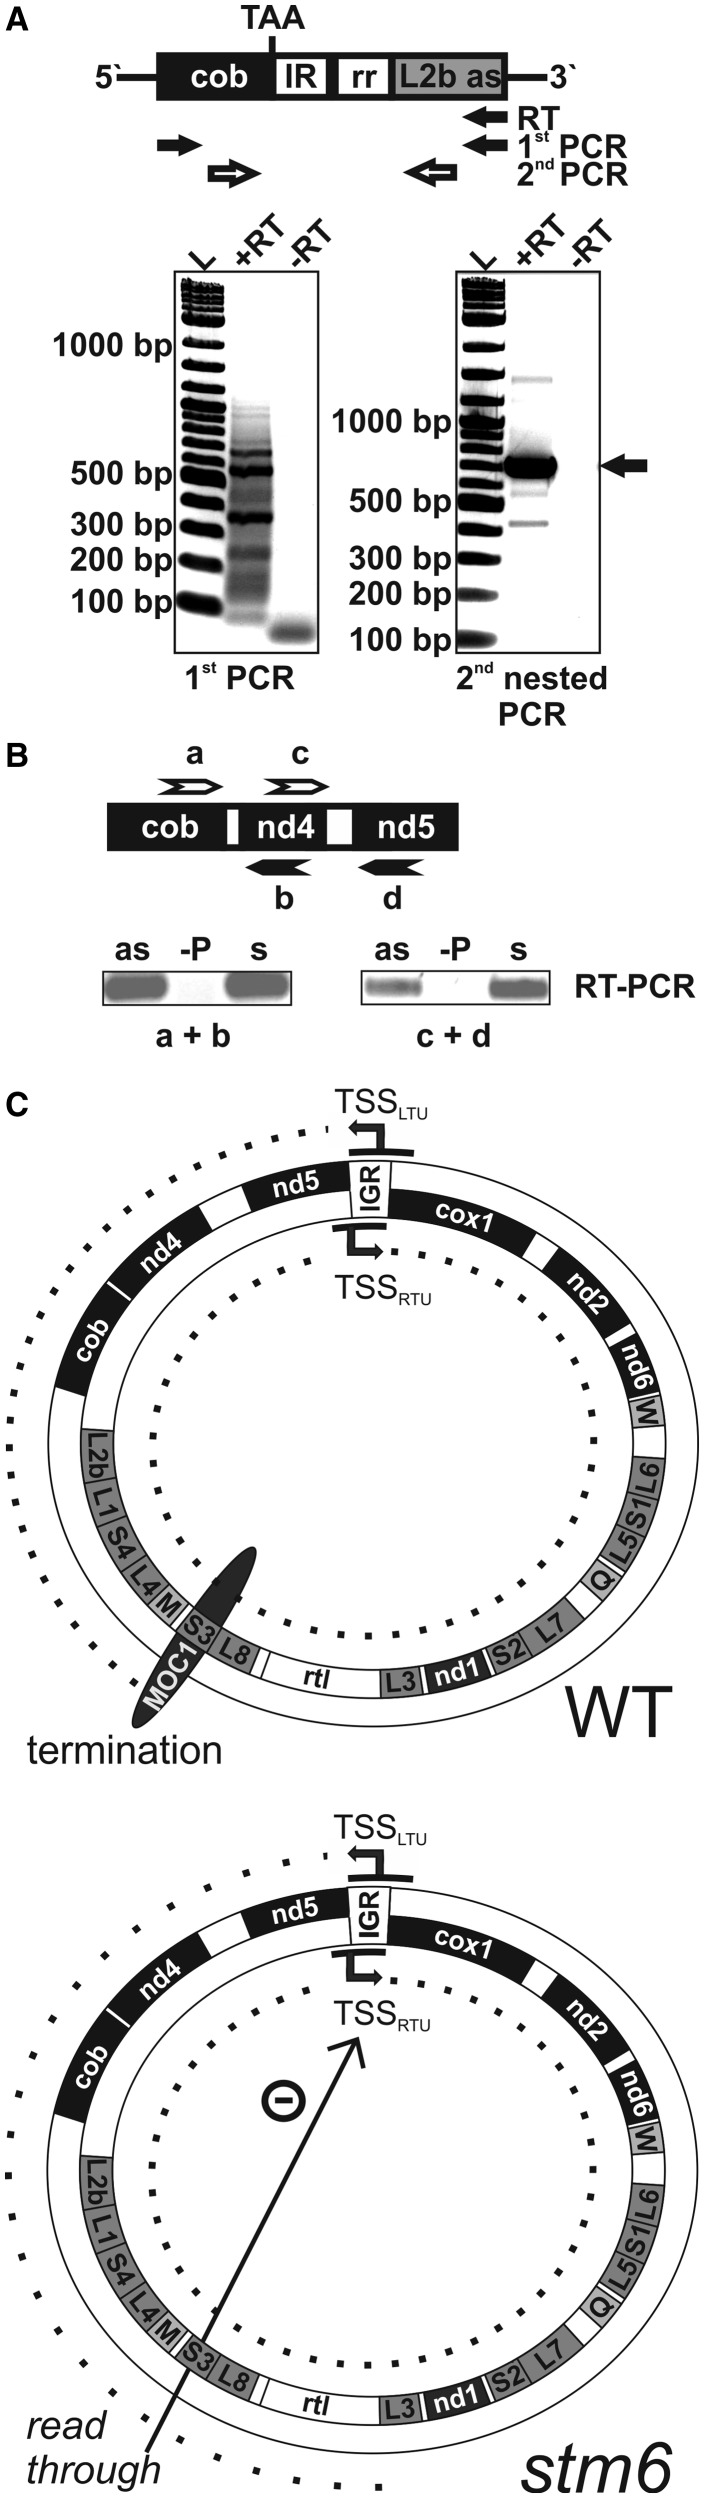
The molecular function of mTERFs (mitochondrial transcription termination factors) has so far only been described for metazoan members of the protein family and in animals they control mitochondrial replication, transcription and translation. Cells of photosynthetic eukaryotes harbour chloroplasts and mitochondria, which are in an intense cross-talk that is vital for photosynthesis. Chlamydomonas reinhardtii is a unicellular green alga widely used as a model organism for photosynthesis research and green biotechnology. Among the six nuclear C. reinhardtii mTERF genes is mTERF-like gene of Chlamydomonas (MOC1), whose inactivation alters mitorespiration and interestingly also light-acclimation processes in the chloroplast that favour the enhanced production of biohydrogen. We show here from in vitro studies that MOC1 binds specifically to a sequence within the mitochondrial rRNA-coding module S3, and that a knockout of MOC1 in the mutant stm6 increases read-through transcription at this site, indicating that MOC1 acts as a transcription terminator in vivo. Whereas the level of certain antisense RNA species is higher in stm6, the amount of unprocessed mitochondrial sense transcripts is strongly reduced, demonstrating that a loss of MOC1 causes perturbed mitochondrial DNA (mtDNA) expression. Overall, we provide evidence for the existence of mitochondrial antisense RNAs in C. reinhardtii and show that mTERF-mediated transcription termination is an evolutionary-conserved mechanism occurring in phototrophic protists and metazoans.


Figures

Figure 1.
Figure 1.
In silico prediction and biochemical evidence for mitochondrial targeting of MOC1. (A) Amino acid sequence (UniProtKB A8IXZ5) of MOC1. The mitochondrial targeting sequence is highlighted in grey, and cleavage sites predicted by MitoProtII or Predalgo are underlined. The three mTERF motifs are highlighted in black. (B) Comparison of the apparent molecular weight of recombinant His-tagged MOC1 lacking the mitochondrial targeting sequence predicted by MitoProtII (rMOC1) and mature MOC1 in a C. reinhardtii wild-type protein extract (WT) by immunodetection. An arrow indicates the position of recombinant and native MOC1. The MOC1 knockout mutant stm6 served as a control to assess the specificity of the antiserum raised against MOC1. (C) Immunodetection of MOC1 (αMOC1) in whole-cell extracts (WCE) and purified mitochondria (M). Immunoblots using antibodies directed against histone H3 (αH3) and light-harvesting proteins (αLHCBM4/6) were performed to assess the purity of the mitochondrial fraction. COXIIb served as a mitochondrial marker protein. A Coomassie brilliant blue (CBB) stain of mitochondrial fractions and the whole-cell extract served as a loading control.
Figure 2.
Figure 2.
In vitro studies with the recombinant MOC1 protein indicate specific binding to dsDNA. (A) Incubation of recombinant MOC1 or BSA with dsDNA–cellulose. Input samples taken before incubation with DNA cellulose and supernatant (unbound) samples after incubation were analysed by SDS–PAGE and CBB staining. Wash fractions (first and second wash) and eluted fractions (100 mM–1 M NaCl) were analysed as well. BSA served as a control to assess the stringency of the chromatographic conditions. (B) Gel shift assay with fluorescently-labelled mtDNA probe 26 (NCBI Accession NC_001638; nt 13064-13604) and a control probe representing part of the nuclear LHCBM6 gene (NCBI Accession M24072; nt 756–1289). Fluorescent probes were detected via their Cy-3 labels. Addition of recombinant MOC1 is indicated by ‘+’, and the mass excess of unspecific competitor (unsp. comp.) is given as well. The position of free probe (fp) and shifted probe (shift) is indicated by arrows.
Figure 3.
Figure 3.
Identification of two MOC1-binding sites located in the mitochondrial rRNA-coding module S3. (A) Alignment of the CAST library sequences, which contributed to the motif identified by MEME. A derived consensus (Cons.) is shown together with the two octanucleotide sequences (S3_1 and S3_2) found in the rRNA-coding S3 module. A consensus >50%, but <90% is highlighted in grey. Sequence positions with a consensus of at least 90% or higher are presented in black. Nucleotides within S3_1/S3_2, which match to the consensus sequence, are underlined. (B) EMSA with a 147-bp probe (NCBI Accession NC_001638; + strand; nt 13293–13439) representing a fragment of probe 26, which contains both octanucleotide sequences S3_1 and S3_2 (S3). Control probes (negative controls) were derived from the intergenic region between the mitochondrial S2 and nd1 genes (NCBI Accession NC_001638; + strand; nt 10269–10381; 134 bp) or the nucleus-encoded LHCBM6 gene (NCBI Accession M24072; nt 756–906; 152 bp). Probes were detected by fluorescence emission of their Cy-3 modification. Addition of recombinant MOC1 (+), the mass excess of unspecific competitor (unsp. comp.), and the position of free (fp) and shifted probe (shift) are indicated. (C) EMSA with short fluorescent oligonucleotide probes (bottom part; sequences of S3_2 Mut, S3_2 and S3_1) and recombinant MOC1 (MOC1 ‘+’) in the presence or absence of unspecific competitor (poly dI:dC) in mass excess relative to the amount of probe (10–40×). Numbers (top part; probe) indicate which probe was added to the binding reaction, and arrows are the positions of free probe (black arrow; fp) and complexes (white arrow; shift) in the gel. (D) Specific and unspecific competition experiments with probe S3_1. The fluorescently labelled probe S3_1 was added to recombinant MOC1 (MOC1 ‘+’) in the presence of its unlabelled counterpart (S3_1 unl.), which was added in molar excess relative to the labelled probe (10×; 20×). The unlabelled probe S3_2 Mut (sequence given in Figure 3C) was used as an unspecific competitor and added to the labelled probe S3_1 in molar excess (20×; 40×; 80×). (E) EMSA binding studies with probe S3_1 (sequence No. 1) and 12 probes containing mutations of the GTGAACAC recognition motif (S3_1 MutI-XII) in the presence of unspecific competitor (poly dI:dC) with mass excess indicated. For each tested octanucleotide motif, the mtDNA locations (NCBI Accession NC_001638) on the ‘+’ or ‘−’ strand is given in brackets.
Figure 4.
Figure 4.
Effects on mtDNA content and transcript levels caused by a knockout of MOC1 in the mutant stm6. (A) Map of the C. reinhardtii mitochondrial genome. Genes are presented as rectangles, and black arrows indicate the directions of transcription. Protein-coding genes are shown in black, ribosomal genes in dark grey and tRNA genes in light grey. nd4, nd5, nd2, nd6 and nd1 encode subunits of the Nicotinamide adenine dinucleotide dehydrogenase complex (complex I). cob is apocytochrome b belonging to complex III. cox1 represents subunit 1 of cytochrome c oxidase (complex IV) and rtl a reverse transcriptase-like protein. W, Q and M represent tRNA genes for tryptophan, glutamine and methionine codons. The genes L1–L7 encode large-subunit rRNA-coding modules and genes S1–S4 small-subunit modules. LTU comprises the genes cob, nd4 and nd5 encoded on the (−)-strand and RTU comprises all remaining genes on the (+)-strand. Structural elements of the left and right telomeres are indicated as IR (inverted repeat region) and rr (86-bp repeat) according to Vahrenholz et al. (4). The map is drawn to scale except for the telomere region (white rectangles; rr and IR). (B) Reverse transcription–quantitative-PCR analyses with all mitochondrial genes encoding OXPHOS complex subunits, the rtl gene encoding a reverse transcriptase-like protein (black bars) and selected ribosomal RNA genes (grey bars). Transcript levels in stm6 (MOC1 k.o. strain) are given in per cent and were calculated relative to the level in the MOC1-complemented strain (set to 100%). Error bars indicate the standard error derived from two biological replicates each including three technical replicates (n = 6). (C) Analysis of bicistronic transcript levels in the MOC1 knockout strain and the complemented strain by RT–Q-PCR. The relative transcript level (MOC1-complemented strain set to 100%) in the knockout strain is plotted on the y-axis, and error bars indicate the standard error (n = 6). (D) Relative expression level ratios of processed to unprocessed transcripts were determined in the MOC1 knockout (MOC1 k.o.) and complemented strain (MOC1 c.s.) by RT–Q-PCR. Ratios in the knockout mutant (y-axis) are given relative to those found in the complemented strain (set to 1), and analysed RNA species are indicated on the x-axis. Error bars (n = 6) are derived from two biological replicates each including three technical replicates.
Figure 5.
Figure 5.
Detection and quantification of antisense RNAs encoded by sequences upstream or downstream of the MOC1-binding site. (A) Upper panel: arrangement of genes in the genome area surrounding the MOC1-binding sites (dotted lines) identified in vitro. Binding sites of forward primers (white arrows) and reverse primers (black arrows) used for reverse transcription and PCR are indicated. Lower panel: SYBR Gold-stain of RT–PCR products separated in an agarose gel after 40 PCR cycles. RT–PCR was carried out with total RNA samples from C. reinhardtii wild-type cc400. Strand-specific reverse transcription was performed in the presence (+) or absence (−) of gene-specific forward primers (white arrows; b, d, e, g, h, j and m) to rule out primer-independent cDNA synthesis by self-priming of RNA. Reverse primers (black arrows; a, c, f, i, k and l) were subsequently added to amplify cDNA by PCR. Detection of larger antisense RNAs required a second nested (N) PCR. (B) Quantification of antisense RNA levels in stm6 (MOC1 k.o.) and the MOC1-complemented strain (MOC1 c.s.) by strand-specific RT–Q-PCR. Values are given as the ratio of stm6 levels to those of the complemented strain. Error bars indicate the standard error derived from two biological replicates each including three technical replicates (n = 6). (C) Quantification of sense-to-antisense transcript level ratios in stm6 (black bars) and the MOC1-complemented strain (grey bars) by strand-specific RT–Q-PCR. The RNA species analysed is given on the x-axis and sense-to-antisense ratios on the left y-axis. The relative difference (MOC1 c.s. versus MOC1 k.o.) in sense-to-antisense ratios (white bars) is given on the right y-axis with ratios in the knockout mutant set to 1. Error bars indicate the standard error derived from three biological replicates, each including three technical replicates (n = 9). (D) Upper panel: anti-MOC1 immunoblot showing the time course of MOC1 accumulation after shifting phototrophic cultures of the complemented strain from low light (LL; 0 h) to high light (HL; 2, 4, 6, 24 and 50 h). Lower panel: RNA levels (y-axis) of antisense transcripts derived from the gene rtl and the rRNA-encoding module L8 in the MOC1-complemented strain (grey bars) and knockout mutant (black bars) determined by RT–Q-PCR. Time points (h) used for sample collection and RNA extraction during the LL-to-HL shift experiment are indicated on the x-axis. The RNA level at time point t0 in the complemented strain was set to 1. Error bars indicate the standard error derived from four technical replicates (n = 4). (E) SYBR Gold-stain of RT–PCR products separated in an agarose gel after 44 PCR cycles. RNA extracted from complemented strain and knockout mutant after 50 h of high-light exposure was used to detect two antisense RNA species encoded by sequences located downstream of the MOC1-binding sites.
Figure 6.
Figure 6.
Evidence for co-transcription of cob and L2b and a functional model for MOC1. (A) Upper panel: Structure of a transcript containing the coding sequence of cob and L2b in antisense (as) orientation, which results from the linkage of the left and right arm of the C. reinhardtii mitochondrial genome. The cob sequence and L2b as flank an inverted repeat region (IR) and the 86-bp region (rr) according to Vahrenholz et al. (4). TAA indicates the stop codon of the cob open reading frame. Detection of the transcript by RT–PCR involved RT with a gene-specific primer binding to the L2b as part of the transcript in the first step and two successive PCR reactions with nested primers (white arrows) used in the second PCR step. Lower panel: SYBR Gold stain of an agarose gel used to separate the PCR products of the first and second PCR reaction. Reverse transcription was carried in the absence (−RT) or presence (+RT) of reverse transcriptase. The main PCR product of the second PCR amplification (black arrow) was gel extracted and sub-cloned for sequencing. (B) Detection of antisense RNA derived from the non-coding strand of the left mtDNA arm by RT–PCR. RNA was converted to cDNA by strand-specific reverse transcription to detect antisense RNA (primers a and c; upper part) or sense RNA (primers b and d). PCR (primers a + b or c + d) was used to amplify cDNA before gel separation of products and staining (lower part). As a control, reverse transcription was performed in the absence of primers (−P). (C) A model depicting the function of MOC1 as it is suggested by the sum of data. Upper part: termination of LTU (left part of the circle) transcription by MOC1 at the S3-binding sites in a wild-type (WT) mitochondrion containing MOC1. The mtDNA of C. reinhardtii is presented as a circle. Black arrows indicate the direction of transcription, and dotted lines indicate the length of LTU/RTU-derived transcripts. Abbreviations: TSSLTU/RTU: transcription start sites of the leftward/rightward transcription units; IGR: intergenic region between nd5 and cox1; gene names as given in Figure 4A. Lower part: Lack of MOC1-mediated transcription termination in stm6. Read-through at the S3 site potentially reduces transcription of both units.

Similar articles

Cited by

References

    1. Asin-Cayuela J, Gustafsson CM. Mitochondrial transcription and its regulation in mammalian cells. Trends Biochem. Sci. 2007;32:111–117. - PubMed
    1. Lipinski KA, Kaniak-Golik A, Golik P. Maintenance and expression of the S. cerevisiae mitochondrial genome—from genetics to evolution and systems biology. Biochim. Biophys. Acta. 2010;1797:6–7. - PubMed
    1. Cardol P, Gloire G, Havaux M, Remacle C, Matagne R, Franck F. Photosynthesis and state transitions in mitochondrial mutants of Chlamydomonas reinhardtii affected in respiration. Plant Physiol. 2003;133:2010–2020. - PMC - PubMed
    1. Vahrenholz C, Riemen G, Pratje E, Dujon B, Michaelis G. Mitochondrial DNA of Chlamydomonas reinhardtii: the structure of the ends of the linear 15.8-kb genome suggests mechanisms for DNA replication. Curr. Genet. 1993;24:241–247. - PubMed
    1. Smith DR, Lee RW. Nucleotide diversity in the mitochondrial and nuclear compartments of Chlamydomonas reinhardtii: investigating the origins of genome architecture. BMC Evol. Biol. 2008;8:11. - PMC - PubMed

Publication types

MeSH terms