

Genome-wide organization and expression profiling of the NAC transcription factor family in potato (Solanum tuberosum L.)
- PMID: 23649897
- PMCID: PMC3738166
- DOI: 10.1093/dnares/dst019
Genome-wide organization and expression profiling of the NAC transcription factor family in potato (Solanum tuberosum L.)
Abstract
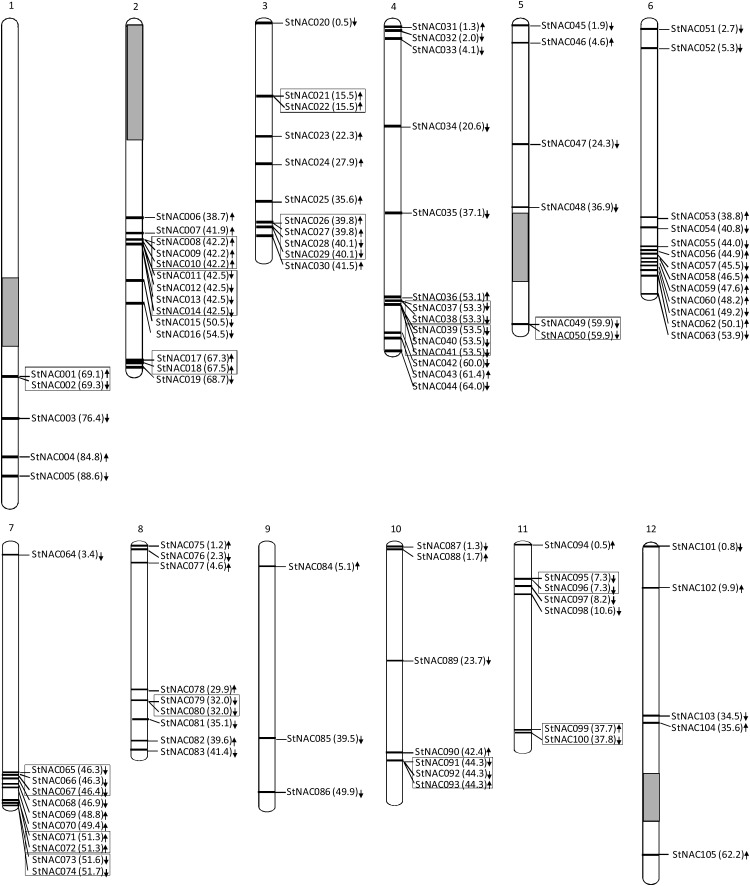
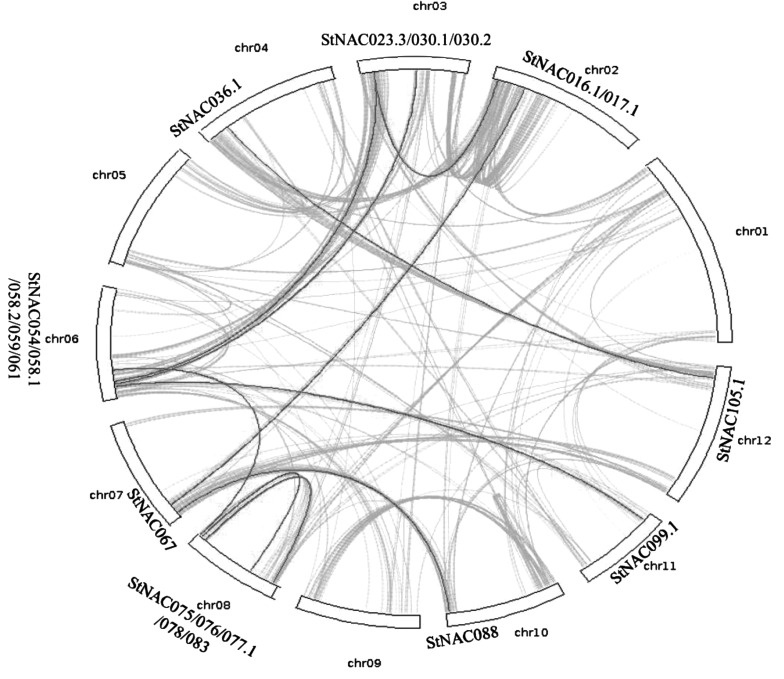
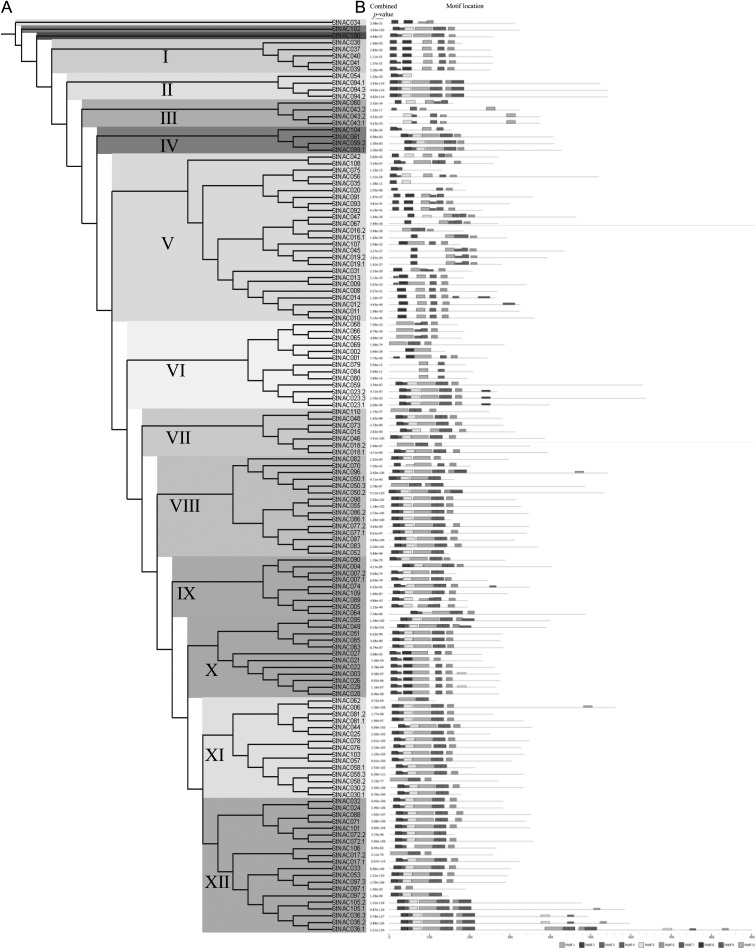
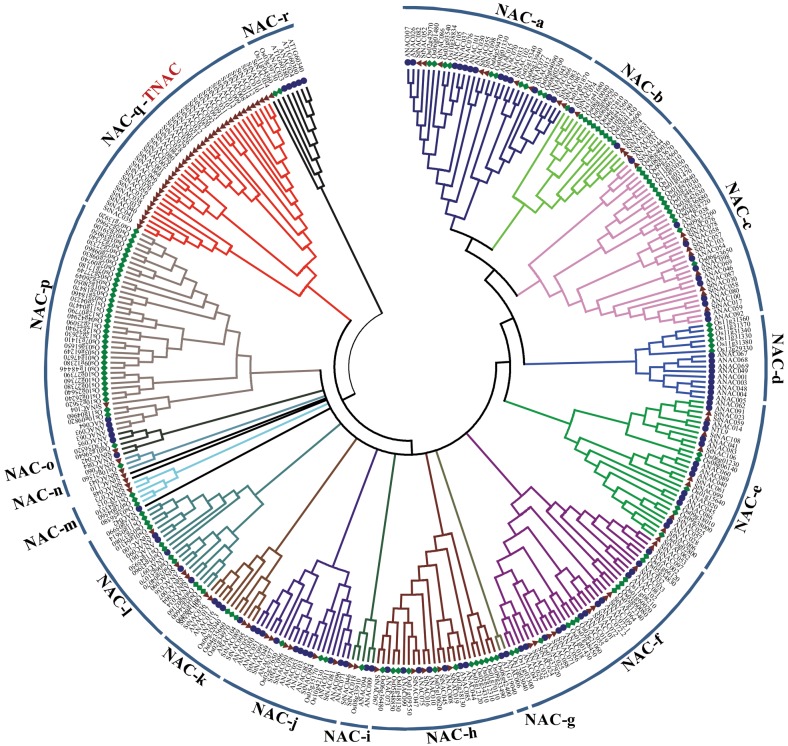
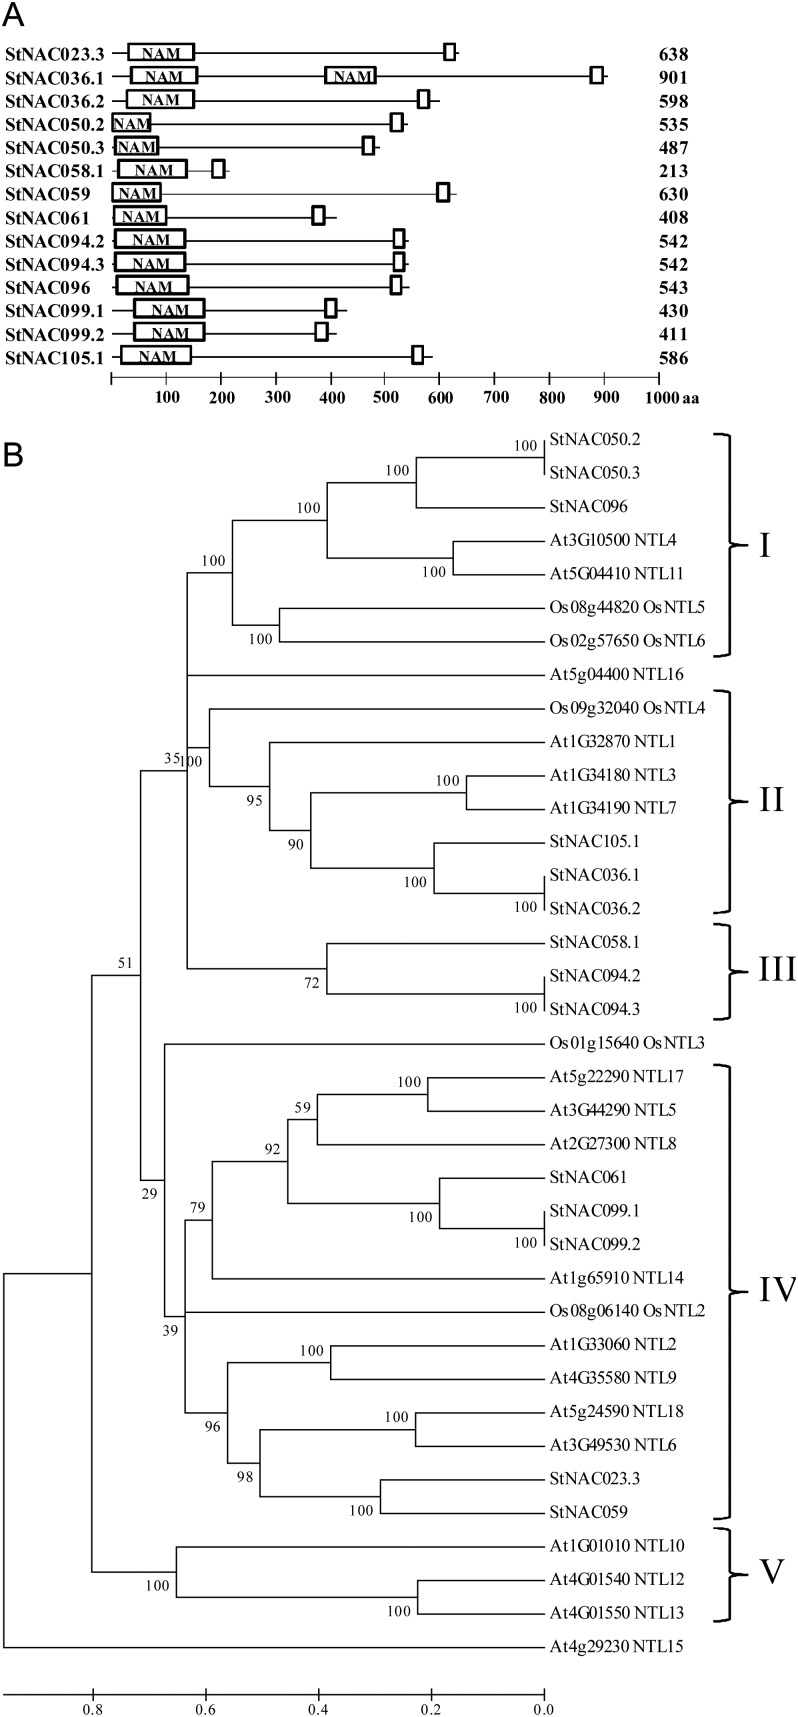
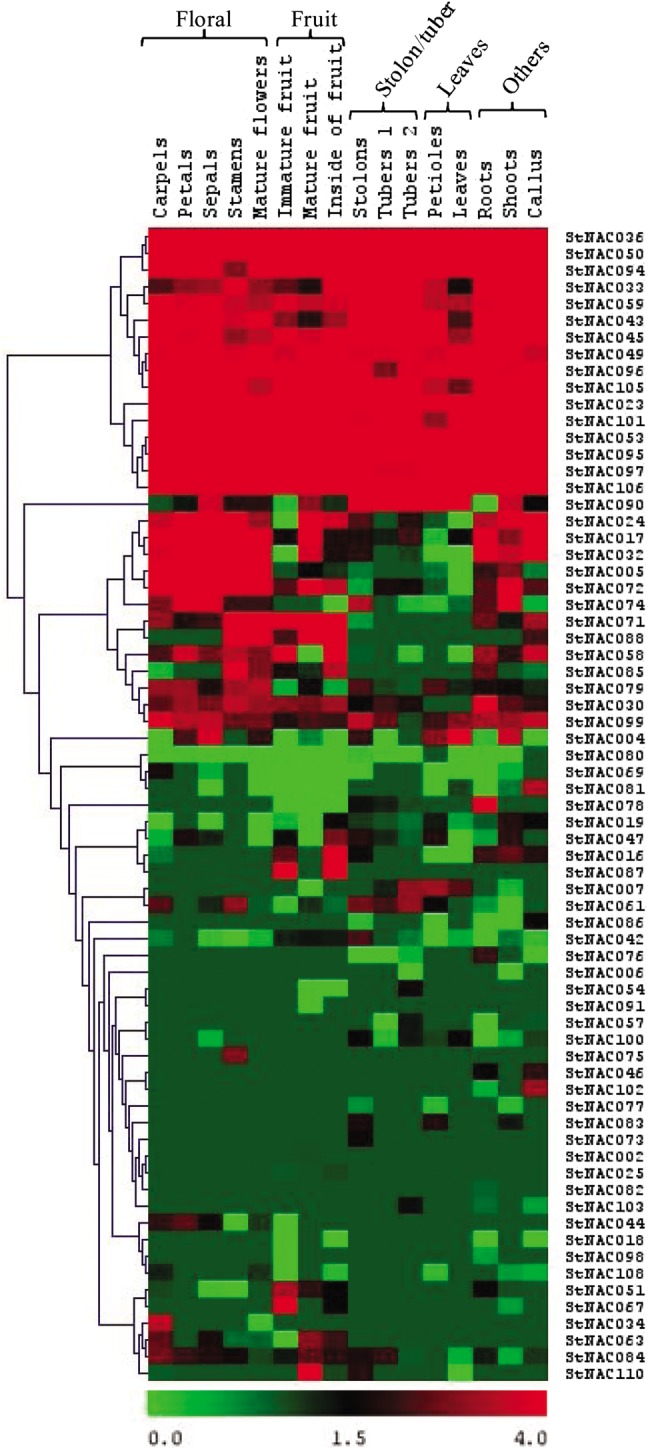
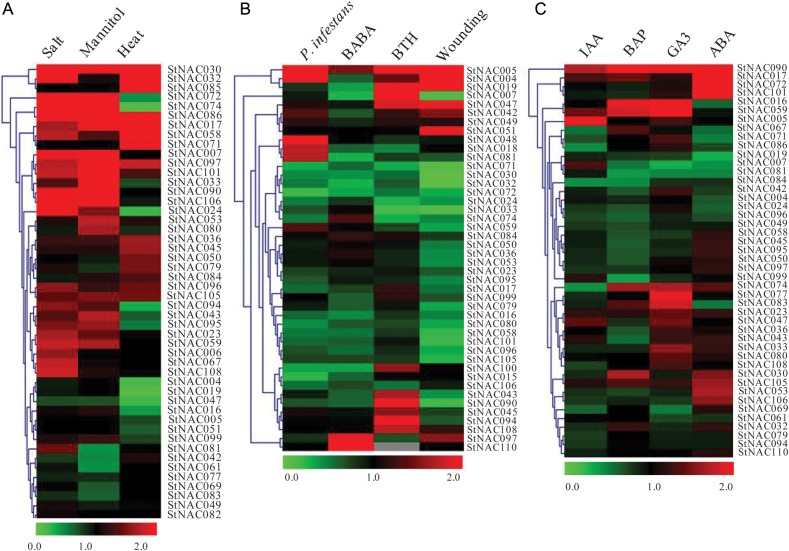
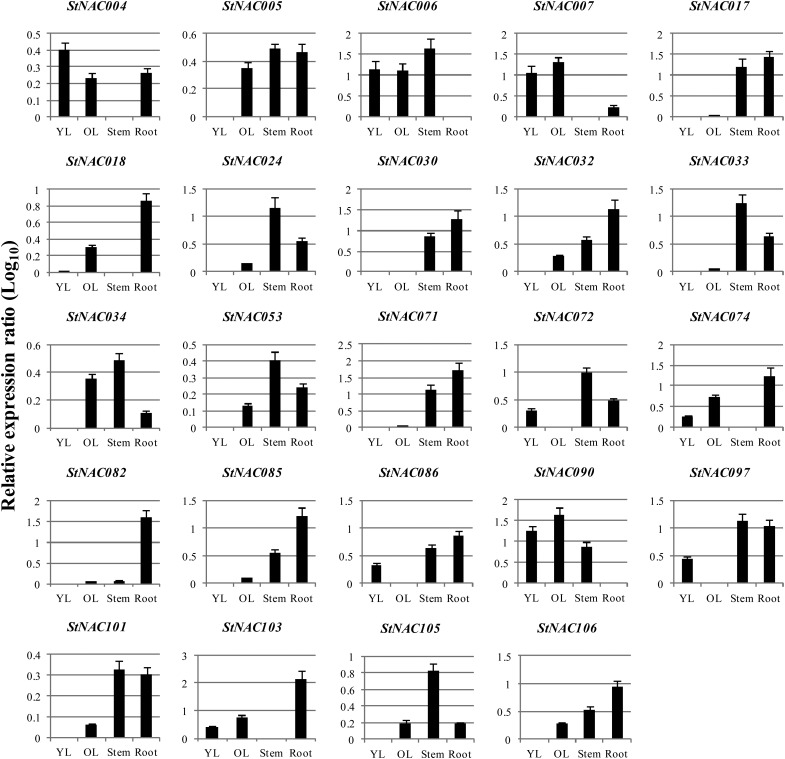
NAC [no apical meristem (NAM), Arabidopsis thaliana transcription activation factor [ATAF1/2] and cup-shaped cotyledon (CUC2)] proteins belong to one of the largest plant-specific transcription factor (TF) families and play important roles in plant development processes, response to biotic and abiotic cues and hormone signalling. Our genome-wide analysis identified 110 StNAC genes in potato encoding for 136 proteins, including 14 membrane-bound TFs. The physical map positions of StNAC genes on 12 potato chromosomes were non-random, and 40 genes were found to be distributed in 16 clusters. The StNAC proteins were phylogenetically clustered into 12 subgroups. Phylogenetic analysis of StNACs along with their Arabidopsis and rice counterparts divided these proteins into 18 subgroups. Our comparative analysis has also identified 36 putative TNAC proteins, which appear to be restricted to Solanaceae family. In silico expression analysis, using Illumina RNA-seq transcriptome data, revealed tissue-specific, biotic, abiotic stress and hormone-responsive expression profile of StNAC genes. Several StNAC genes, including StNAC072 and StNAC101that are orthologs of known stress-responsive Arabidopsis RESPONSIVE TO DEHYDRATION 26 (RD26) were identified as highly abiotic stress responsive. Quantitative real-time polymerase chain reaction analysis largely corroborated the expression profile of StNAC genes as revealed by the RNA-seq data. Taken together, this analysis indicates towards putative functions of several StNAC TFs, which will provide blue-print for their functional characterization and utilization in potato improvement.
Keywords: Illumina RNA-seq; NAC transcription factor; abiotic stress; genome-wide analysis; potato.
Figures

Similar articles
-
Genome-wide characterization and expression profiling of the NAC genes under abiotic stresses in Cucumis sativus.Plant Physiol Biochem. 2017 Apr;113:98-109. doi: 10.1016/j.plaphy.2017.01.023. Epub 2017 Jan 31. Plant Physiol Biochem. 2017. PMID: 28193581
-
Genome-wide identification and expression profiling of the late embryogenesis abundant genes in potato with emphasis on dehydrins.Mol Biol Rep. 2015 Jul;42(7):1163-74. doi: 10.1007/s11033-015-3853-2. Epub 2015 Feb 1. Mol Biol Rep. 2015. PMID: 25638043
-
Genome-wide Identification, Expression Profiling and Evolutionary Analysis of Auxin Response Factor Gene Family in Potato (Solanum tuberosum Group Phureja).Sci Rep. 2019 Feb 11;9(1):1755. doi: 10.1038/s41598-018-37923-7. Sci Rep. 2019. PMID: 30742001 Free PMC article.
-
Characteristics of NAC transcription factors in Solanaceae crops and their roles in responding to abiotic and biotic stresses.Biochem Biophys Res Commun. 2024 May 21;709:149840. doi: 10.1016/j.bbrc.2024.149840. Epub 2024 Mar 28. Biochem Biophys Res Commun. 2024. PMID: 38564941 Review.
-
Regulating the Regulators: The Control of Transcription Factors in Plant Defense Signaling.Int J Mol Sci. 2018 Nov 24;19(12):3737. doi: 10.3390/ijms19123737. Int J Mol Sci. 2018. PMID: 30477211 Free PMC article. Review.
Cited by
-
Overexpression of the Eggplant (Solanum melongena) NAC Family Transcription Factor SmNAC Suppresses Resistance to Bacterial Wilt.Sci Rep. 2016 Aug 16;6:31568. doi: 10.1038/srep31568. Sci Rep. 2016. PMID: 27528282 Free PMC article.
-
Genome-wide evolutionary characterization and expression analysis of SIAMESE-RELATED family genes in maize.BMC Evol Biol. 2020 Jul 29;20(1):91. doi: 10.1186/s12862-020-01619-2. BMC Evol Biol. 2020. PMID: 32727363 Free PMC article.
-
Comparative genomic analysis and phylogeny of NAC25 gene from cultivated and wild Coffea species.Front Plant Sci. 2022 Sep 16;13:1009733. doi: 10.3389/fpls.2022.1009733. eCollection 2022. Front Plant Sci. 2022. PMID: 36186041 Free PMC article.
-
Genome-Wide Identification of 14-3-3 gene family reveals their diverse responses to abiotic stress by interacting with StABI5 in Potato (Solanum tuberosum L.).Front Plant Sci. 2023 Jan 9;13:1090571. doi: 10.3389/fpls.2022.1090571. eCollection 2022. Front Plant Sci. 2023. PMID: 36699847 Free PMC article.
-
Transcript profiling and gene expression analysis under drought stress in Ziziphus nummularia (Burm.f.) Wright & Arn.Mol Biol Rep. 2018 Apr;45(2):163-174. doi: 10.1007/s11033-018-4149-0. Epub 2018 Feb 7. Mol Biol Rep. 2018. PMID: 29417346
References
-
- Papademetriou M.K. Proceedings of the workshop to commemorate the international year of the potato2008; Bangkok, Thailand. Food and Agricultural Organization of the United Nations, Regional Office for Asia and the Pacific; 2008.
-
- Levy D., Veilleux R.E. Adaptation of potato to high temperature and salinity-a review. Am. J. Potato Res. 2007;84:487–506. doi:10.1007/BF02987885. - DOI
-
- Arvin M.J., Donnelly D.J. Screening potato cultivars and wild species to abiotic stresses using a electrolyte leakage bioassay. J. Agric. Sci. Technol. 2008;10:33–42.
-
- Fry W.E. Phytophthora infestans, the crop (and R gene) destroyer. Mol. Plant Pathol. 2008;9:385–402. doi:10.1111/j.1364-3703.2007.00465.x. - DOI - PMC - PubMed
-
- Aida M., Ishida T., Fukaki H., Fujisawa H.,, Tasaka M. Genes involved in organ separation in Arabidopsis: an analysis of the cup-shaped cotyledon mutant. Plant Cell. 1997;9:841–57. doi:10.1105/tpc.9.6.841. - DOI - PMC - PubMed
Publication types
MeSH terms
Substances
LinkOut - more resources
Full Text Sources
Other Literature Sources
Molecular Biology Databases
Miscellaneous
