. 2014 Mar;71(3):990-1001.
doi: 10.1002/mrm.24751.

ESPIRiT--an eigenvalue approach to autocalibrating parallel MRI: where SENSE meets GRAPPA

Affiliations

ESPIRiT--an eigenvalue approach to autocalibrating parallel MRI: where SENSE meets GRAPPA

Martin Uecker et al. Magn Reson Med. 2014 Mar.

Abstract

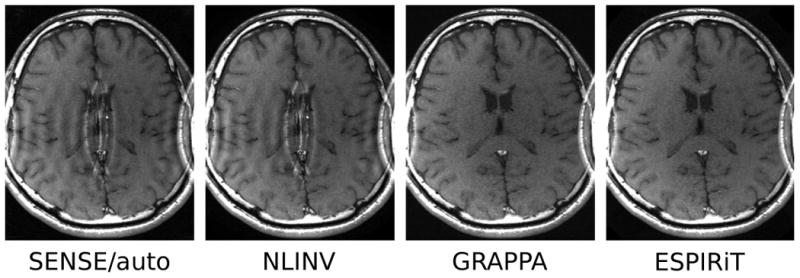
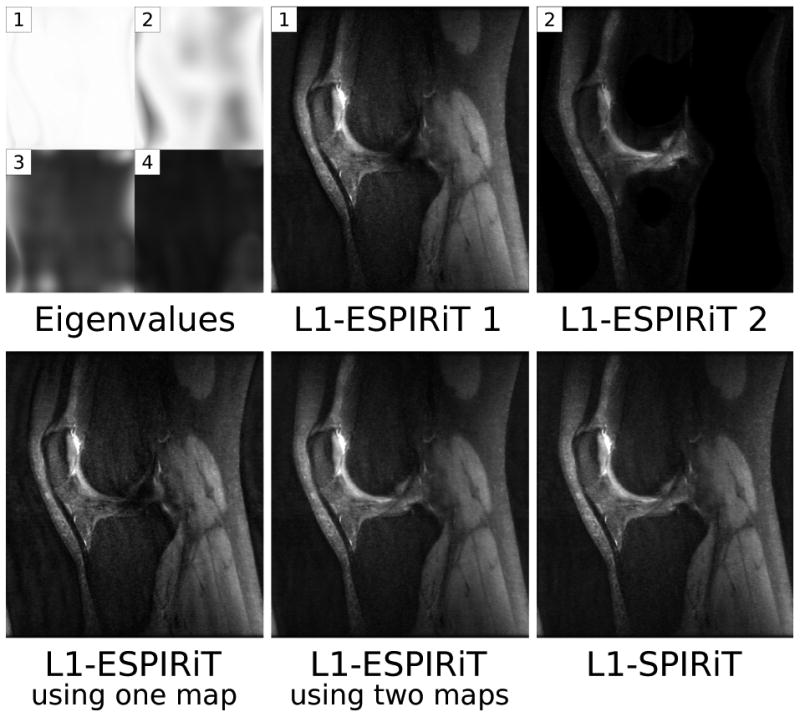
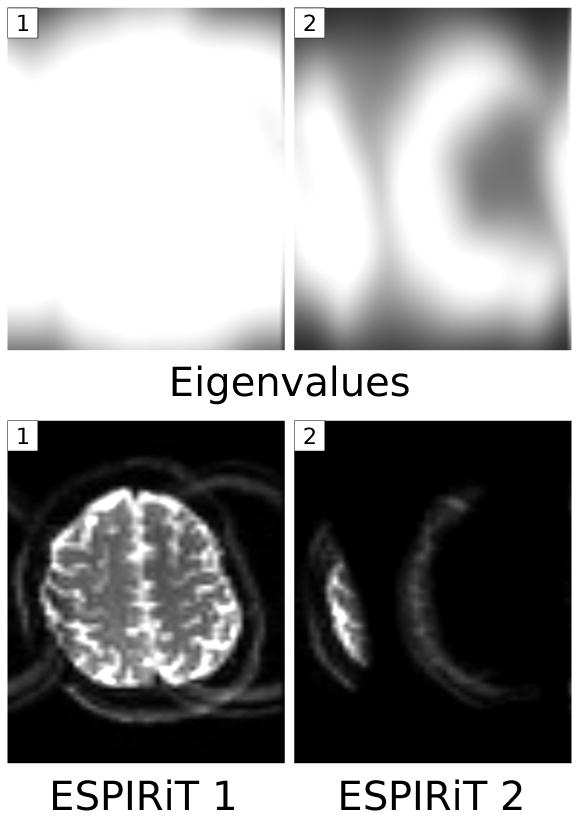
Purpose: Parallel imaging allows the reconstruction of images from undersampled multicoil data. The two main approaches are: SENSE, which explicitly uses coil sensitivities, and GRAPPA, which makes use of learned correlations in k-space. The purpose of this work is to clarify their relationship and to develop and evaluate an improved algorithm.

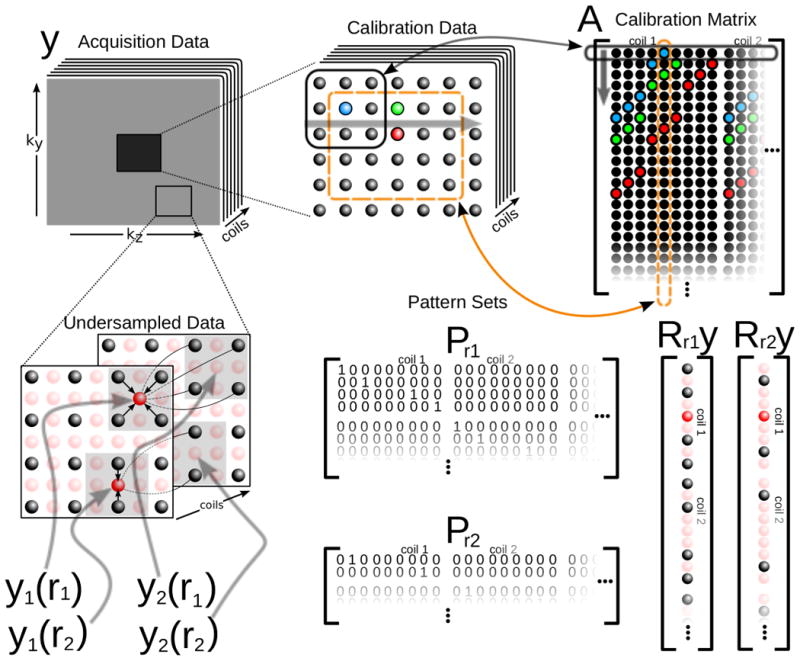
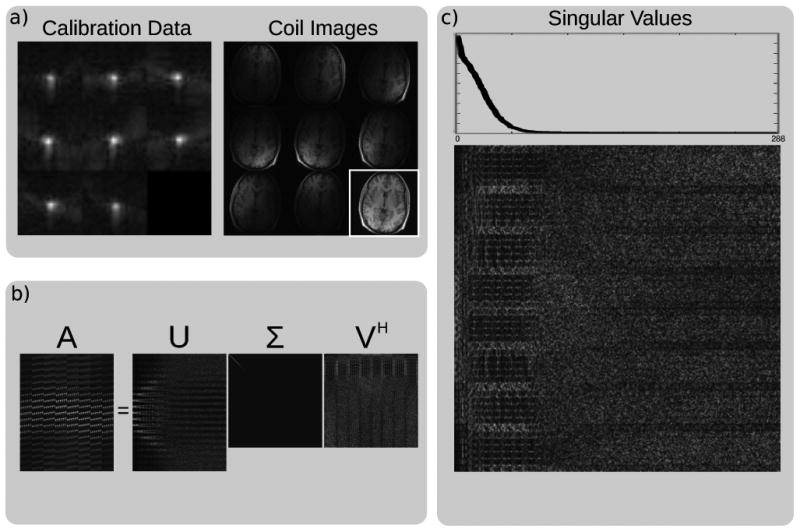
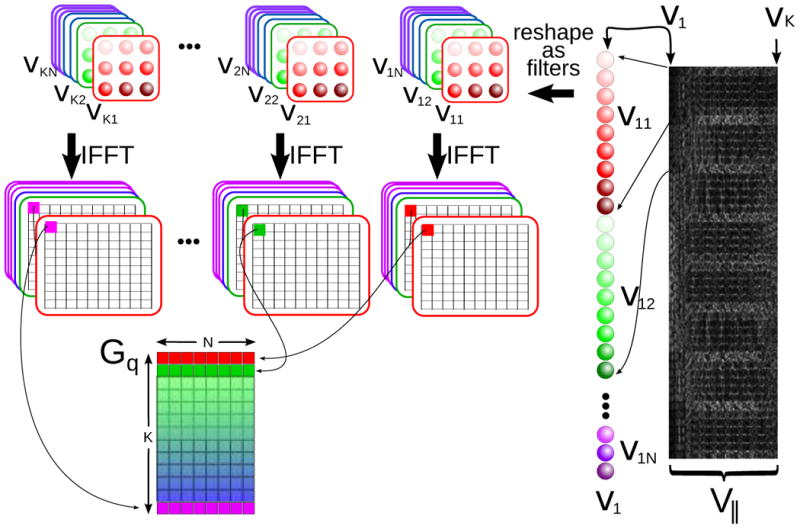
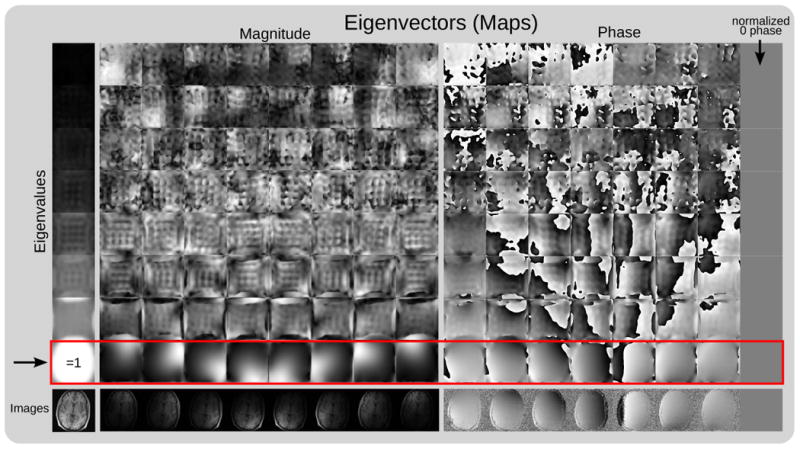
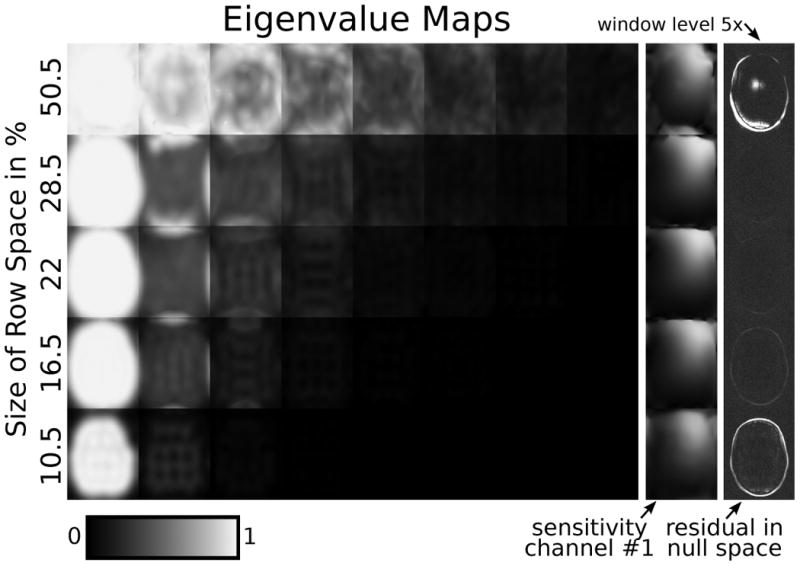
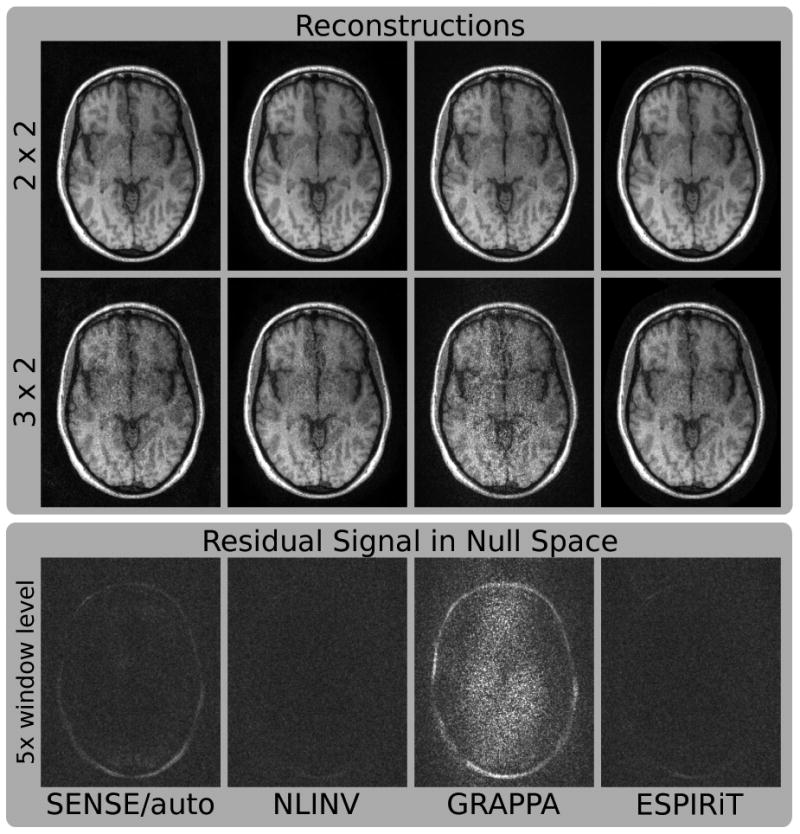
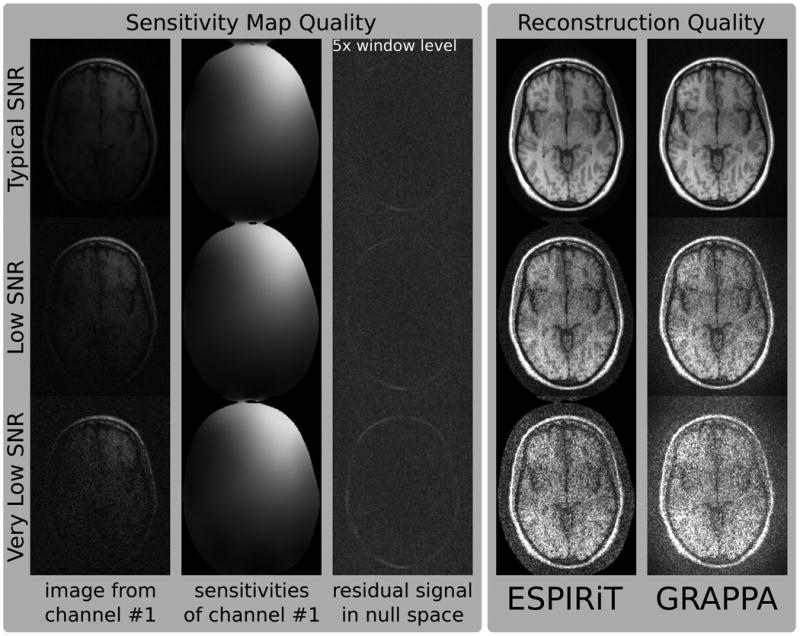
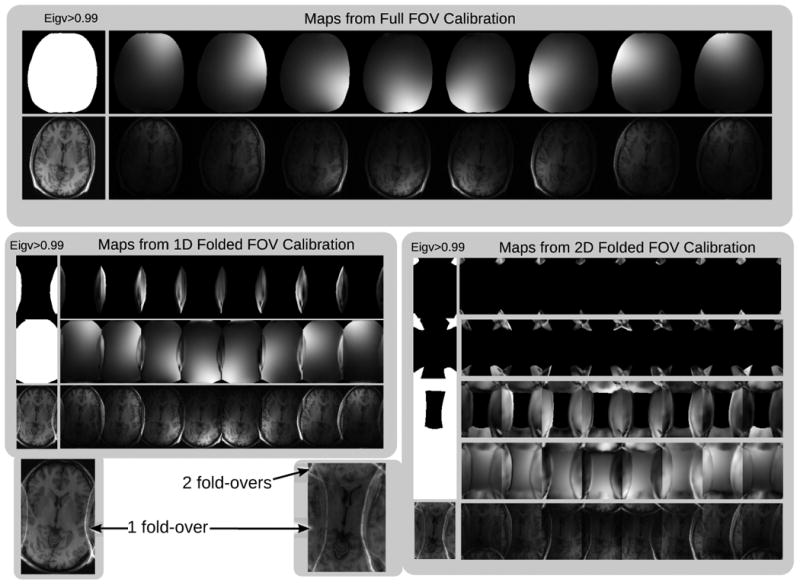
Theory and methods: A theoretical analysis shows: (1) The correlations in k-space are encoded in the null space of a calibration matrix. (2) Both approaches restrict the solution to a subspace spanned by the sensitivities. (3) The sensitivities appear as the main eigenvector of a reconstruction operator computed from the null space. The basic assumptions and the quality of the sensitivity maps are evaluated in experimental examples. The appearance of additional eigenvectors motivates an extended SENSE reconstruction with multiple maps, which is compared to existing methods.

Results: The existence of a null space and the high quality of the extracted sensitivities are confirmed. The extended reconstruction combines all advantages of SENSE with robustness to certain errors similar to GRAPPA.

Conclusion: In this article the gap between both approaches is finally bridged. A new autocalibration technique combines the benefits of both.


Figures

Figure 1
Figure 1
Data organization, indexing and operators that are used in the paper. Top: The calibration matrix A is constructed by sliding a window through the calibration data. The rows of A are overlapping k-space blocks from calibration data. Bottom-left: The indexing used to represent samples in k-space. Bottom-right: Applying Rr extracts a block in k-space and reorders it as a vector. Bottom-middle: Pattern set matrices associated with the k-space positions on the right. Applying PrRry extracts only acquired data from a block in k-space around position r.
Figure 2
Figure 2
Singular value decomposition (SVD) of the calibration matrix. a) Magnitude of the calibration data in k-space and images from an eight-channel head coil. b) Magnitude of the SVD decomposition. The singular values are ordered by magnitude and appear on the diagonal of Σ. c) A zoomed view of the V matrix of the SVD and a plot of the singular vectors show that the calibration matrix has a null space. The k-space signal has support in V and none in V.
Figure 3
Figure 3
The construction of the 𝒢q matrices in Equation [14] is an efficient way to calculate the eigenvalues and vectors of 𝒲. Each basis vector in V is reshaped (and flipped) into a convolution kernel in k-space. The convolutions can be efficiently implemented as multiplications in image space, resulting in separable K × N matrix multiplications Gq for each image-space position, where K is the number of kernels in V (the rank of the calibration matrix A). Then Gq=GqHGq.
Figure 4
Figure 4
Explicit sensitivity maps from autocalibration data using eigenvalue decomposition: The figure shows the eigenvalues and eigenvectors of all 𝒢q in a map. 𝒢q has been computed as the Fourier transform of the reconstruction operator 𝒲 for data from an eight-channel head-coil using a 24 × 24 k-space calibration region and 6 × 6 kernel size. Left: Eigenvalues sorted in increasing magnitude from top to bottom. Eigenvalues ‘=1’ appear in positions where there is signal in the image. Right: Magnitude and phase of the eigenvector maps for each eigenvalue at all spatial positions. As expected, eigenvectors corresponding to eigenvalues ‘=1’ appear to be sensitivity maps. The magnitude and phase of the sensitivities follows closely the magnitude and phase of the individual coil images (bottom row). The eigenvectors are defined only up to multiplication with an arbitrary complex number. For this reason, the norm of the eigenvectors at each location are normalized to one and the 8th channel is used as a reference with zero phase.
Figure 5
Figure 5
Eigenvalue maps computed when using a different number of kernels to estimate the row space V of the calibration matrix A (rows). The percentages with respect to the total number of kernels are shown, corresponding to 101, 57, 44, 33, 21 kernels out of 200. The rightmost column shows a projection of fully-sampled coil images onto the null space as approximated by the sensitivities using Equation [20] (scaled by a factor 5 compared to the corresponding anatomical images in the following figures). If this projection contains residual energy in addition to noise, this indicates errors in the calibration.
Figure 6
Figure 6
Images of a human brain. Fully-sampled data from an eight-channel coil has been retrospectively undersampled by factors of 2 × 2 and 3 × 2. Reconstruction has been performed using SENSE with autocalibration (SENSE/auto), nonlinear inversion (NLINV), GRAPPA, and ESPIRiT. The projection of fully-sampled individual coil images onto the null space has been computed for all methods and combined to a single image scaled by a factor of 5 (bottom row). For GRAPPA, the projection corresponds to a reconstruction operator corresponding to a regular 2 × 3 undersampling pattern. If the null space contains residual energy in addition to noise, this indicates errors in the calibration.
Figure 7
Figure 7
The effect of noise on the calibration of the sensitivity maps has been studied by adding noise to fully-sampled data (noise levels: 1×, 10×, 20×). 1st column: Fully-sampled images corresponding to the first channel for different noise levels. 2nd column: Sensitivity map of the first channel as estimated using the ESPIRiT calibration. 3rd column: The projection of the fully-sampled original data onto the nullspace defined by the sensitivities (scaled by a factor of 5). 4th and 5th column: Reconstruction results for ESPIRiT and GRAPPA for 2 × 2 undersampling.
Figure 8
Figure 8
The effect of reduced FOV of the calibration lines. Top: When the supported FOV of the calibration covers the entire image, there is a single eigenvalue ‘=1’ at each spatial position and a single set of sensitivity maps. Bottom: When the the supported FOV of the calibration is smaller than the image, there are multiple eigenvalues ‘=1’ at positions that exhibit folding. For each eigenvalue ‘=1’ there is an associated set of sensitivity maps that is needed to faithfully represent the data. GRAPPA-like autocalibration methods implicitly use all the sensitivities with eigenvalues ‘=1’ and are not prone to the FOV limitation that is described in [14]. The eigenvalue approach is a tool to find these sensitivities explicitly. These sensitivities can be used in a SENSE-like ESPIRiT reconstruction that exhibits the same robustness to the calibration FOV as autocalibrating methods.
Figure 9
Figure 9
Reconstruction from two-fold undersamed data acquired with a FOV smaller than the object. In this case, a single set of sensitivity maps on the restricted FOV cannot represent the signal correctly. Direct calibration and nonlinear inversion cannot recover the sensitivities, and the corresponing reconstructed images have a severe artifact in the center of the image (SENSE/auto and NLINV). GRAPPA and ESPIRiT are able to reconstruct the center of the image correctly.
Figure 10
Figure 10
A single sagittal section from a motion-corrupted 3D scan of a human knee (readout direction: superior-inferior). Additional eigenvalues appear and the reconstruction with two sets of sensitivity maps yields two images (top). When restricting the 1-ESPIRiT reconstruction to use only one set of maps, the signal corresponding to the second component is lost and additional artifacts appear. The combined image from 1-ESPIRiT using two maps and the image reconstructed with 1-SPIRIT do not suffer from this problem (bottom).
Figure 11
Figure 11
Single-shot EPI of the human brain without fat suppression. The signals of water and shifted fat are not compatible with a single sensitivity map, and the maps of the two highest eigenvalues show that an additional eigenvalue appears in affected locations (top). An ESPIRiT reconstruction using two sets of sensitivity maps yields two separate images (bottom).

References

    1. Ra JB, Rim CY. Fast imaging using subencoding data sets from multiple detectors. Magn Reson Med. 1993;30:142–145. - PubMed
    1. Pruessmann KP, Weiger M, Scheidegger MB, Boesiger P. SENSE: Sensitivity encoding for fast MRI. Magn Reson Med. 1999;42:952–962. - PubMed
    1. Griswold MA, Jakob PM, Heidemann RM, Nittka M, Jellus V, Wang J, Kiefer B, Haase A. Generalized autocalibrating partially parallel acquisitions (GRAPPA) Magn Reson Med. 2002;47:1202–1210. - PubMed
    1. Lustig M, Pauly JM. SPIRIT: Iterative self-consistent parallel imaging reconstruction from arbitrary k-space. Magn Reson Med. 2010;64:457–471. - PMC - PubMed
    1. Pruessmann KP, Weiger M, Börnert P, Boesiger P. Advances in sensitivity encoding with arbitrary k-space trajectories. Magn Reson Med. 2001;46:638–651. - PubMed

Publication types

MeSH terms