. 2013 Jun 15;73(12):3783-95.
doi: 10.1158/0008-5472.CAN-12-4265. Epub 2013 May 6.

GDNF-RET signaling in ER-positive breast cancers is a key determinant of response and resistance to aromatase inhibitors

Affiliations

GDNF-RET signaling in ER-positive breast cancers is a key determinant of response and resistance to aromatase inhibitors

Andrea Morandi et al. Cancer Res. .

Abstract

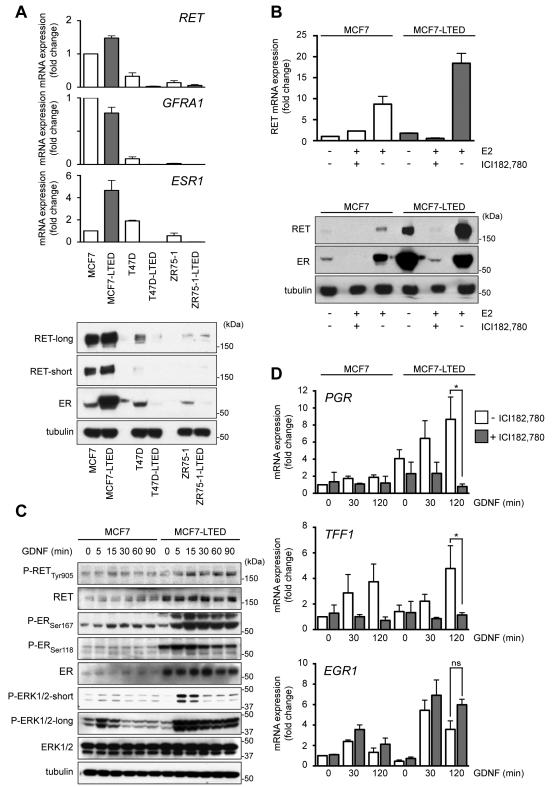
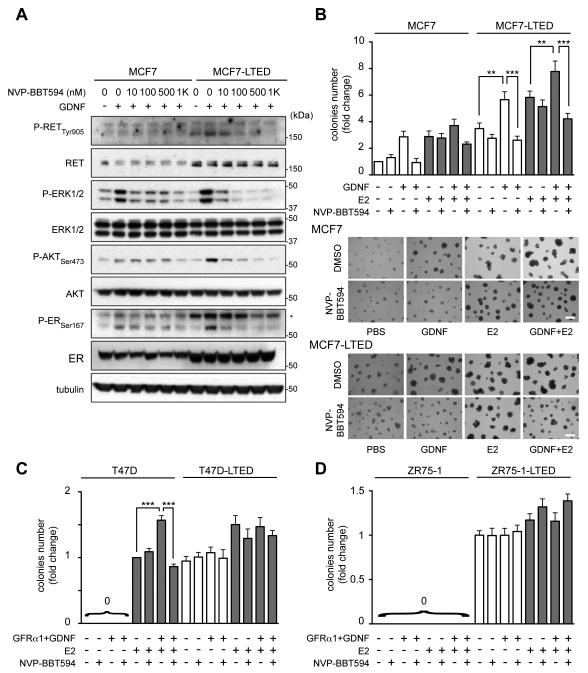
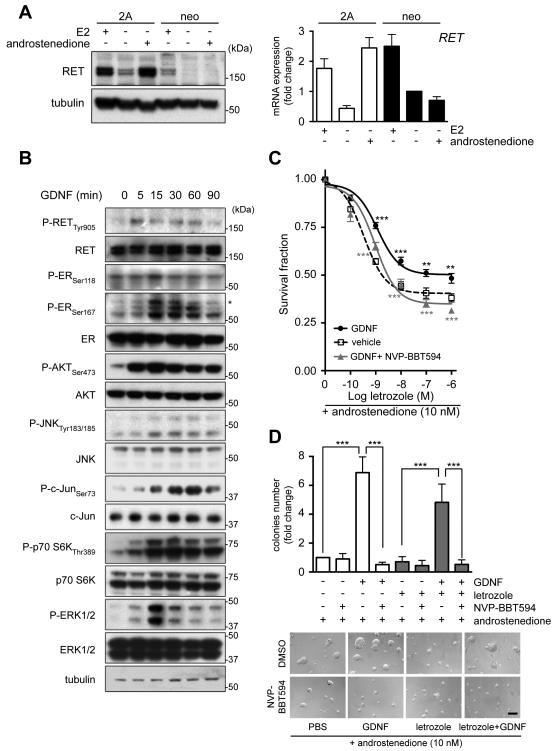
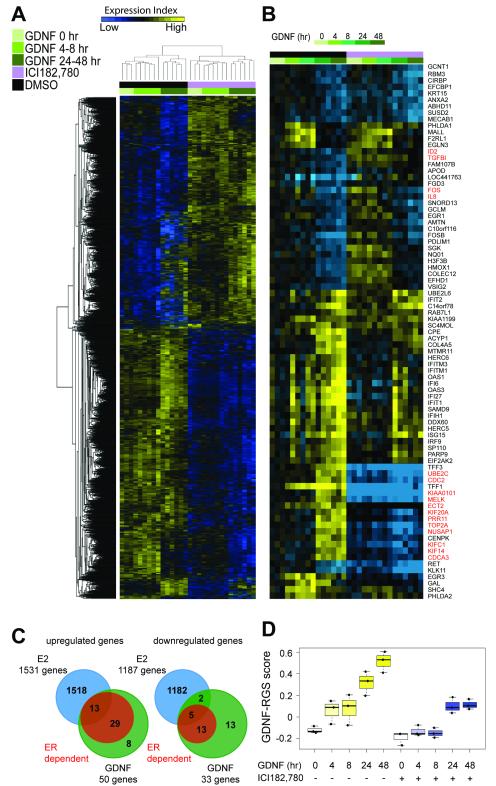
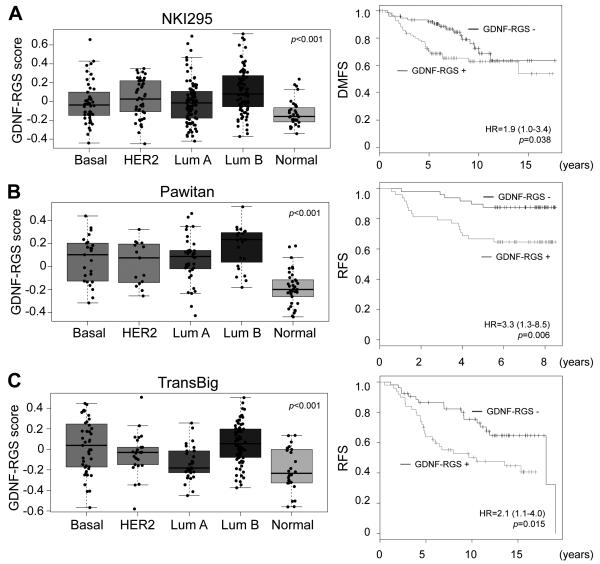
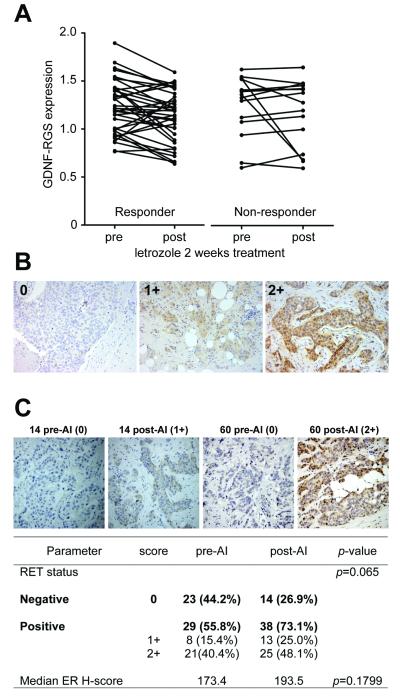
Most breast cancers at diagnosis are estrogen receptor-positive (ER(+)) and depend on estrogen for growth and survival. Blocking estrogen biosynthesis by aromatase inhibitors has therefore become a first-line endocrine therapy for postmenopausal women with ER(+) breast cancers. Despite providing substantial improvements in patient outcome, aromatase inhibitor resistance remains a major clinical challenge. The receptor tyrosine kinase, RET, and its coreceptor, GFRα1, are upregulated in a subset of ER(+) breast cancers, and the RET ligand, glial-derived neurotrophic factor (GDNF) is upregulated by inflammatory cytokines. Here, we report the findings of a multidisciplinary strategy to address the impact of GDNF-RET signaling in the response to aromatase inhibitor treatment. In breast cancer cells in two-dimensional and three-dimensional culture, GDNF-mediated RET signaling is enhanced in a model of aromatase inhibitor resistance. Furthermore, GDNF-RET signaling promoted the survival of aromatase inhibitor-resistant cells and elicited resistance in aromatase inhibitor-sensitive cells. Both these effects were selectively reverted by the RET kinase inhibitor, NVP-BBT594. Gene expression profiling in ER(+) cancers defined a proliferation-independent GDNF response signature that prognosed poor patient outcome and, more importantly, predicted poor response to aromatase inhibitor treatment with the development of resistance. We validated these findings by showing increased RET protein expression levels in an independent cohort of aromatase inhibitor-resistant patient specimens. Together, our results establish GDNF-RET signaling as a rational therapeutic target to combat or delay the onset of aromatase inhibitor resistance in breast cancer.


Figures

Figure 1
Figure 1
Differential response to long-term E2 deprivation in ER+ breast cancer cells. A, top panel, qRT-PCR analysis for RET (n=4), GFRA1 (n=3) and ESR1 (n=3) in MCF7, T47D and ZR75-1 parental cells and their LTED derivatives. Data represent mean±SEM. Bottom panel, immunoblotting of total cell protein extracts. High and low exposures with RET antibody are shown. B, 3 day E2-deprived MCF7 and MCF7-LTED cells were serum-starved overnight and cultured for further 48 hours (top panel) or 96 hours (bottom panel) ± 10 pM E2 ± 100 nM ICI182,780. qRT-PCR analysis for RET (n=3). Data represents mean±SEM. C, 3 day E2-deprived MCF7 and MCF7-LTED cells were serum-starved overnight and stimulated with 20 ng/ml GDNF. D, 3 day E2-deprived MCF7 and MCF7-LTED cells were serum-starved overnight ± 1 μM ICI182,780 and stimulated with 20 ng/ml GDNF. qRT-PCR analysis for PGR (n=3), EGR1 (n=4), TFF1 (n=3). Data represent mean±SEM. Two-way ANOVA, Tukey-corrected, *p<0.05.
Figure 2
Figure 2
NVP-BBT594 impairs GDNF-RET signaling and GDNF-dependent growth in LTED cells that retain RET and ER expression. A, 3 day E2-deprived MCF7 and MCF7-LTED cells were serum-starved overnight and treated with NVP-BBT594 for 90 min followed by stimulation ± 20 ng/ml GDNF for 30 min. B-D, MCF7, T47D and ZR75.1 cells and LTED derivatives were plated on Matrigel ± GDNF (20 ng/ml), GFRα1 (100 ng/ml), NVP-BBT594 (100 nM) vehicle (DMSO) and E2 (10 pM). Colonies >200 μm in diameter was counted at day 7. Data represent the mean fold increase over control cells ± SEM, n=4. Data indicated as 0 denotes no colony growth. One-way ANOVA, Tukey-corrected, ** p<0.01, ***p<0.001. Representative images are shown. Scale bar, 400 μm.
Figure 3
Figure 3
NVP-BBT594 targets GDNF-RET signaling and sensitizes MCF7-2A cells to letrozole treatment. A, MCF7-2A or MCF7-neo cells were E2-deprived for 3 days with addition of 1 nM E2 or 10 nM androstenedione for the last 24 hours. Left panel, total cell protein extracts were subject to western blotting. Right panel, qRT-PCR analysis for RET (n=3). Data represents mean±SEM. B, MCF7-2A cells were E2-deprived for 3 days, serum-starved overnight and stimulated with 20 ng/ml GDNF. C, MCF7-2A cells in 2D culture were E2-deprived for 3 days and then cultured in the presence of 10 nM androstenedione in the presence of vehicle, 20 ng/ml GDNF or 20 ng/ml GDNF plus 100 nM NVP-BBT594 with the indicated concentration of letrozole for 6 days. Data represent mean survival fraction±SEM, n=3. Two-way ANOVA, Bonferroni-corrected, **p<0.01, ***p<0.001. Grey and black asterisks referred to statistical test between GDNF and GDNF+NVP-BBT594 and between untreated and GDNF treated samples, respectively. D, MCF7-2A cells were cultured on Matrigel in the presence of 10 nM androstenedione ± GDNF (20 ng/ml), NVP-BBT594 (100 nM), vehicle (DMSO) or letrozole (10 nM). Colonies >200 μm in diameter were counted at day 7. Data represent mean fold increase over control cells±SEM, n=3. One-way ANOVA, Bonferroni-corrected, ***p<0.001. Representative images are shown. Scale bar, 200 μm.
Figure 4
Figure 4
Identification of a GDNF transcriptional program in breast cancer cells. A, unsupervised hierarchical clustering of RNA transcripts in E2-deprived MCF7 cells treated with GDNF for 0, 4, 8, 24, and 48 hours ± ICI182,780 in three independent experiments. B, gene cluster analysis performed for the 83 genes significantly regulated by GDNF with a CS ≥11. In red are highlighted the 16 proliferation related genes removed to generate the 67 gene GDNF-response gene set (GDNF-RGS) (see Supplementary Fig. S4) C, comparison of genes upregulated (left) and downregulated (right) in E2-treated MCF7 cells (data from (25)) with genes regulated by GDNF in the absence of ICI182,780 (GDNF) and GDNF in the presence of ICI182,780 (ER-dependent). D, time course of GDNF-RGS score of the samples subject to gene expression profiling. Box and whisker plots represent median, 25 and 75 percentile values. Dots represent the three independent experiments.
Figure 5
Figure 5
GDNF-RGS correlates with the luminal B phenotype and poor prognosis in human breast cancers. A-C, left panels, box and whisker plots of GDNF-RGS scores by tumor subtype in the NKI295, Pawitan and TransBig datasets, respectively, showing significantly (one-way ANOVA, p<0.001) higher scores in luminal B breast cancer subgroup. Right panels, Kaplan-Meier analyses of the ER+ cases stratified by GDNF-RGS. Likelihood ratio test p-value and hazard ratio (HR) with 95% confidence interval are shown.
Figure 6
Figure 6
Correlation of GDNF-RGS and RET expression with response to aromatase inhibitors. A, changes in GDNF-RGS in 52 paired ER+ breast cancer samples pre- and post-2 week letrozole treatment (20). Responder patients (n=37) show a significant (Wilcoxon test, p=0.009) decrease in GDNF-RGS score. No significant change in GDNF-RGS was observed in the non-responder group (n=15). B, RET immunohistochemical staining of invasive breast cancers. Representative images of tumors scored as negative (0), moderate RET expression (1+) and strong RET expression (2+) are shown. C, RET expression was assessed in 52 paired primary tumor samples pre-aromatase inhibitor treatment (pre-AI) and recurrent/metastatic tumors following adjuvant AI treatment (post-AI) (37). Representative images of tumors pre-AI and post-AI are shown. Chi-square p-value for RET and paired t-test value for ER H-score (see Supplementary Fig. S8) is shown.

References

    1. Forbes JF, Cuzick J, Buzdar A, Howell A, Tobias JS, Baum M. Effect of anastrozole and tamoxifen as adjuvant treatment for early-stage breast cancer: 100-month analysis of the ATAC trial. Lancet Oncol. 2008;9:45–53. - PubMed
    1. Winer EP, Hudis C, Burstein HJ, Wolff AC, Pritchard KI, Ingle JN, et al. American Society of Clinical Oncology technology assessment on the use of aromatase inhibitors as adjuvant therapy for postmenopausal women with hormone receptor-positive breast cancer: status report 2004. J Clin Oncol. 2005;23:619–29. - PubMed
    1. Arpino G, Wiechmann L, Osborne CK, Schiff R. Crosstalk between the estrogen receptor and the HER tyrosine kinase receptor family: molecular mechanism and clinical implications for endocrine therapy resistance. Endocr Rev. 2008;29:217–33. - PMC - PubMed
    1. Martin LA, Farmer I, Johnston SR, Ali S, Marshall C, Dowsett M. Enhanced estrogen receptor (ER) alpha, ERBB2, and MAPK signal transduction pathways operate during the adaptation of MCF-7 cells to long term estrogen deprivation. J Biol Chem. 2003;278:30458–68. - PubMed
    1. Martin LA, Pancholi S, Chan CM, Farmer I, Kimberley C, Dowsett M, et al. The anti-oestrogen ICI 182,780, but not tamoxifen, inhibits the growth of MCF-7 breast cancer cells refractory to long-term oestrogen deprivation through down-regulation of oestrogen receptor and IGF signalling. Endocr Relat Cancer. 2005;12:1017–36. - PubMed

Publication types

MeSH terms