. 2013 May 21;110(21):8417-21.
doi: 10.1073/pnas.1306825110. Epub 2013 May 6.

Fluorescence thermometry enhanced by the quantum coherence of single spins in diamond

Affiliations

Fluorescence thermometry enhanced by the quantum coherence of single spins in diamond

David M Toyli et al. Proc Natl Acad Sci U S A. .

Abstract

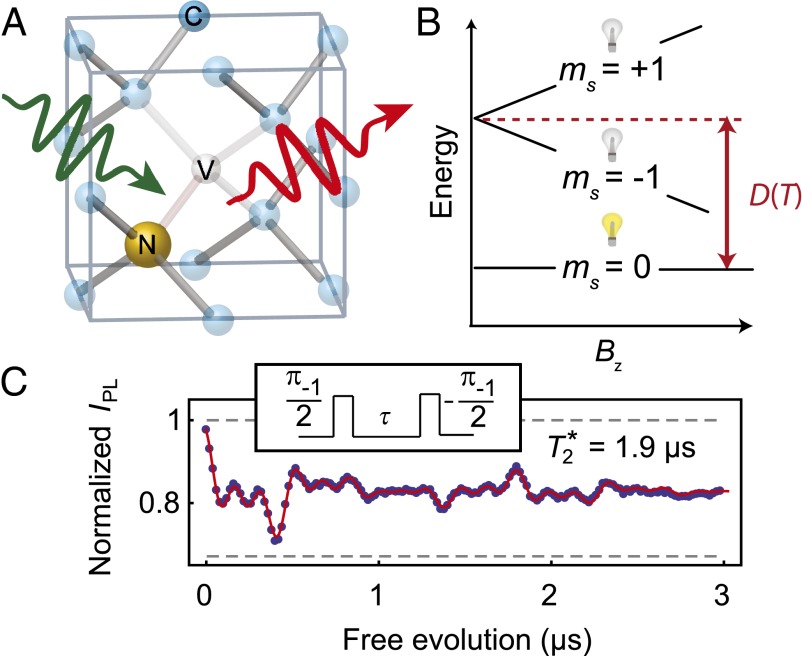
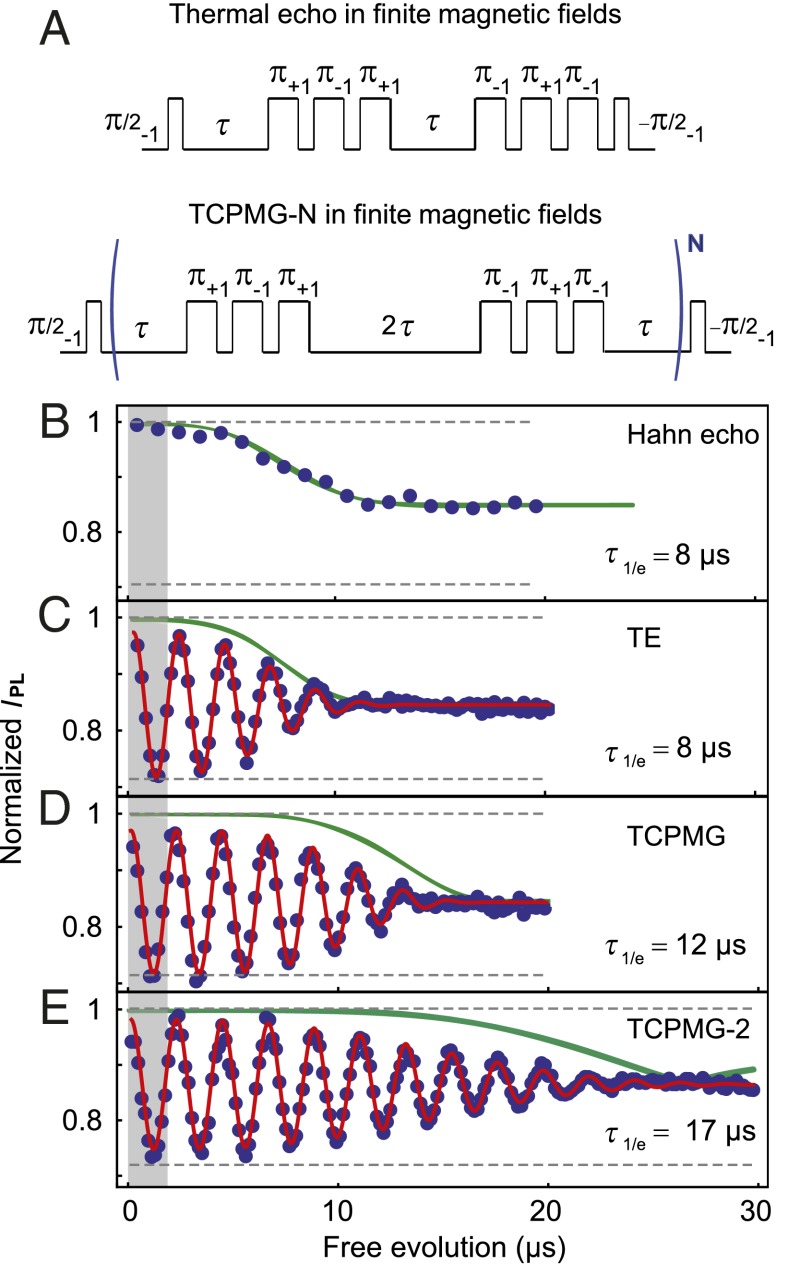
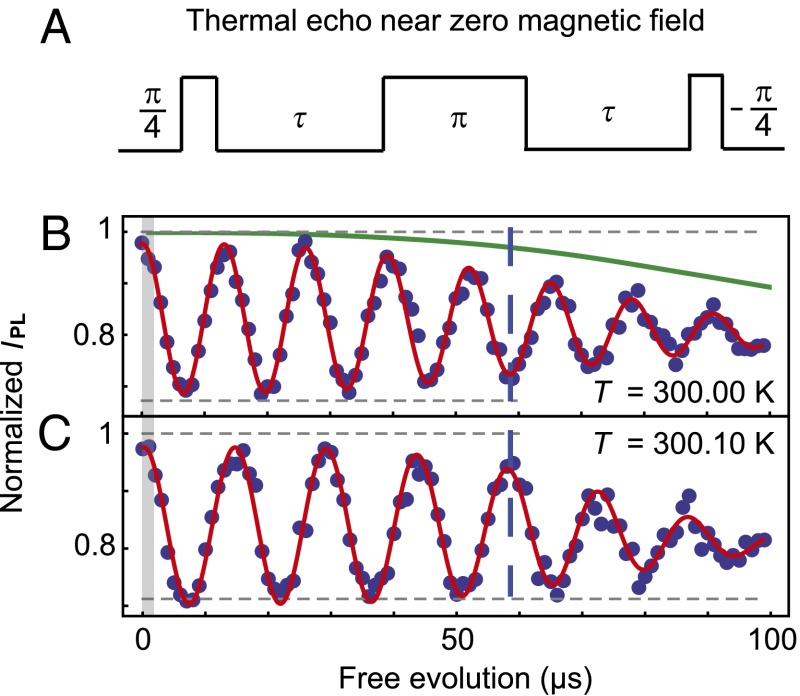
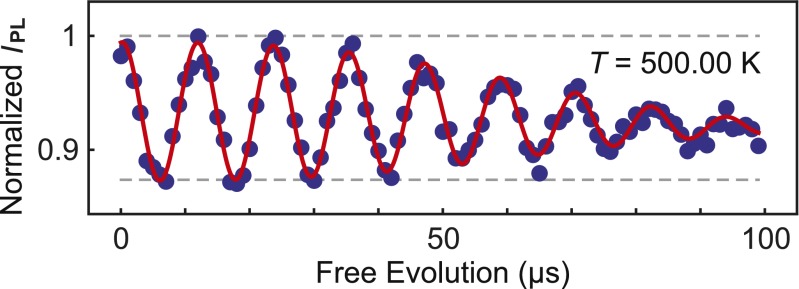
We demonstrate fluorescence thermometry techniques with sensitivities approaching 10 mK · Hz(-1/2) based on the spin-dependent photoluminescence of nitrogen vacancy (NV) centers in diamond. These techniques use dynamical decoupling protocols to convert thermally induced shifts in the NV center's spin resonance frequencies into large changes in its fluorescence. By mitigating interactions with nearby nuclear spins and facilitating selective thermal measurements, these protocols enhance the spin coherence times accessible for thermometry by 45-fold, corresponding to a 7-fold improvement in the NV center's temperature sensitivity. Moreover, we demonstrate these techniques can be applied over a broad temperature range and in both finite and near-zero magnetic field environments. This versatility suggests that the quantum coherence of single spins could be practically leveraged for sensitive thermometry in a wide variety of biological and microscale systems.

Keywords: electron spin resonance; quantum control; spintronics.


Conflict of interest statement

The authors declare no conflict of interest.

Figures

Fig. 1.
Fig. 1.
Nitrogen vacancy center in diamond. (A) Depiction of a nitrogen vacancy (NV) center in the diamond lattice. The wavy green arrow represents the 532-nm laser used for optical excitation and the wavy red arrow represents the phonon-broadened fluorescence used to measure the spin state. (B) Fine structure of the NV center ground state as a function of axial magnetic field. The light bulbs represent the relative fluorescence difference for the mS = 0 and mS = ±1 states. Temperature changes shift the crystal field splitting (D), whereas magnetic fields (Bz) split the mS = ±1 sublevels. This difference enables dynamical decoupling pulse sequences that move the spin between all three states to selectively measure temperature shifts and mitigate magnetic noise. (C) Ramsey measurement performed on the mS = 0 to mS = −1 transition (Bz = 40 G). Inset illustrates the pulse sequence. The short inhomogeneous spin lifetime (T2*) limits the sensitivity of conventional NV center thermometry. The uncertainties in IPL, estimated from the photon shot noise, are ∼0.003. The microwave carrier frequency was detuned from the mI = 0 hyperfine resonance by ∼3.5 MHz to induce oscillations in IPL. The fluorescence signal exhibits a beating caused by the three hyperfine resonances and weak coupling to a nearby 13C spin. Gray dashed lines show the fluorescence intensity of mS = 0 and mS = −1 as determined by independent measurements.
Fig. 2.
Fig. 2.
Thermal echo (TE) and thermal CPMG-N (TCPMG-N) pulse sequences in finite magnetic fields. (A) Diagram showing the pulse sequences. Here a π pulse has a duration such that it will invert the spin population between the two sublevels that are resonantly addressed. The subscripts indicate the spin transition being addressed. (B) Hahn echo measurement (mS = 0 to mS = −1 transition) at Bz = 30 G showing IPL as a function of the free evolution time (2τ for the Hahn echo and TE, 4τ for TCPMG, and 8τ for TCPMG-2). The measurement demonstrates the coherence collapse caused by the incoherent precession of the 13C spin bath. The width of the shaded gray region represents T2*. C, D, and E show TE, TCPMG, and TCPMG-2 measurements, respectively, performed at 297.00 K (SI Appendix). The uncertainties in IPL, estimated from the photon shot noise, are ∼0.005. To induce oscillations in IPL to clearly observe the signal envelope, the average microwave carrier frequency (ΩREF) was detuned from D by ∼0.5 MHz. The solid red lines are best fits to the data and the 1/e decay times (τ1/e) are noted on the plots. The observed coherences are in good agreement with numerical modeling (solid green lines). For the TCPMG-2 sequence the coherence time is ninefold greater than T2*. For these experimental conditions we infer the thermal sensitivity (η) is 54 ± 1 mK⋅Hz−1/2. Enhancements in the photon collection efficiency could improve η to ∼15 mK⋅Hz−1/2 (Methods).
Fig. 3.
Fig. 3.
Thermal echo sequence near zero magnetic field. (A) Diagram showing the thermal echo pulse sequence near zero magnetic field when the frequency separation of the mS = ±1 sublevels is less than the bandwidth of the microwave pulse used to address the transitions (25 MHz). Here a π pulse has a duration such that the spin, initialized into mS = 0, goes through a superposition of the mS = ±1 states and returns to mS = 0 with an opposite sign. (B) Thermal echo measurement at 300.00 K. The microwave carrier frequency (ΩREF, 2.87016 GHz) was detuned from D by ∼75 kHz to induce oscillations in the signal to observe the coherence envelope. The solid green line shows the coherence predicted by the numerical modeling. The width of the shaded gray region represents T2*. (C) The same measurement as in B, but with the sample temperature at 300.10 K. The shift in D results in a pronounced difference in the signal frequency, leading to large IPL differences at long times (dashed blue line). For both measurements τ1/e is ∼85 μs, and the uncertainties in IPL, estimated from the photon shot noise, are ∼0.02. For reference, for these data the measurement time per point was 50 s. From the observed coherence times we infer η = 25 ± 2 mK⋅Hz−1/2 for these experimental conditions; we estimate that enhanced photon collection efficiencies could improve η to ∼7 mK⋅Hz−1/2. The frequency difference for the oscillations in B and C, inferred from the fits, is 8 ± 2 kHz, in good agreement the expected value, ∼7.4 kHz (20).
Fig. 4.
Fig. 4.
A thermal echo measurement performed at 500.00 K. Here ΩREF, 2.84818 GHz, has been adjusted to compensate for the large shift in D such that a detuning of ∼80 kHz is achieved. The uncertainties in IPL, estimated from the photon shot noise, are ∼0.007. The measurement shows a reduced IPL contrast between the spin states, primarily due to an increased fluorescence background on this sample at elevated temperatures. However, the larger thermal shifts in D (−140 kHz/K at 500 K) (ref. 19) largely compensate for this reduction to produce an inferred η of 39 ± 6 mK⋅Hz−1/2 for this measurement. The projected η for enhanced photon collection efficiencies is ∼11 mK⋅Hz−1/2.

References

    1. Grattan LS, Zhang ZY. Fiber Optic Fluorescence Thermometry. London: Chapman & Hall; 1995.
    1. Aizawa H, et al. Characteristics of chromium doped spinel crystals for a fiber-optic thermometer application. Rev Sci Instrum. 2002;73(8):3089–3092.
    1. Brites CDS, et al. Thermometry at the nanoscale. Nanoscale. 2012;4(16):4799–4829. - PubMed
    1. Jaque D, Vetrone F. Luminescence nanothermometry. Nanoscale. 2012;4(15):4301–4326. - PubMed
    1. Walker GW, et al. Quantum-dot optical temperature probes. Appl Phys Lett. 2003;83(17):3555–3557.

Publication types