Clinical Trial
. 2013 May 21;110(21):8644-9.
doi: 10.1073/pnas.1221478110. Epub 2013 May 6.

Mesenchymal glioma stem cells are maintained by activated glycolytic metabolism involving aldehyde dehydrogenase 1A3

Affiliations
Clinical Trial

Mesenchymal glioma stem cells are maintained by activated glycolytic metabolism involving aldehyde dehydrogenase 1A3

Ping Mao et al. Proc Natl Acad Sci U S A. .

Abstract

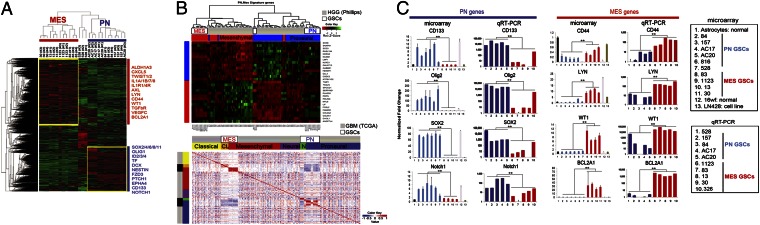
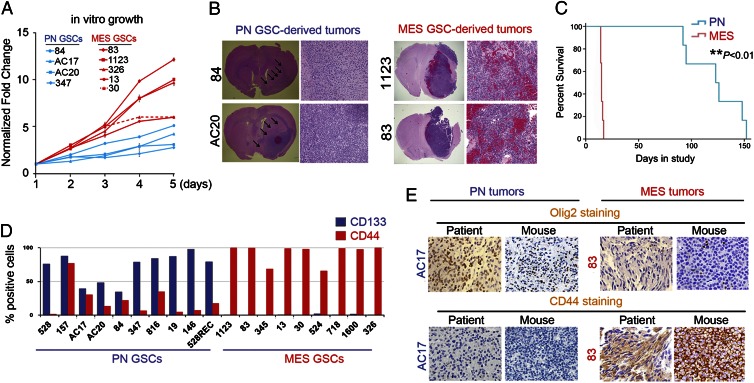
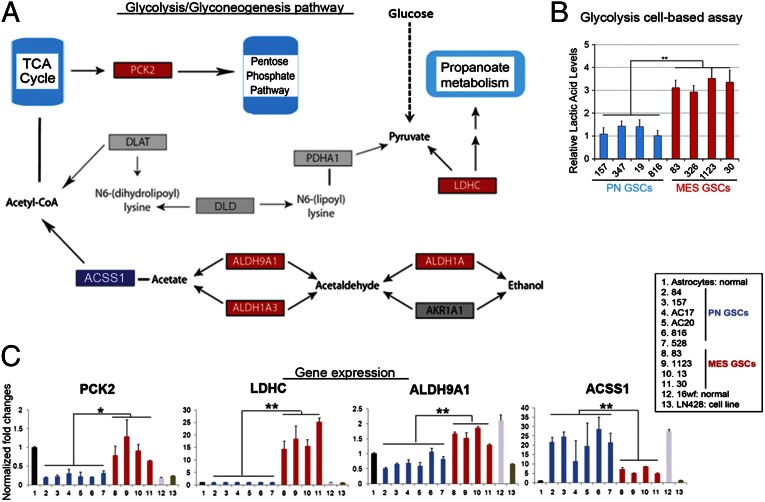
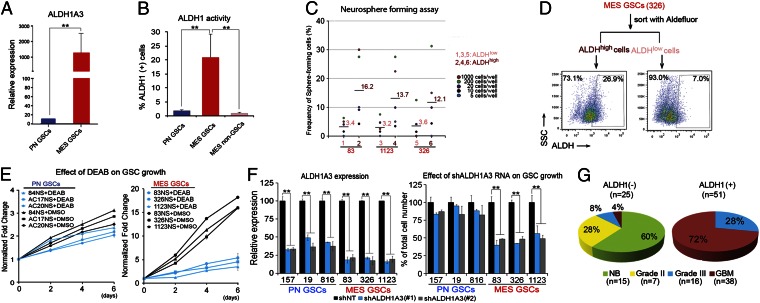
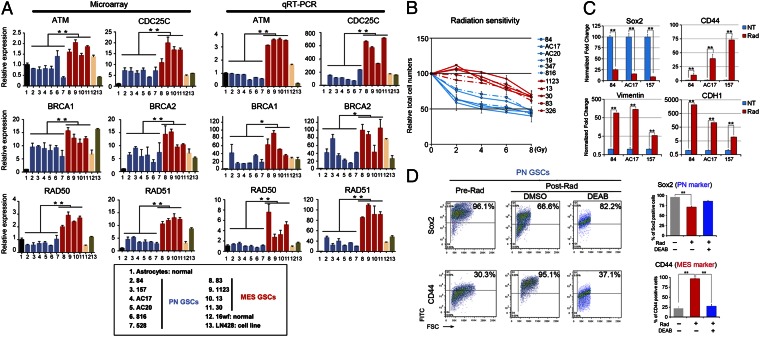
Tumor heterogeneity of high-grade glioma (HGG) is recognized by four clinically relevant subtypes based on core gene signatures. However, molecular signaling in glioma stem cells (GSCs) in individual HGG subtypes is poorly characterized. Here we identified and characterized two mutually exclusive GSC subtypes with distinct dysregulated signaling pathways. Analysis of mRNA profiles distinguished proneural (PN) from mesenchymal (Mes) GSCs and revealed a pronounced correlation with the corresponding PN or Mes HGGs. Mes GSCs displayed more aggressive phenotypes in vitro and as intracranial xenografts in mice. Further, Mes GSCs were markedly resistant to radiation compared with PN GSCs. The glycolytic pathway, comprising aldehyde dehydrogenase (ALDH) family genes and in particular ALDH1A3, were enriched in Mes GSCs. Glycolytic activity and ALDH activity were significantly elevated in Mes GSCs but not in PN GSCs. Expression of ALDH1A3 was also increased in clinical HGG compared with low-grade glioma or normal brain tissue. Moreover, inhibition of ALDH1A3 attenuated the growth of Mes but not PN GSCs. Last, radiation treatment of PN GSCs up-regulated Mes-associated markers and down-regulated PN-associated markers, whereas inhibition of ALDH1A3 attenuated an irradiation-induced gain of Mes identity in PN GSCs. Taken together, our data suggest that two subtypes of GSCs, harboring distinct metabolic signaling pathways, represent intertumoral glioma heterogeneity and highlight previously unidentified roles of ALDH1A3-associated signaling that promotes aberrant proliferation of Mes HGGs and GSCs. Inhibition of ALDH1A3-mediated pathways therefore might provide a promising therapeutic approach for a subset of HGGs with the Mes signature.

Keywords: cancer stem cell; epithelial-to-mesenchymal transition; glioblastoma; glioblastoma multiforme; proneural-to-mesenchymal transition.


Conflict of interest statement

The authors declare no conflict of interest.

Figures

Fig. 1.
Fig. 1.
Microarray analysis of two distinctive GSC samples. (A) Hierarchical biclustering of genes differentially expressed between PN and Mes cell lines. (B) Heat map with pairwise Pearson correlation for the Phillips HGG dataset and TCGA GBM dataset with the microarray samples. Stronger correlation is observed among microarray samples of the same type compared among and with TCGA samples of the same subtype. (C) qRT-PCR and microarray of two GSC subtypes (**P < 0.01). Data are representative of three independent experiments with similar results.
Fig. 2.
Fig. 2.
Phenotypic differences between PN and Mes GSCs. (A) In vitro growth curves of PN GSC samples (n = 4) and Mes GSC samples (n = 5). (B) Representative H&E staining of various mouse brain sections with tumors established by two PN and two Mes GSCs. (C) Kaplan-Meier survival curves of mice bearing PN GSC– and Mes GSC–derived tumors (**P < 0.01). (D) FACS analyses of cell surface expression of CD133 and CD44 in cultured PN (n = 10) and Mes (n = 9) GSCs. (E) Representative images of IHC with the original patient tumors and PN or Mes GSCs–derived mouse intracranial tumors. PN GSCs are Olig2high; CD44-/low, whereas Mes GSCs are Olig2low; CD44high. Data in AE are representative of three independent experiments with similar results.
Fig. 3.
Fig. 3.
Glycolysis pathway as the most differentially activated pathway in Mes GSCs. (A) Glycolytic pathway containing aldehyde dehydrogenase genes (KEGG ID: hsa00010) was significantly enriched in Mes GSCs (P = 0.0001315). Genes in red were differentially expressed between Mes and PN tumors. (B) Elevated glycolytic activity in Mes GSCs (n = 4) compared with PN GSCs (n = 4; **P < 0.01). (C) Difference of expression of individual genes in the glycolytic pathway in PN and Mes GSC samples, normal astrocytes, and neural progenitors (16wf), and the glioma cell line LN486 (LN) (*P < 0.05, **P < 0.01).
Fig. 4.
Fig. 4.
ALDH1A3 is a functional Mes GSC marker. (A) qRT-PCR analysis of ALDH1A3 expression in PN and Mes GSCs (**P < 0.01). (B) FACS analysis using Aldeflour. ALDH activities in PN GSCs (n = 3), Mes GSCs (n = 3), and non-GSCs (n = 3) derived from Mes GSCs (**P < 0.01). (C) Frequency of sphere-forming cells between ALDH1high and ALDH1low Mes GSCs. FACS-sorted based on ALDH expression Mes GSCs were used in the assays (**P < 0.01). (D) FACS reanalysis: ALDH activity after 1-wk postcell sorting of Mes 326 ALDHhigh cells. ALDHhigh Mes GSC spheres generated both ALDHhigh and ALDHlow cells, whereas the majority of ALDHlow sphere cells retain as ALDHlow cells. (E) Effect of an ALDH inhibitor DEAB on cell growth of PN (n = 3) and Mes (n = 3) GSCs. DEAB abrogates the in vitro growth of Mes GSCs but has a marginal effect on PN GSCs. (F) Effect of shALDH1A3 knockdown on growth and ALDH1A3 gene expression of both PN and Mes GSCs. The growth of Mes GSCs is significantly reduced by shRNA-mediated depletion of ALDH1A3 compared with PN GSCs. RNA interference with 2 shALDH1A3 constructs significantly reduced ALDH1A3 expression levels in PN and Mes GSCs (n = 3 each, **P < 0.01). (G) Pie chart indicating the number of samples that were analyzed in different WHO tumor grades of clinical glioma samples or normal brain tissues that are ALDH(+) or (−). Data in AF are representative of three independent experiments with similar results.
Fig. 5.
Fig. 5.
Prominent radioresistance of Mes GSCs and radiation induces transformation of PN GSCs into Mes GSCs. (A) DNA microarray analyses and qRT-PCR validation of DNA damage-repair gene expression in GSCs. Various DNA damage-repair genes are expressed at higher levels in Mes GSCs than that in PN GSCs (*P < 0.05, **P < 0.01). Box: various GSC cells depicted in bar graphs. (B) Effect of radiation treatment on in vitro growth of PN and Mes GSCs (11 samples in total) at indicate doses. (C) Representative PN and Mes gene expressions in PN GSC samples (n = 3) with and without radiation treatment (5 Gy, tested at day 5; **P < 0.01). (D) FACS analyses for Sox2 (PN marker) and CD44 (Mes marker) in PN GSCs (84, AC17, and AC20) pre- and postradiation (5 Gy) at day 5. DEAB (100 μM), a selective inhibitor of ALDH1, partially blocked the changes of expression of the markers (**P < 0.01). Bar graphs: the average of levels of marker expression among 3 PN GSC neurospheres. Data in AD are representative of three independent experiments with similar results.

References

    1. Dunn GP, et al. Emerging insights into the molecular and cellular basis of glioblastoma. Genes Dev. 2012;26(8):756–784. - PMC - PubMed
    1. Adamson C, et al. Glioblastoma multiforme: A review of where we have been and where we are going. Expert Opin Investig Drugs. 2009;18(8):1061–1083. - PubMed
    1. Haar CP, et al. Drug resistance in glioblastoma: A mini review. Neurochem Res. 2012;37(6):1192–1200. - PMC - PubMed
    1. Phillips HS, et al. Molecular subclasses of high-grade glioma predict prognosis, delineate a pattern of disease progression, and resemble stages in neurogenesis. Cancer Cell. 2006;9(3):157–173. - PubMed
    1. Verhaak RG, et al. Cancer Genome Atlas Research Network Integrated genomic analysis identifies clinically relevant subtypes of glioblastoma characterized by abnormalities in PDGFRA, IDH1, EGFR, and NF1. Cancer Cell. 2010;17(1):98–110. - PMC - PubMed

Publication types

MeSH terms

Substances