

Prediction and validation of gene-disease associations using methods inspired by social network analyses
- PMID: 23650495
- PMCID: PMC3641094
- DOI: 10.1371/journal.pone.0058977
Prediction and validation of gene-disease associations using methods inspired by social network analyses
Erratum in
- PLoS One. 2013;8(9). doi:10.1371/annotation/5aeb88a0-1630-4a07-bb49-32cb5d617af1
Abstract
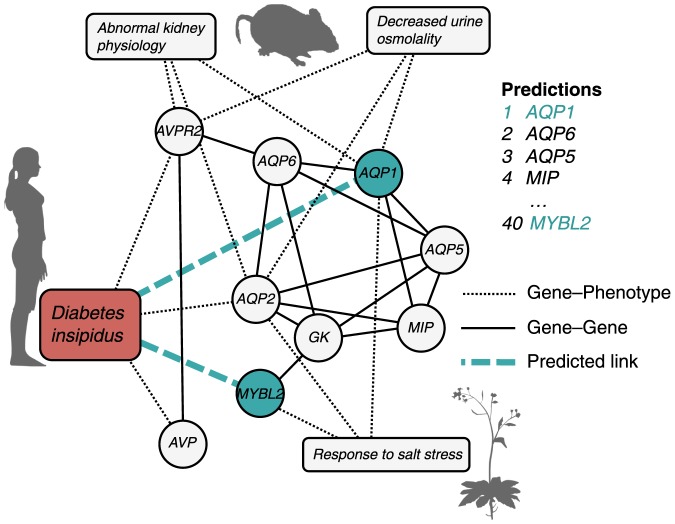
Correctly identifying associations of genes with diseases has long been a goal in biology. With the emergence of large-scale gene-phenotype association datasets in biology, we can leverage statistical and machine learning methods to help us achieve this goal. In this paper, we present two methods for predicting gene-disease associations based on functional gene associations and gene-phenotype associations in model organisms. The first method, the Katz measure, is motivated from its success in social network link prediction, and is very closely related to some of the recent methods proposed for gene-disease association inference. The second method, called Catapult (Combining dATa Across species using Positive-Unlabeled Learning Techniques), is a supervised machine learning method that uses a biased support vector machine where the features are derived from walks in a heterogeneous gene-trait network. We study the performance of the proposed methods and related state-of-the-art methods using two different evaluation strategies, on two distinct data sets, namely OMIM phenotypes and drug-target interactions. Finally, by measuring the performance of the methods using two different evaluation strategies, we show that even though both methods perform very well, the Katz measure is better at identifying associations between traits and poorly studied genes, whereas Catapult is better suited to correctly identifying gene-trait associations overall [corrected].
Conflict of interest statement
Figures
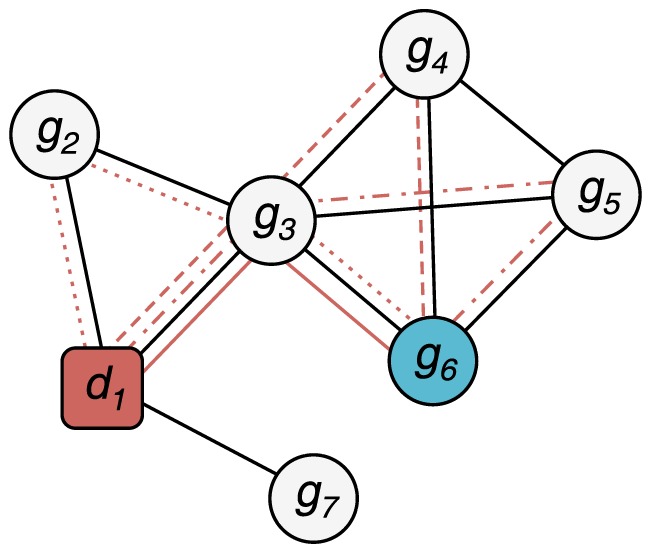
 is connected to the gene node
  by one walk of length 2 (solid red line) and three walks of length 3 (dotted, dashed and dashdotted red lines). This can be quickly calculated from the adjacency matrix
  of the graph: If
  when there is a link between nodes
  and
and  , and
, and  otherwise, the number of paths of length
  between genes
  and
and  is
is  . In the example above,
  and
and  .
.
 predictions for a disease. Katz and C
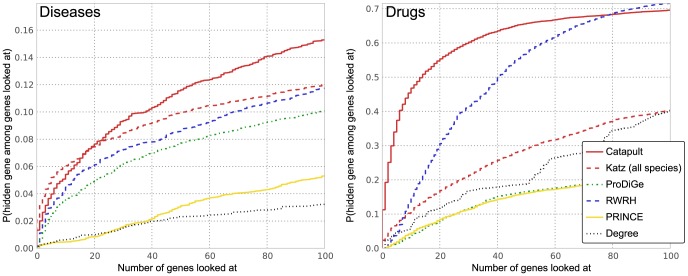
 predictions for a disease. Katz and C
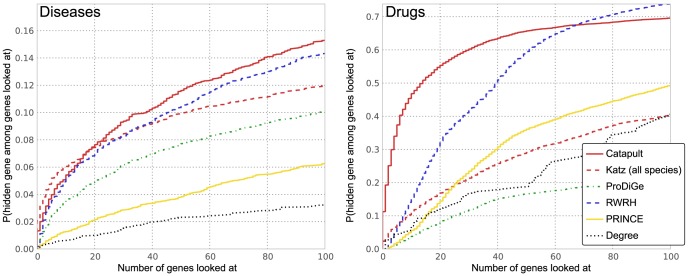
 predictions. The horizontal axis shows the recall rate, i.e. ratio of true positives recovered in the top-
 predictions to the total number of positives for a phenotype (or a drug) in the hidden set. The plots show precision-recall values at various thresholds
  , in the range
  and the value at a given
  is averaged over all the phenotypes (drugs). The plots use the same experimental setup as in Figure 4, and we observe that the comparisons illustrated by precision-recall measure are consistent with the rank cdf measure in Figure 4.
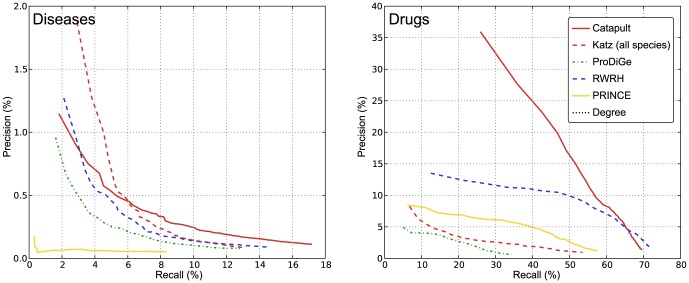
 predictions for a disease. The Katz and C
 predictions for a disease. The Katz and C
 predictions for a disease. The Katz and C
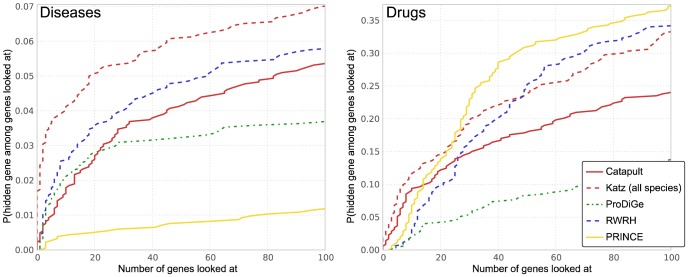
References
-
- Human Protein Reaction Database, HPRD. Available: http://www.hprd.org. Accessed: 2012 Aug.
Publication types
MeSH terms
LinkOut - more resources
Full Text Sources
Other Literature Sources
Molecular Biology Databases
